Chapter 1: Introduction To Maps
Look at a globe, and India sits on a curved surface, its coastline and rivers wrapped around a sphere. Now imagine an instruction arrives: put all of it on a flat sheet of paper. The moment you begin, you meet a problem the globe never had. A sphere cannot be flattened without tearing, stretching or squeezing it somewhere. Every flat map ever made has paid this price — a shape pulled a little out of true, a distance slightly off, an area quietly enlarged.
Before a single line is drawn, the mapmaker must also decide how much of the earth to fit on the page. Choose to show the whole of north India, and Delhi shrinks to a dot beside its name. Choose to show only Delhi, and its streets, railway lines and monuments spread right across the sheet. The same city, the same paper — two completely different maps, and the mapmaker settled which by one decision made at the very start.
This is what separates a map from a rough sketch. A sketch is only lines on paper. A map is a set of deliberate decisions — what scale to use, how to flatten the curve, what to keep and what to leave out, which symbol will stand for a road, a river, a forest. Every map you have ever read is the record of those choices. This chapter is about how they are made.
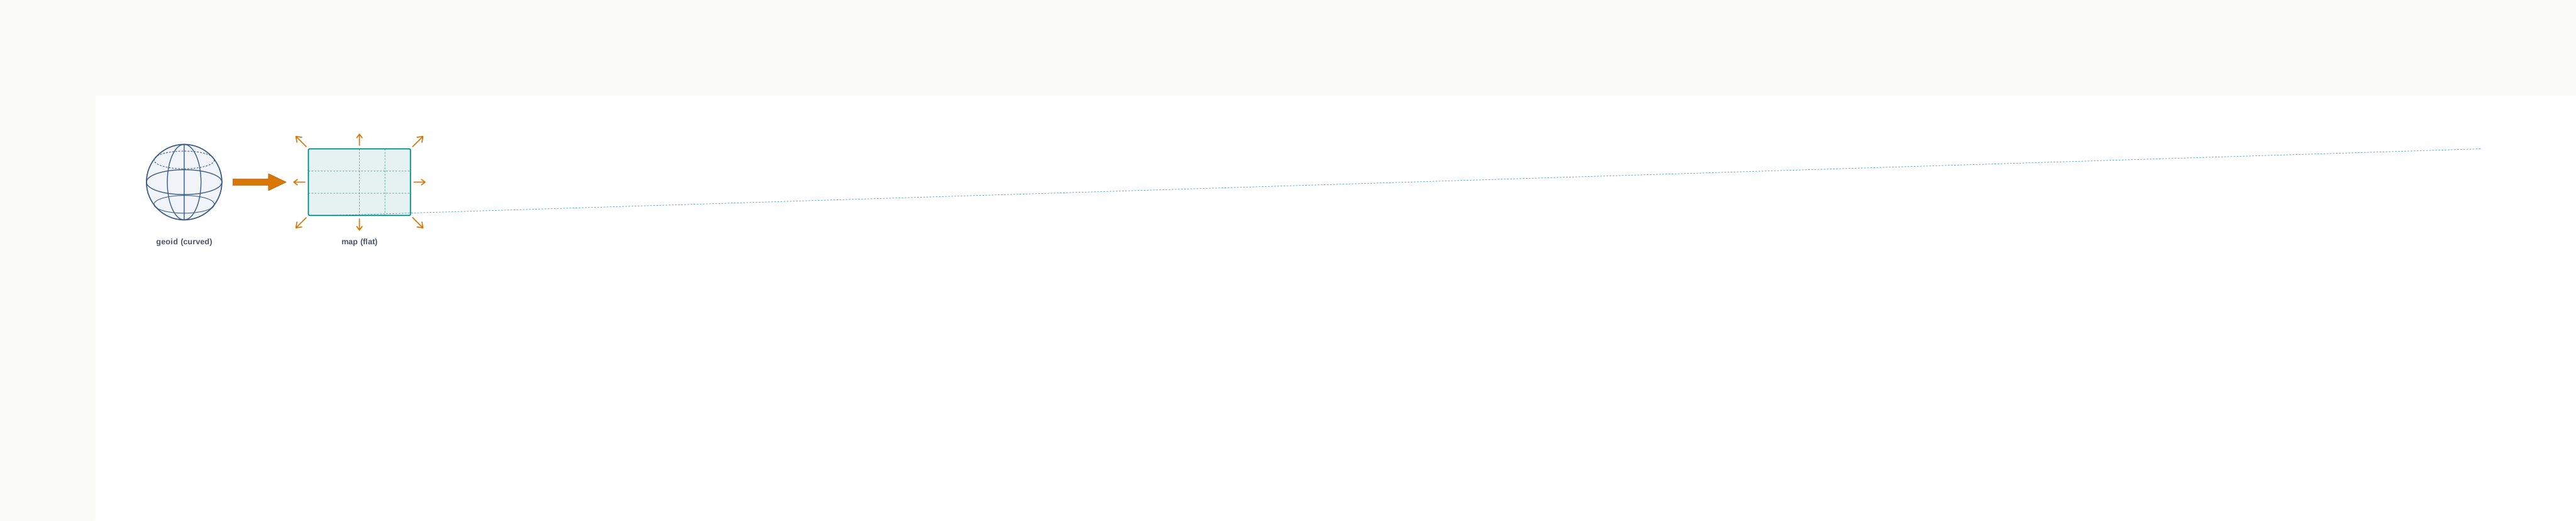
Fig. 1.0 – Curved earth to flat map.
1.1 Introduction
You have already met maps in your other social science books, standing in for the earth or some part of it. Behind every one of them lies a difficulty most readers never notice: the earth is not flat. Its true shape is a geoid, a very slightly flattened sphere — bulging a little at the equator, pressed in a little at the poles. The object that shows this shape most faithfully is a globe (Fig. 1.1). On a globe the earth stays curved, so shapes, sizes, distances and directions all remain true together.
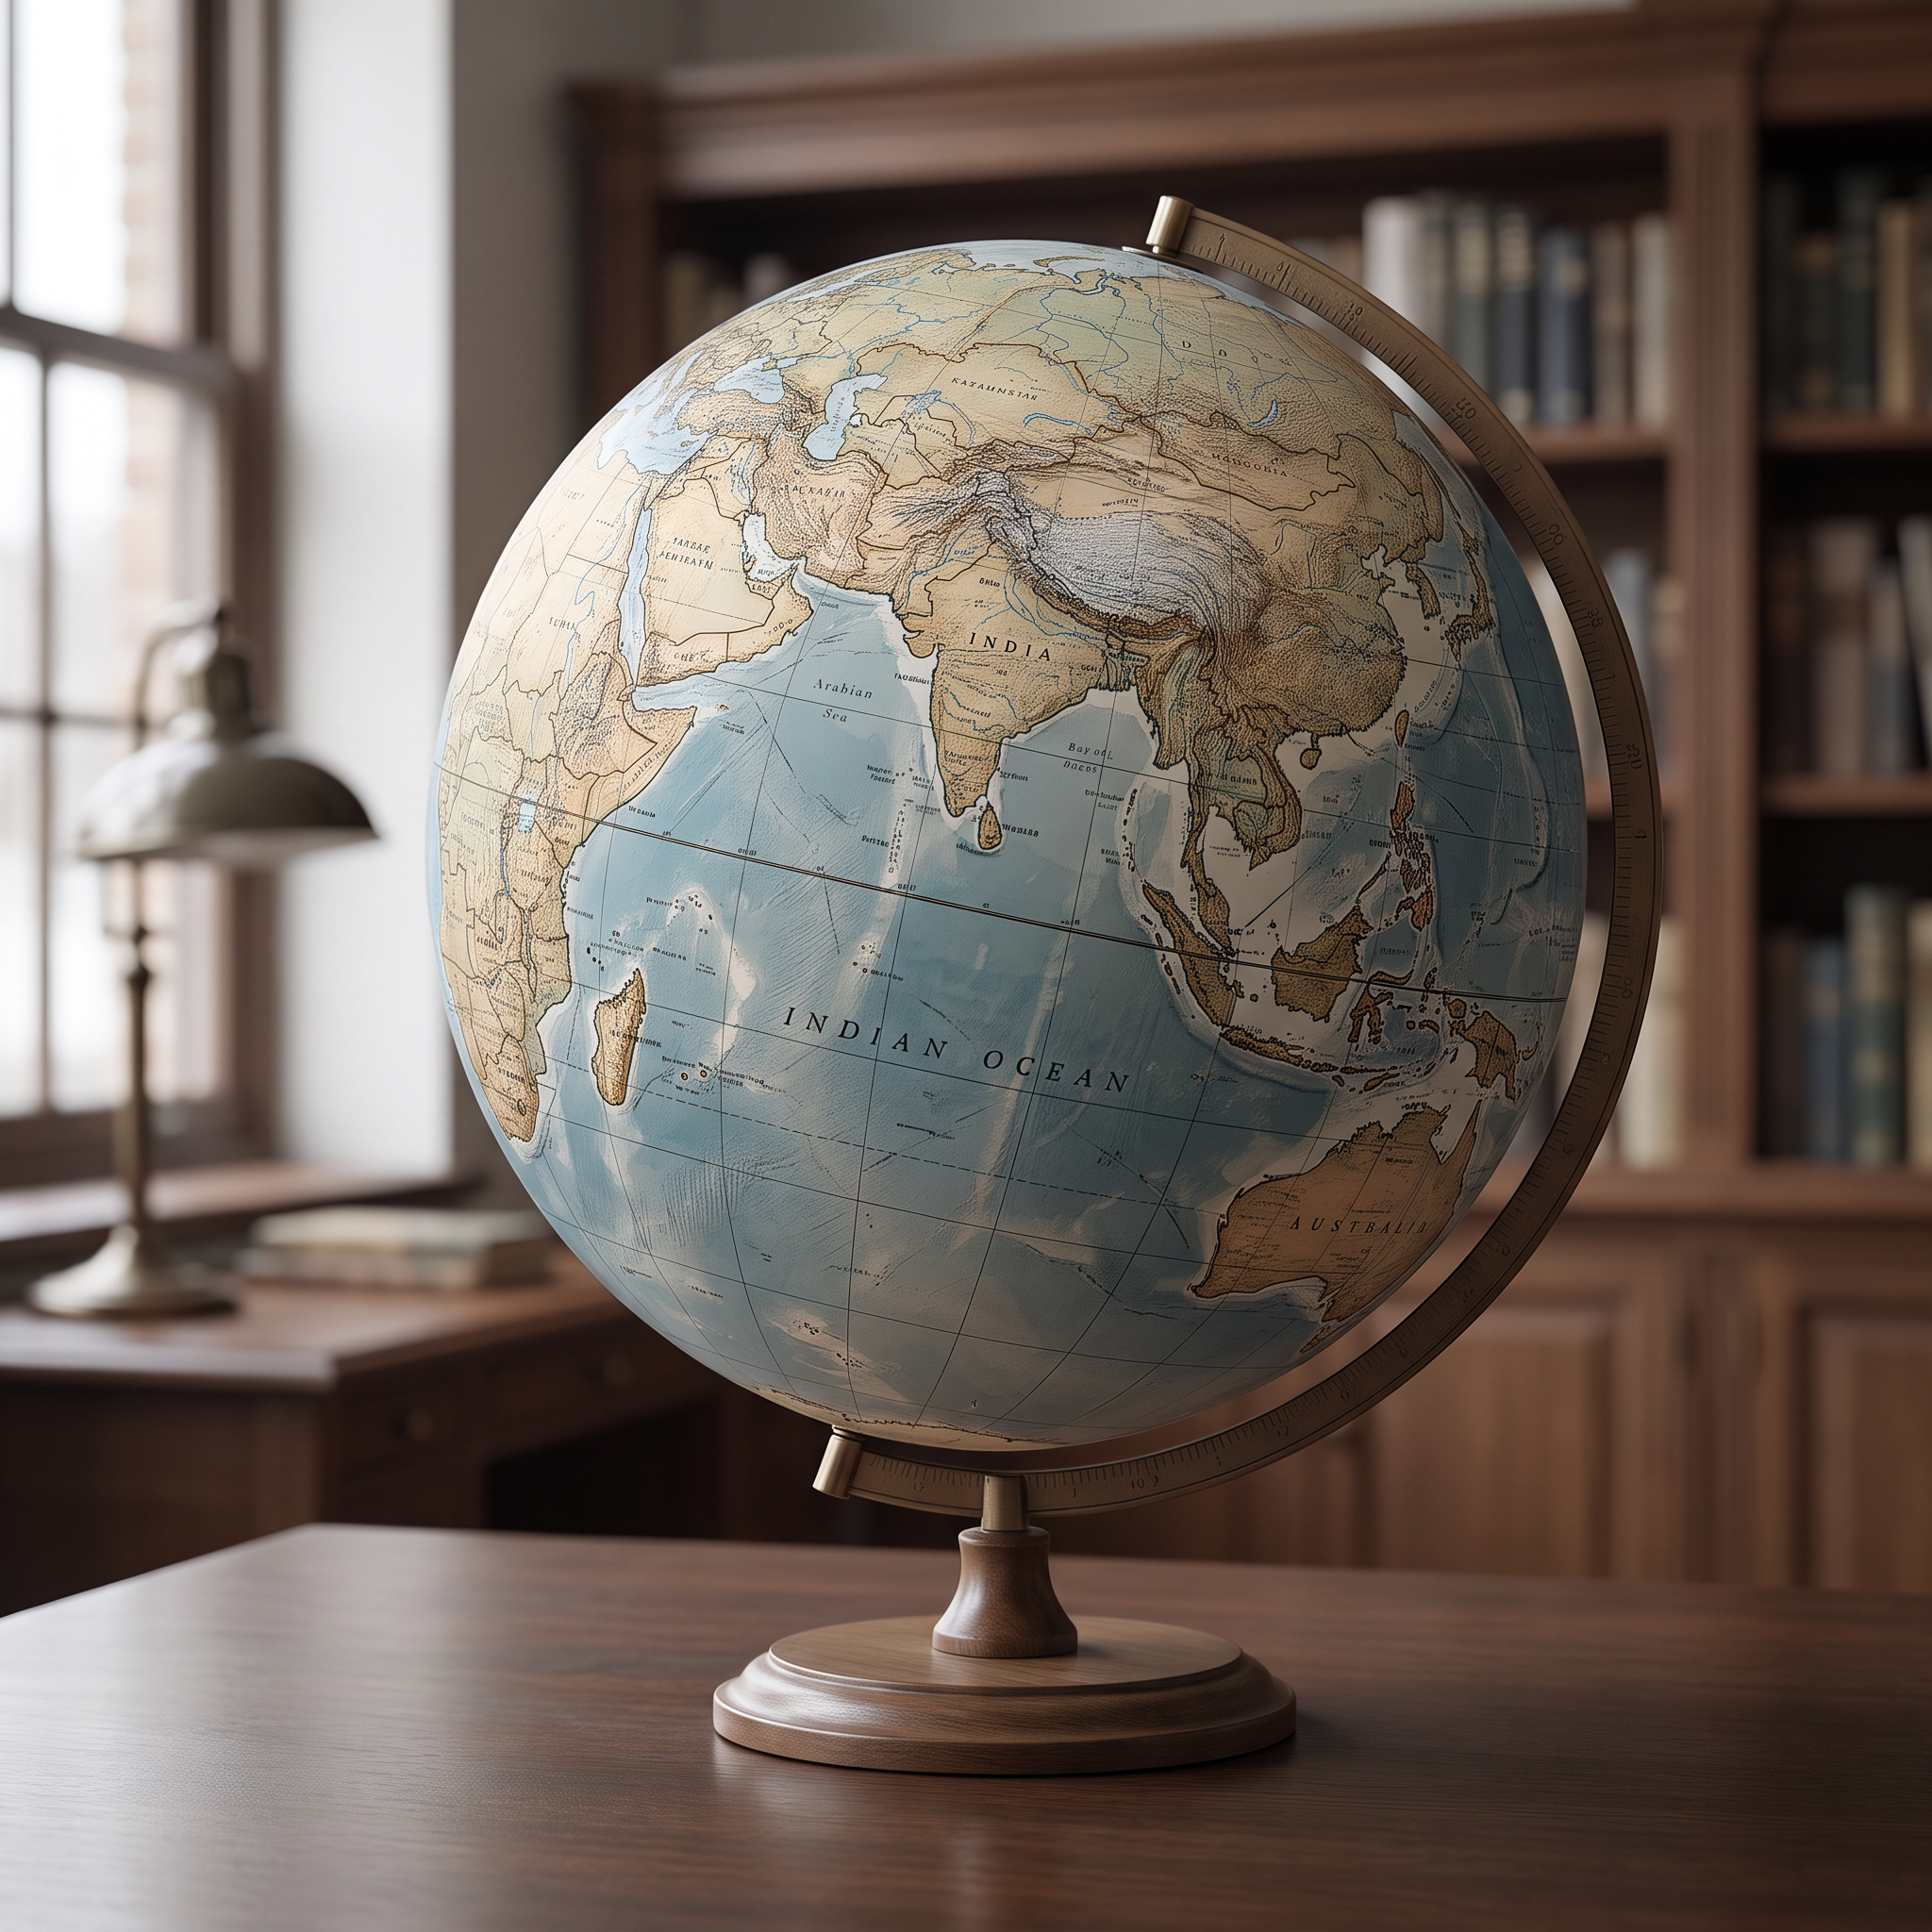
Fig. 1.1 – India on the globe.
From A Curved Earth To Flat Paper
A map does what a globe cannot. It is a simplified picture of the whole earth, or a part of it, laid out on a flat sheet of paper — a two-dimensional form of the three-dimensional earth. To lay a curved surface onto flat paper, the mapmaker uses a system of map projections, a method for transferring the earth’s curve onto a plane. Projection is one of the essential steps this chapter returns to shortly, in section 1.2.2.
A map cannot hold every feature of the earth’s surface at its true size and shape, so it is always drawn at a reduced scale — everything shrunk by the same proportion. Think of your own school campus. A plan of it drawn at its actual size would be as large as the campus itself, and impossible to carry or read. To make it usable, the plan is shrunk to a scale and set on a chosen projection, so that every point on the paper answers to a real point on the ground.
A map also simplifies what it keeps. It does not draw a road as a road or a forest as a forest; it stands them in with symbols, colours and shades, holding on to only what the map is meant to show.
What A Map Really Is
Put these choices together and you have the working definition of a map: a selective, symbolised and generalised representation of the whole or a part of the earth’s surface, drawn on a plane surface at a reduced scale. It is selective, because the mapmaker keeps only what matters for the purpose. It is symbolised, because features are shown by signs, not by pictures. It is generalised, because detail is simplified to suit the scale. And it is always at a reduced scale, because the ground is far larger than the paper it must fit on.
That last requirement — a scale — is what separates a map from a mere sketch. A simple network of lines and polygons drawn without a scale is not a map at all; it is only a sketch (Fig. 1.2). The figure sets the two side by side: on the left, an old freehand sketch of the environs of Delhi, which cannot be trusted for true distance or direction; on the right, a proper map of Delhi drawn to scale, on which measurements hold. The two look alike at a glance, yet only one lets you measure the ground.
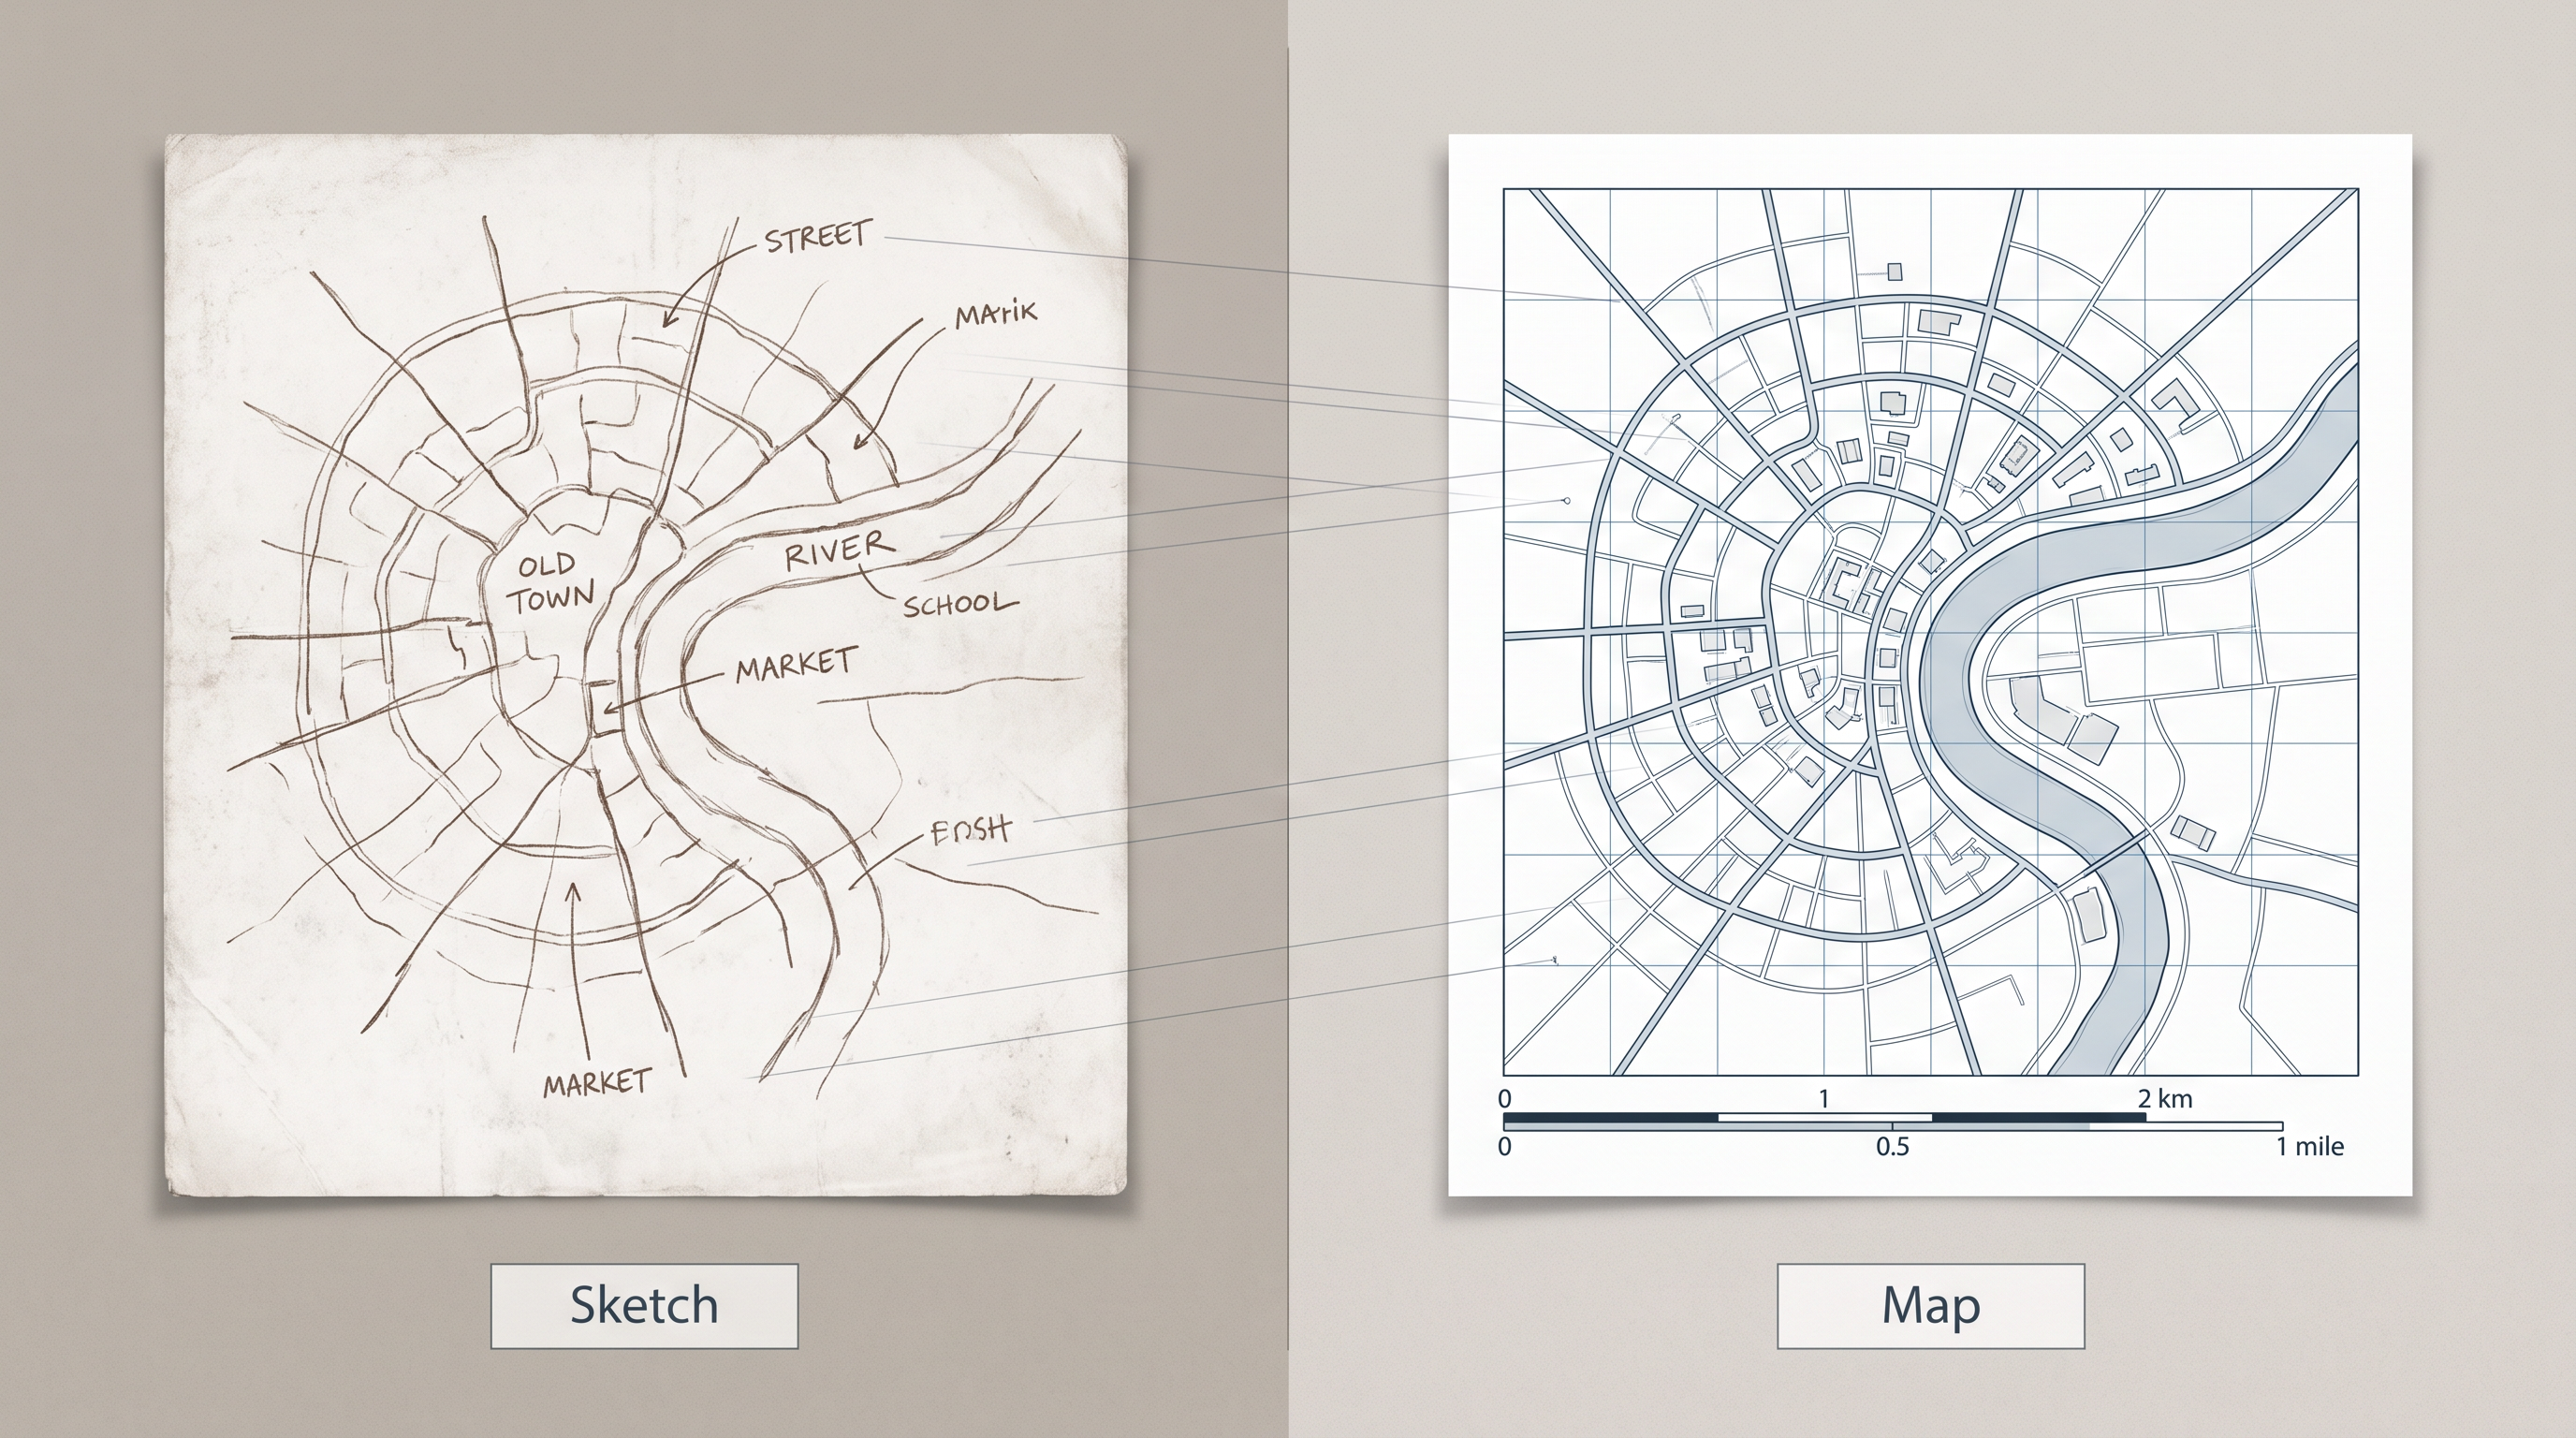
Fig. 1.2 – Sketch and map of Delhi.
In this chapter you will study what maps are made of, the kinds there are, and the uses they are put to.
1.2 Essentials Of Map Making
Maps come in great variety, and at first it is hard to say what they all share. Yet cartography — the art and science of making maps — follows a set of steps that every map has in common. These steps are called the essentials of map making, and there are five of them: scale, projection, generalisation, map design, and map construction and production.
Taken in the order a cartographer works through them, the five run as a single chain (Fig. 1.3).
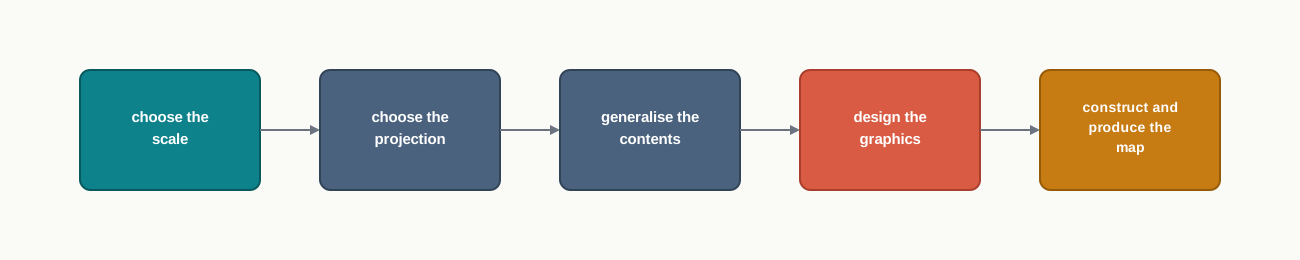
Fig. 1.3 – The five essentials of map making.
1.2.1 Scale
Every map is a reduction, so the first decision a mapmaker takes is the scale — how far the ground is shrunk to fit the paper. This choice matters more than any other, because the scale sets a firm limit on how much information a map can carry and how much real detail it can show.
A larger scale shrinks the ground less, so a small area fills the sheet and fine detail survives. A smaller scale shrinks the ground more, so a large area fits on the page but much of the detail is lost. Figure 1.4 makes this visible: it shows the same region around Delhi drawn at a series of scales, and you can watch the detail appear as the scale grows.
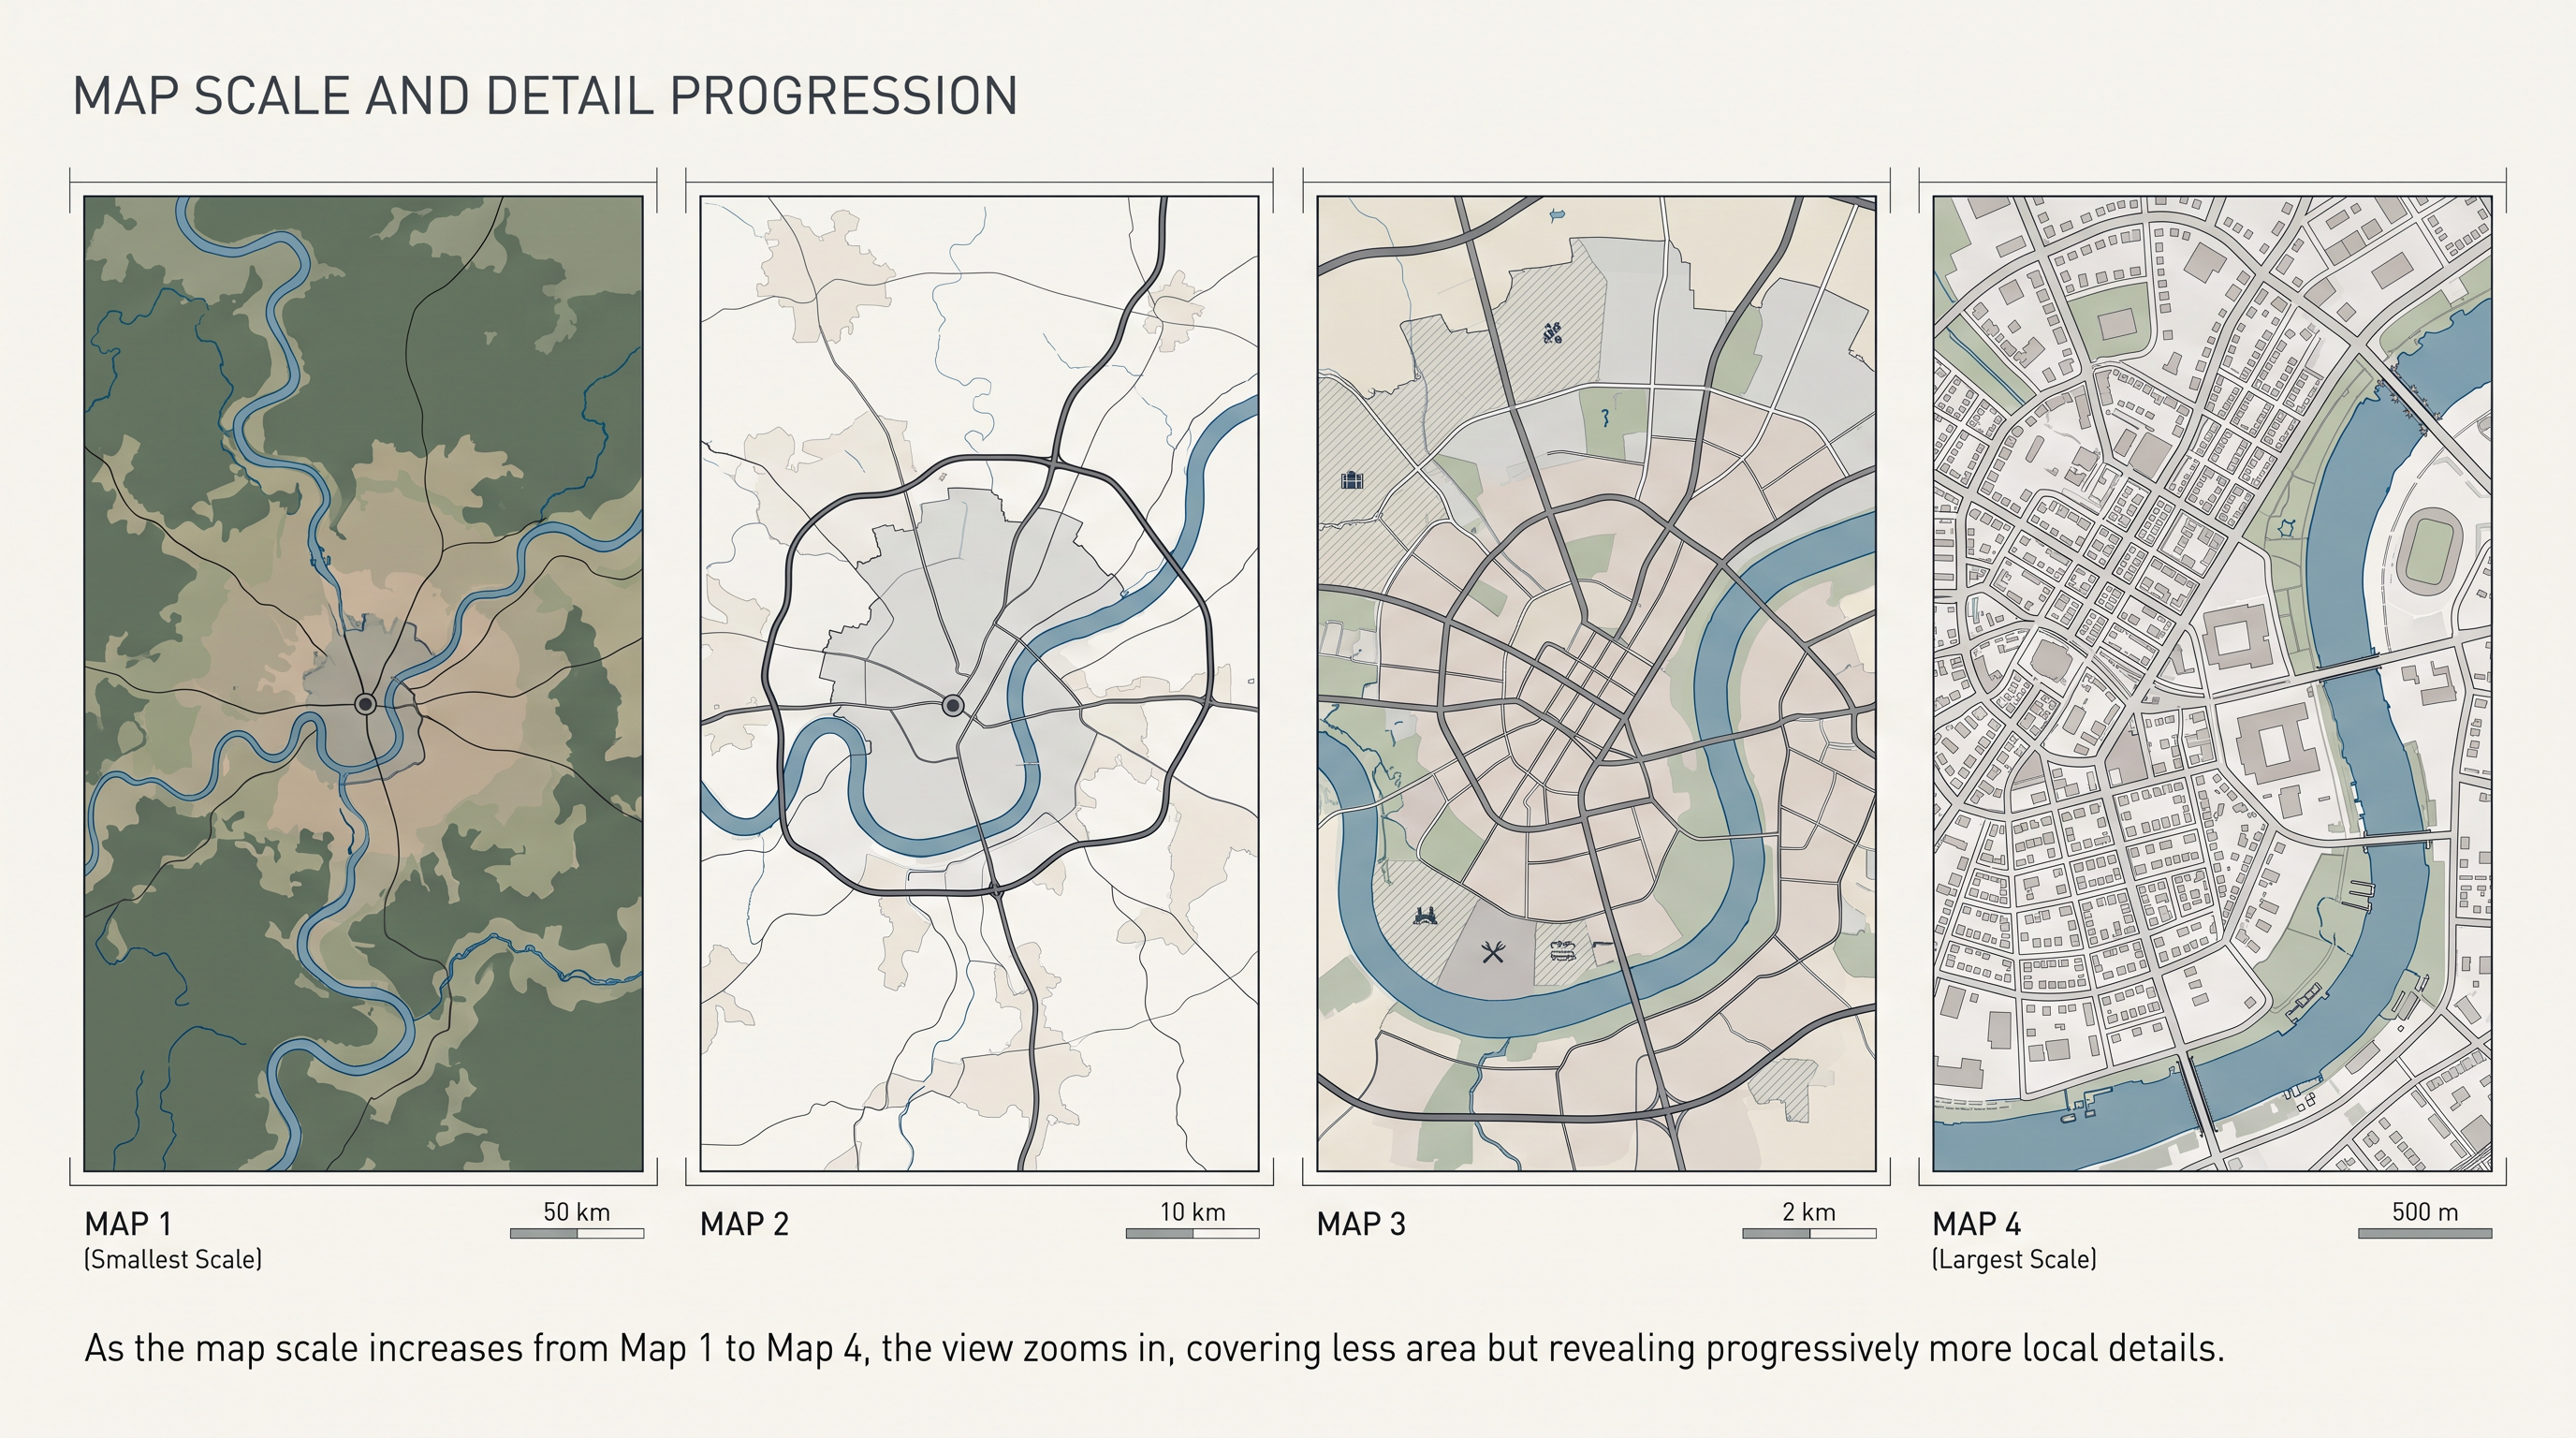
Fig. 1.4 – Effect of scale on mapped information.
Reading the extracts in order, the lesson is plain. A mapmaker does not add detail to a small-scale map by trying harder. The scale decides in advance how much can be shown, before a single feature is drawn.
1.2.2 Projection
A map is a flat sheet standing in for a curved earth, and getting from one to the other is the second essential. The earth’s all-side-curved, geoidal surface has to be transformed onto a plane. This is a radical change, and it cannot be done cleanly. The transformation forces unavoidable changes in directions, distances, areas and shapes, so that they no longer match the geoid exactly. A system for making this transformation — turning the spherical surface into a plane one — is a map projection. Because every projection distorts something, choosing, using and constructing the right one is of prime importance in map making.
1.2.3 Generalisation
Every map is drawn with a definite objective, and that objective decides what goes on it. A general purpose map shows information of a broad kind — relief, drainage, vegetation, settlements, means of transport, and so on. A special purpose map instead carries one or a few chosen themes, such as population density, soil types or the location of industries. The two differ in what they include: the first tries to give an all-round picture, while the second concentrates on selected themes. Both, however, must still choose their contents with the purpose kept in front.
Because a map is shrunk to a reduced scale to serve that purpose, the third task is to generalise its contents. To generalise is to select the data that matters for the chosen theme and simplify it to suit the scale, leaving out what would only clutter the page.
1.2.4 Map Design
The fourth task is map design — planning how the map will look and how it will communicate. It covers the choice of symbols and their size and form, the style of lettering, the width of lines, the selection of colours and shades, the arrangement of the various elements on the sheet, and the design of the map legend, the key that tells the reader what each symbol stands for. Design is a demanding part of map making, because a map works only if its graphics carry their meaning clearly and at a glance.
1.2.5 Map Construction And Production
The fifth and final task is constructing the map and producing copies of it. In earlier times this was done by hand: maps were drawn with pen and ink and printed mechanically. In recent times the work has been transformed by computer-assisted mapping and photo-printing, which now carry out much of the drawing and reproduction that hands once did.
1.3 History Of Map Making
Map making is as old as humanity itself. People have always needed to record where things are — water, a route, a boundary — and the history of maps is really the history of that need being met with steadily better methods.
Maps In The Ancient World
The oldest known map was found in Mesopotamia — the land between the Tigris and Euphrates rivers, in modern Iraq — drawn on a clay tablet that belongs to 2,500 B.C. Much later, Greek and Arab geographers laid the foundation of modern cartography. Figure 1.5 shows the world map of Ptolemy, a Greek scholar of the ancient world. Two of their contributions still shape every map today: they measured the circumference of the Earth, and they built the system of geographical coordinates — the grid of latitude and longitude by which any point on the earth can be fixed.
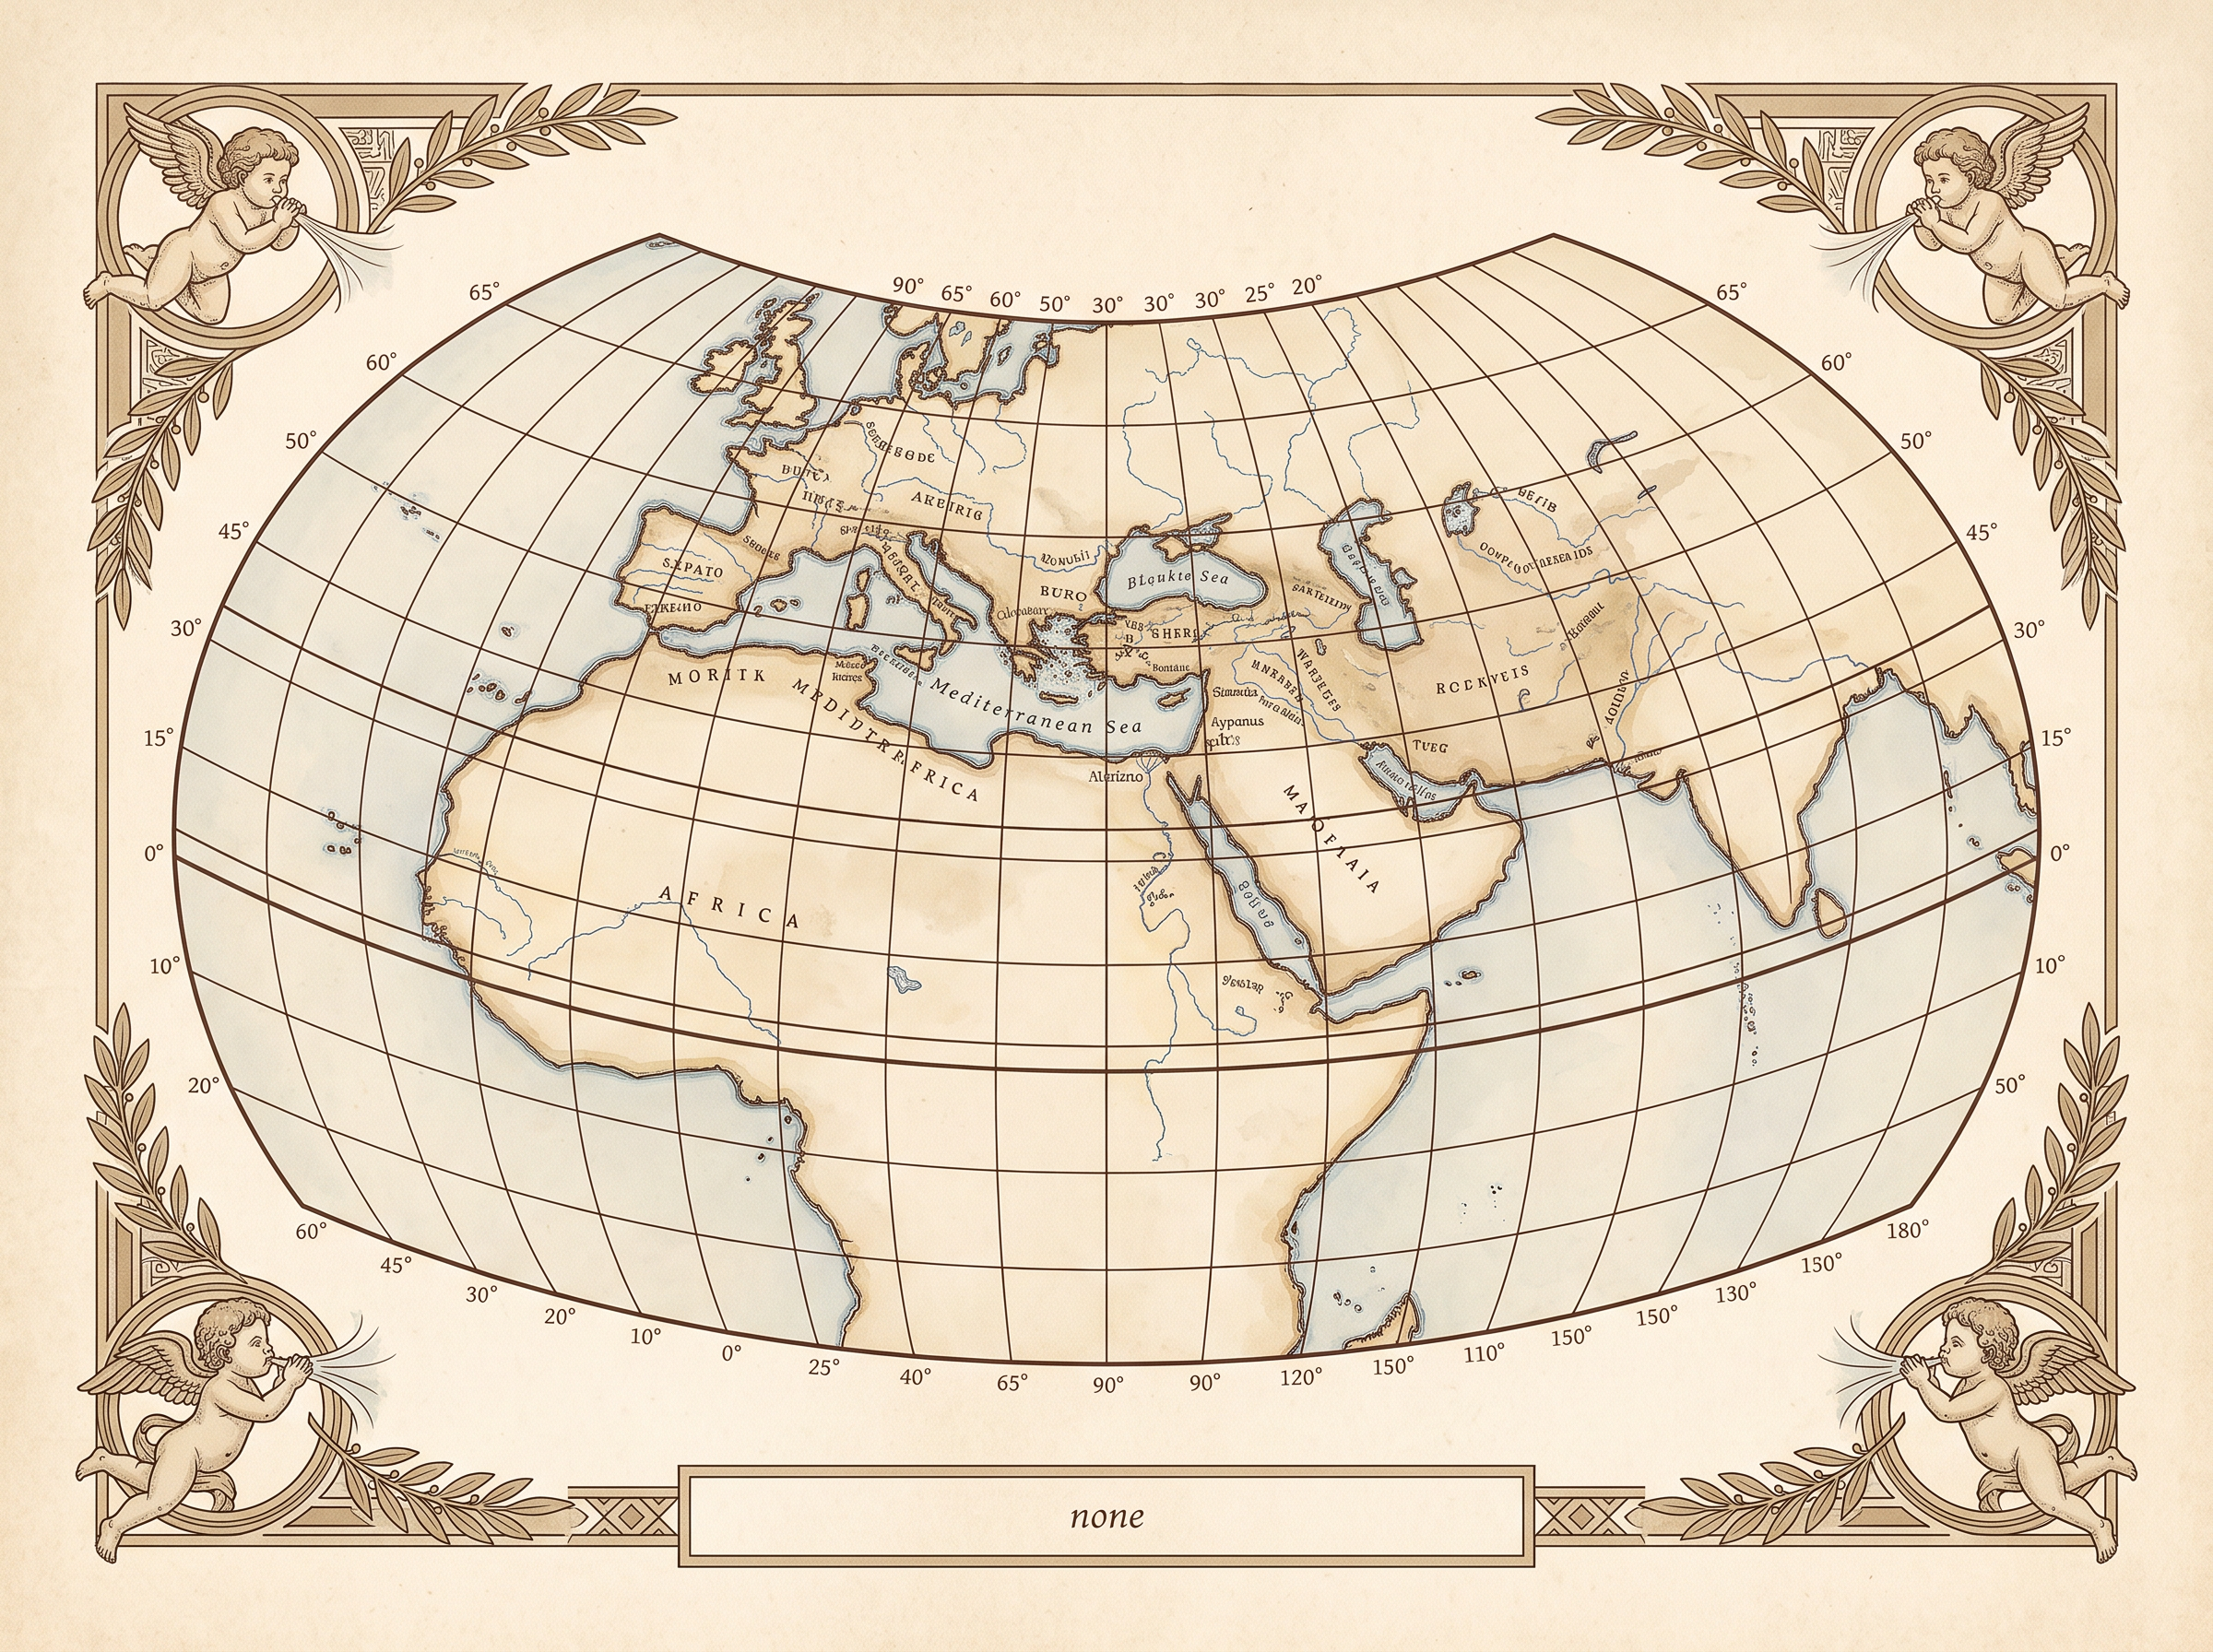
Fig. 1.5 – Ptolemy’s world map.
In the early modern period the art and science were revived, with great effort spent on reducing the errors that appear when the geoid is flattened onto a plane. Maps were now drawn on different projections, each chosen to keep one thing true — real directions, correct distances, or accurate areas. From the nineteenth century, a new source arrived: aerial photography supplemented ground surveys, and photographs taken from above gave map making a strong push through the nineteenth and twentieth centuries.
Map Making In India
In India the foundation was laid in the Vedic period, when astronomical truths and cosmological ideas were first set down. These were crystallised into ‘sidhantas’, the laws worked out in the classical treatises of Arya Bhatta, Varahamihira, Bhaskara and others. Ancient Indian scholars pictured the known world as seven ‘dwipas’ (Fig. 1.6), and the Mahabharata imagined a round world ringed by water (Fig. 1.7).
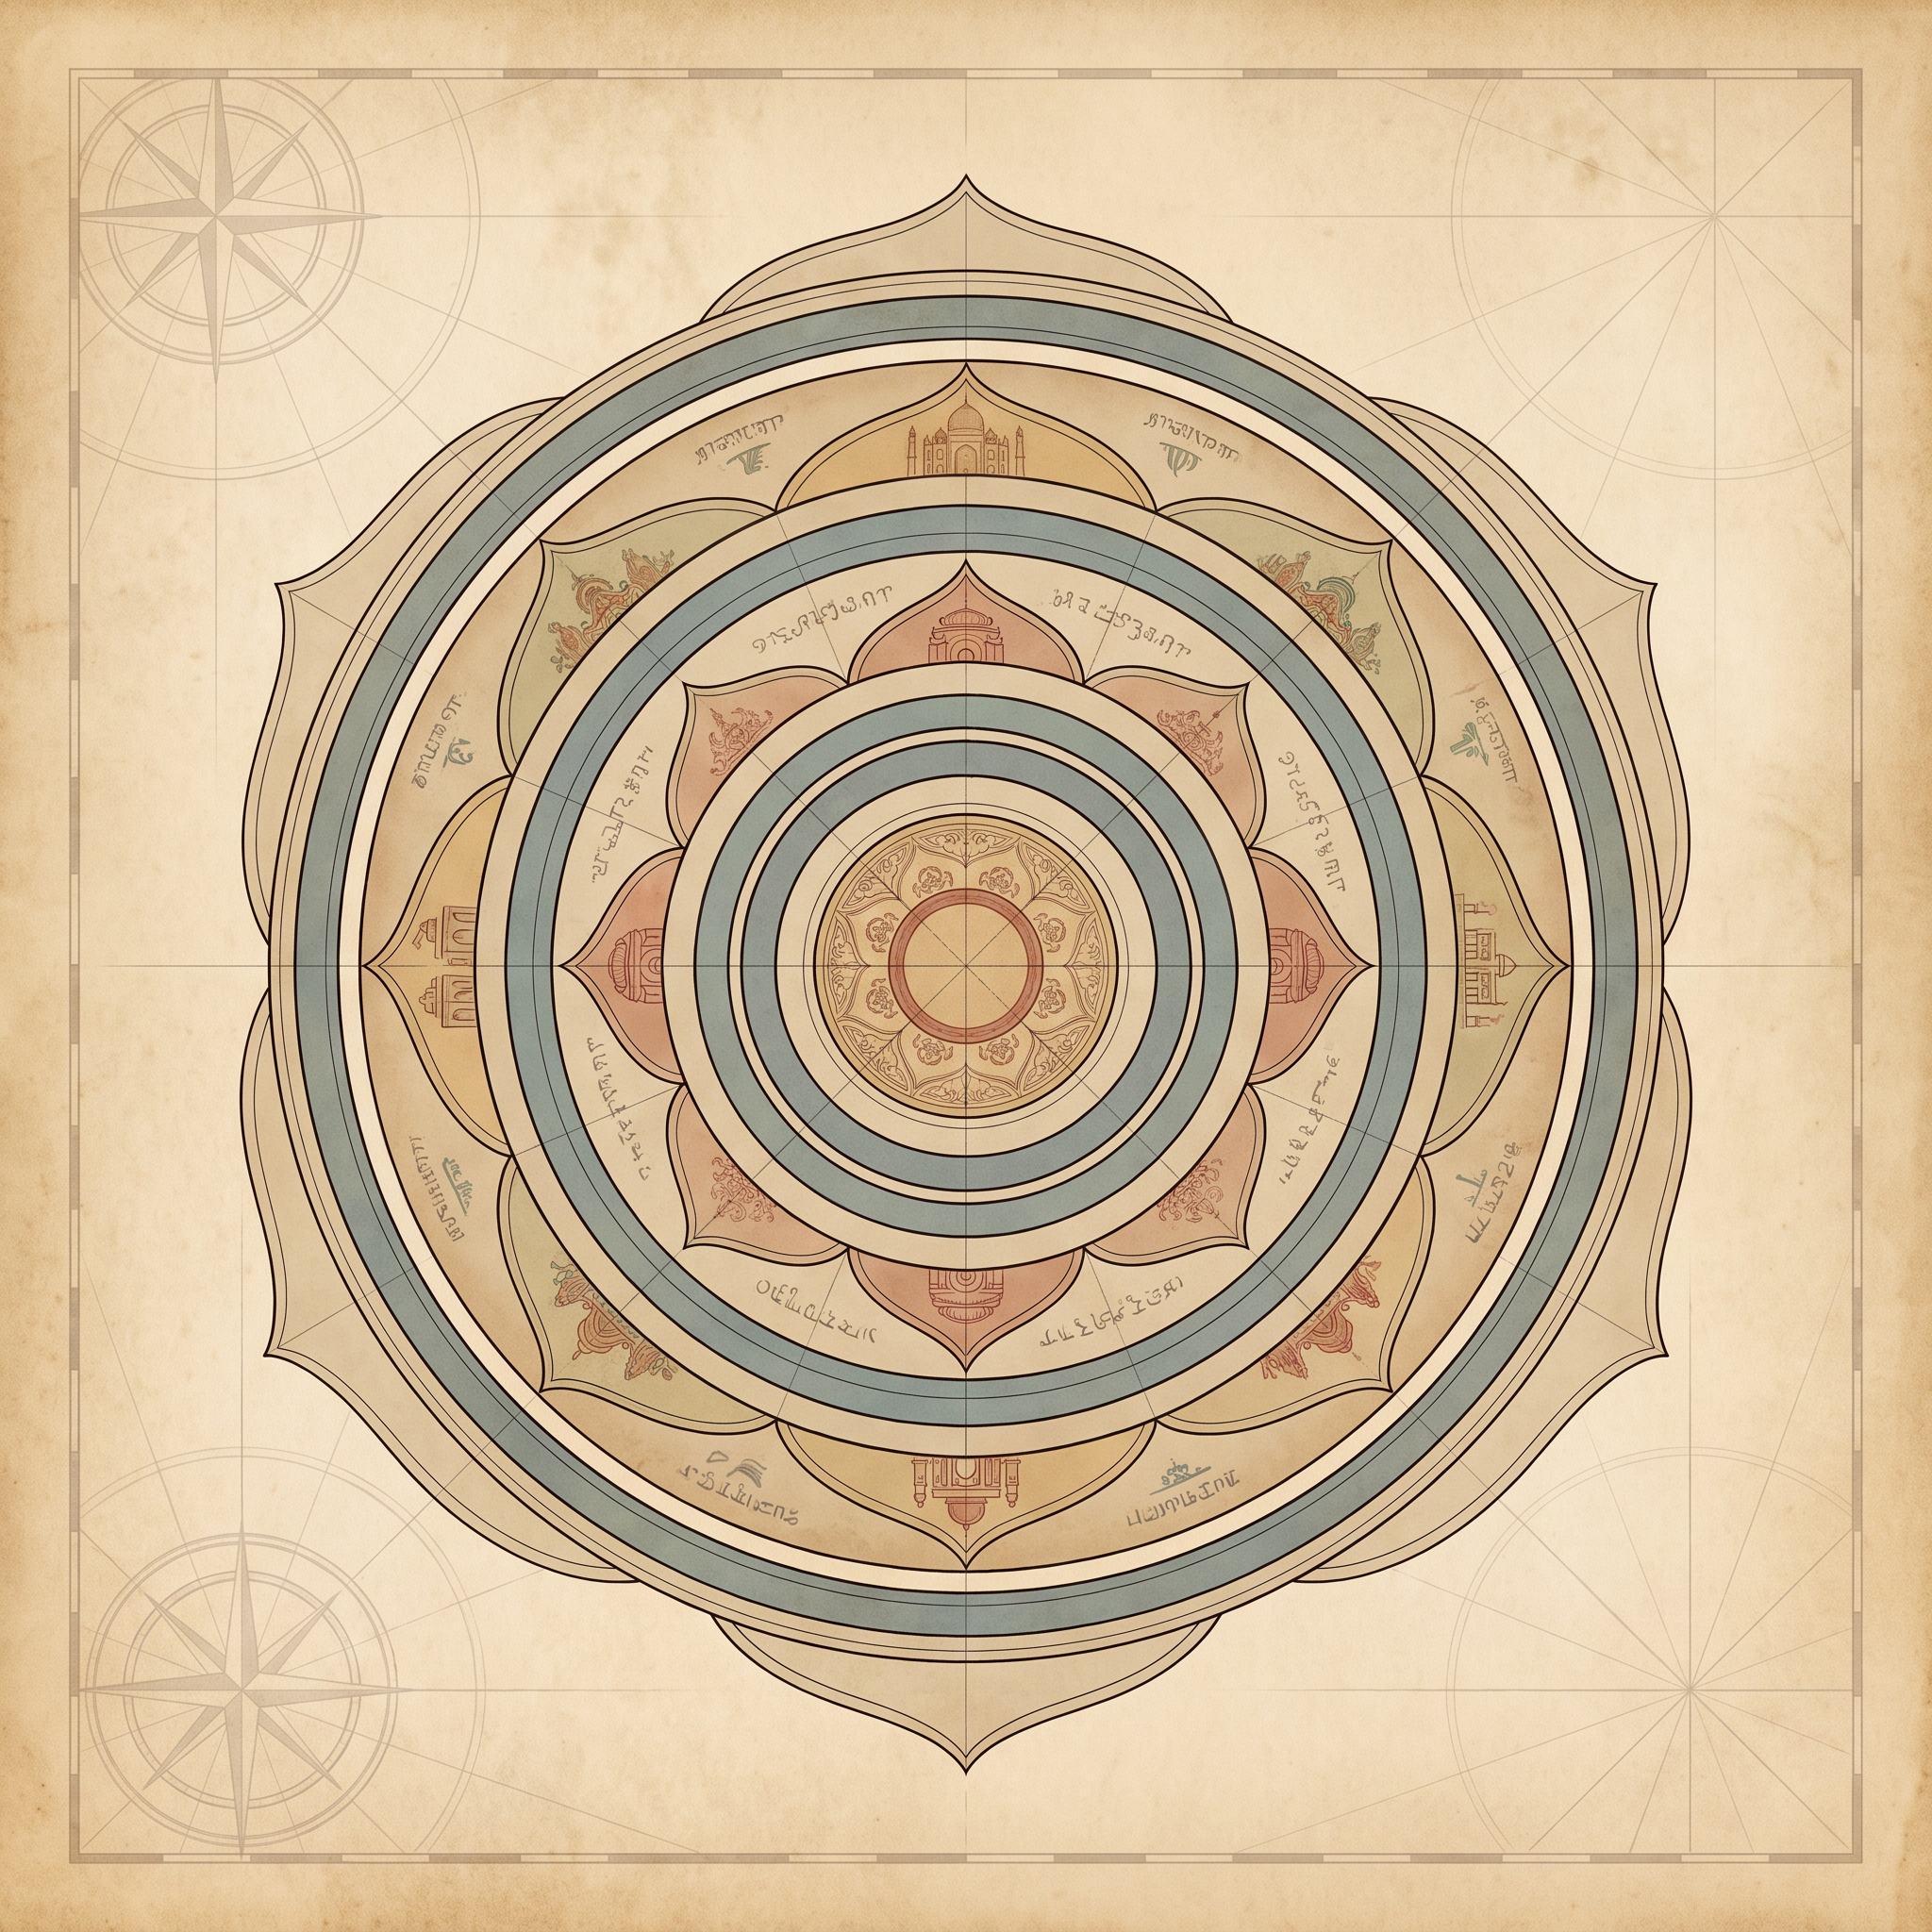
Fig. 1.6 – Seven dwipas of the ancient world.
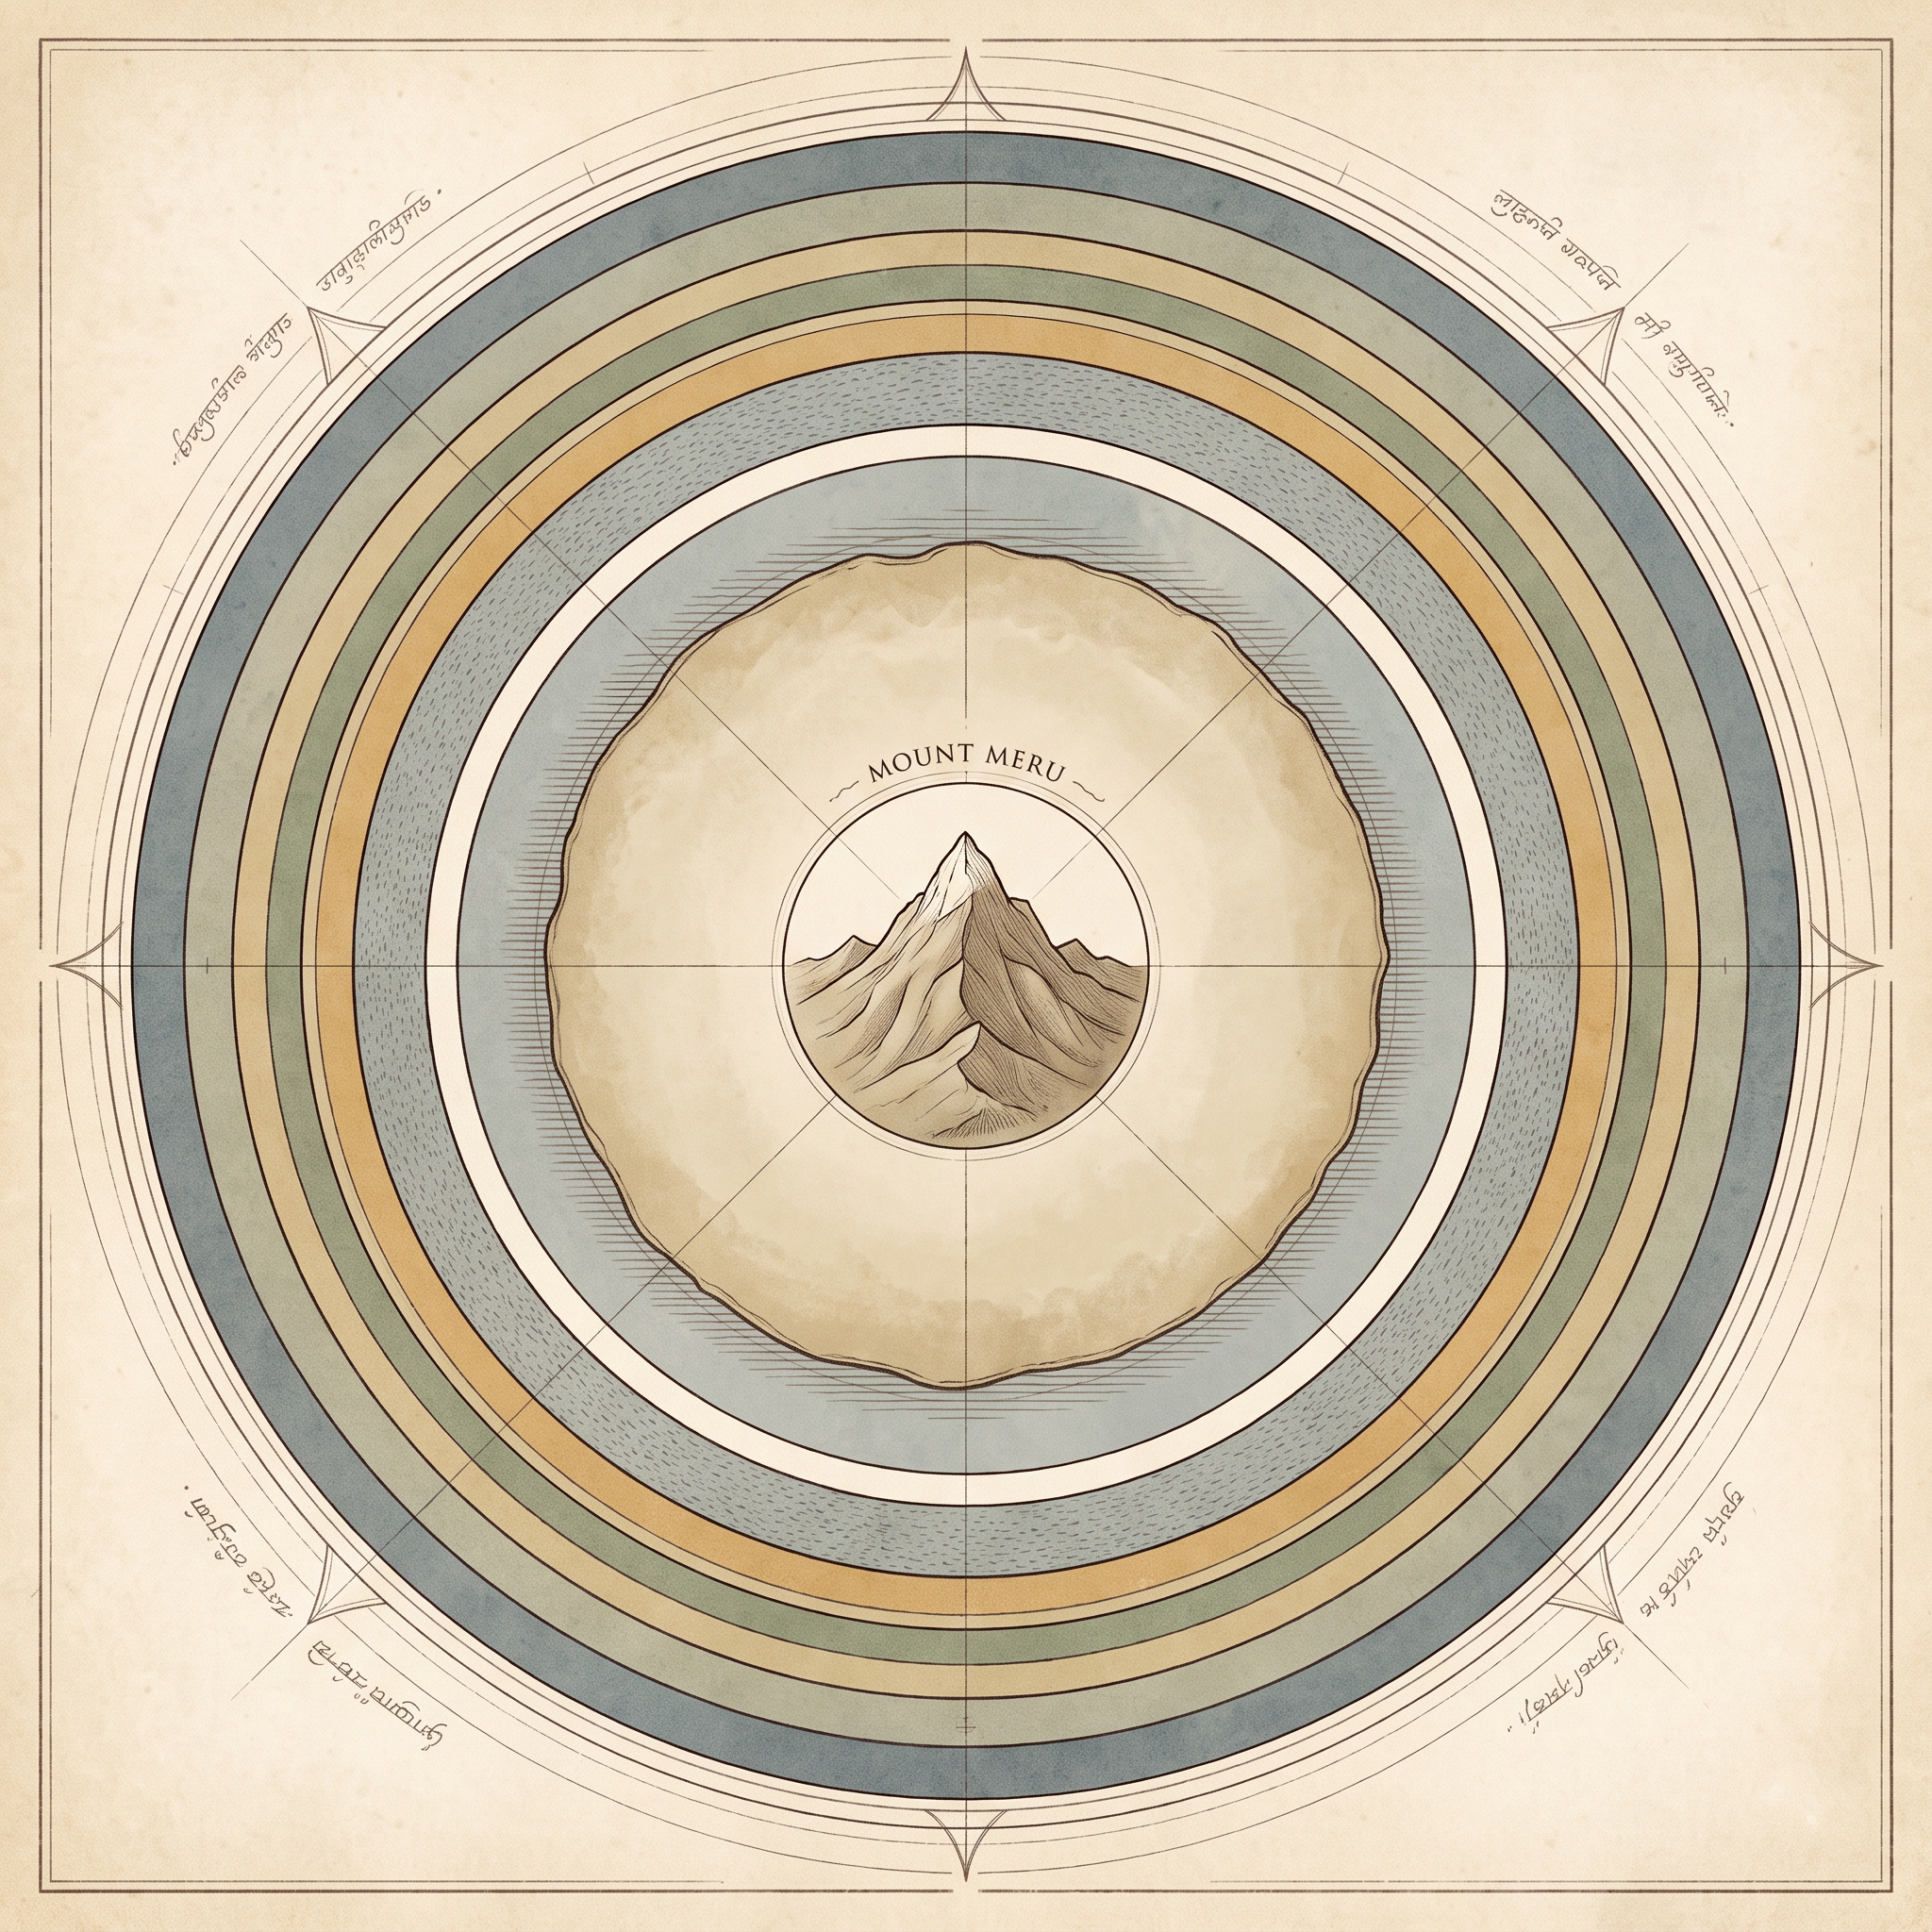
Fig. 1.7 – The round world in the Mahabharata.
In the medieval period, mapping became tied to revenue. Todarmal pioneered land surveying and map making as part of the revenue collection system, and Sher Shah Suri’s revenue maps enriched these techniques further. Systematic, up-to-date mapping of the whole country began with the setting up of the Survey of India in 1767, an effort that culminated in the map of Hindustan in 1785. Today the Survey of India still produces maps of the entire country at many different scales.
1.3.1 Types Of Maps Based On Scale
Because scale is the mapmaker’s first decision, it also gives the first way of sorting maps. On the basis of scale, maps fall into two groups. A large-scale map shows a small area at a relatively large scale, so it can carry fine detail — topographical maps at 1 : 250,000, 1 : 50,000 or 1 : 25,000, and village maps, city zonal plans and house plans at 1 : 4,000, 1 : 2,000 and 1 : 500, are all large-scale maps. A small-scale map does the opposite: it shows a large area at a small scale, so its detail is heavily generalised — atlas maps and wall maps are the common examples. The two share a purpose but pull in opposite directions: one trades area for detail, the other trades detail for area.
Large-Scale Maps
Large-scale maps split further into cadastral and topographical maps. A cadastral map takes its name from the French word cadastre, a register of territorial property, and that is what it records: it shows the ownership of land by marking out the field boundaries of farmland and the plans of individual houses in towns. Government agencies prepare these maps to collect revenue and taxes and to keep a record of who owns what, and they are drawn at a very large scale — village cadastral maps at 1 : 4,000, and city plans at 1 : 2,000 and larger.
A topographical map is also drawn at a fairly large scale, but for a different job. It rests on precise surveys and is issued as a series of sheets by a country’s national mapping agency. In India the Survey of India maps the whole country at 1 : 250,000, 1 : 50,000 and 1 : 25,000 — the scales you saw compared in Fig. 1.4. Topographical sheets use a uniform set of colours and symbols to show relief, drainage, farmland, forest, settlements, means of communication, and the location of schools, post offices and other services.
Small-Scale Maps
Small-scale maps split into wall maps and atlas maps. A wall map is drawn on large paper or a plastic base for use in a classroom or lecture hall; its scale is smaller than a topographical map’s but larger than an atlas map’s. An atlas map is very small in scale, covering large areas in a highly generalised way. Even so, a good atlas map works as a graphic encyclopaedia: consulted properly, it gives a wealth of information about location, relief, drainage, climate, vegetation, the distribution of cities and towns, population, industries, transport networks, and tourism and heritage sites — for the world, a continent, a country or a region.
1.3.2 Types Of Maps Based On Function
Maps can also be sorted by what they are for. A political map exists to show administrative divisions; a soil map to show the spread of soils. Broadly, by function, maps divide into two families: physical maps, which show the earth’s natural features, and cultural maps, which show the features people have made.
Physical Maps
Physical maps show natural features — relief, geology, soils, drainage, and the elements of weather, climate and vegetation. A relief map shows the general shape of the land: mountains and valleys, plains, plateaus and drainage. Figure 1.8 is the relief and slope map of Nagpur district, in the Vidarbha region of eastern Maharashtra.
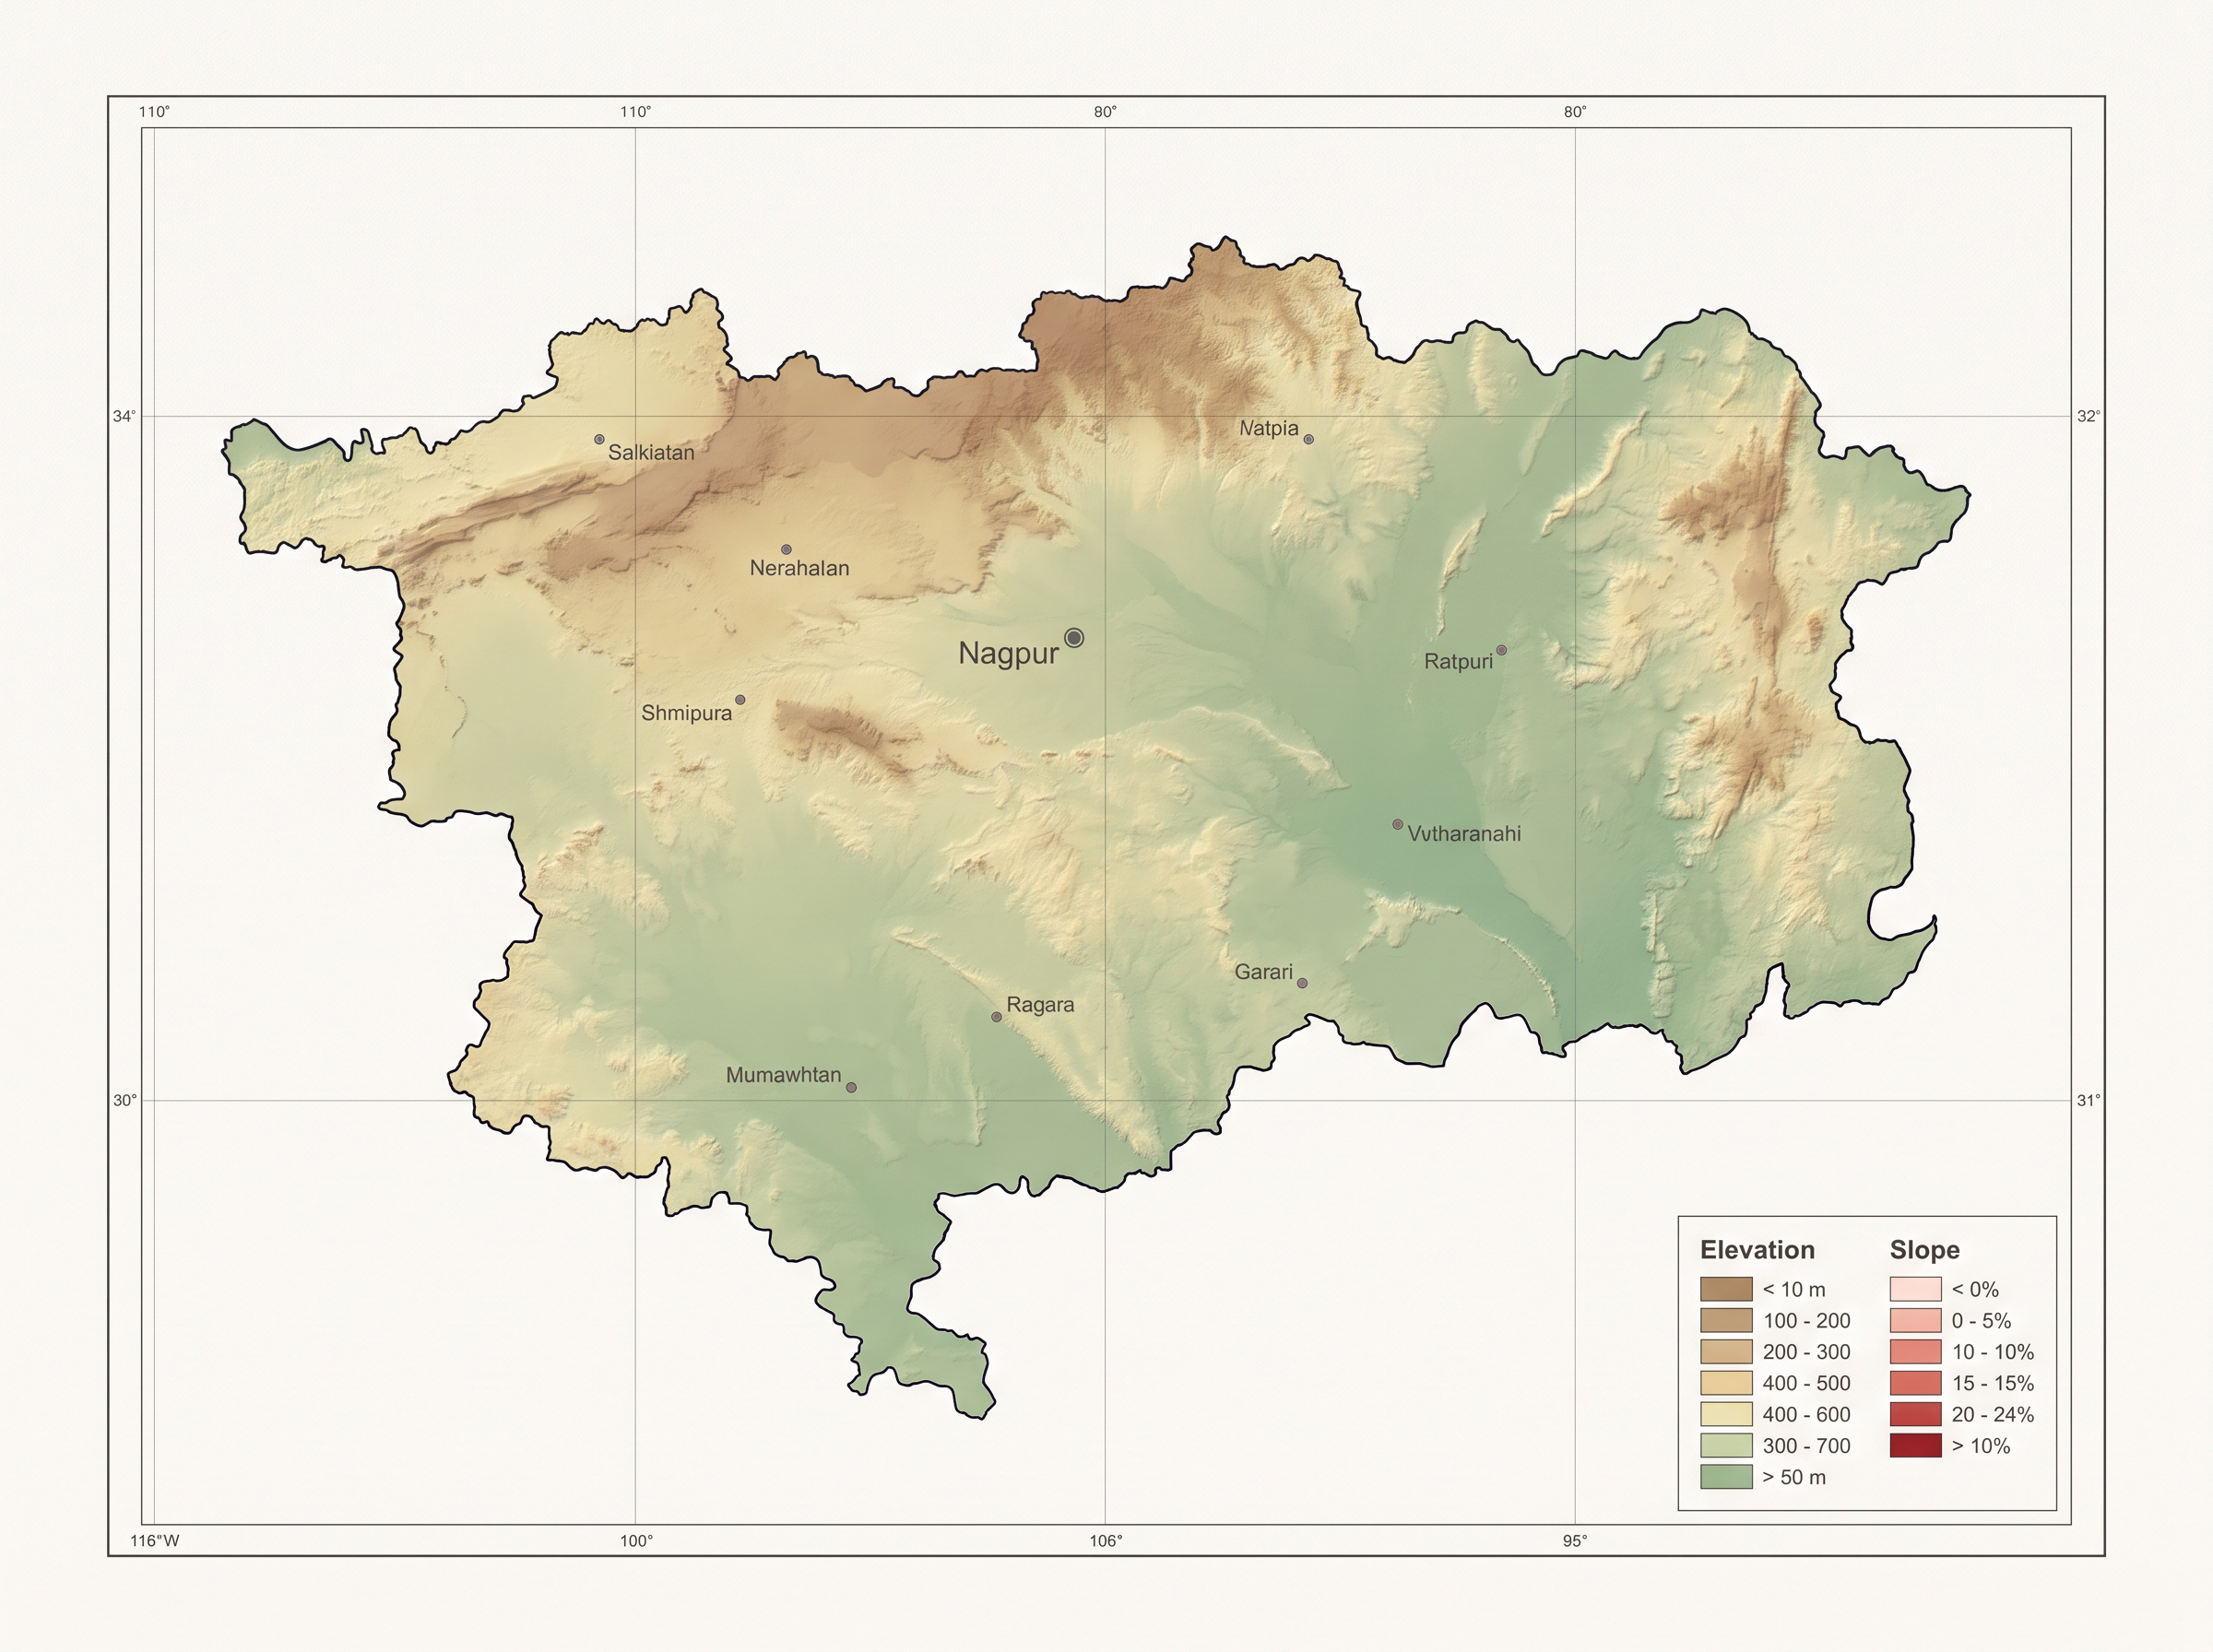
Fig. 1.8 – Relief and slope map of Nagpur.
A geological map shows what the land is made of — its geological structures and rock types. Figure 1.9 maps the rocks and minerals of Nagpur district.
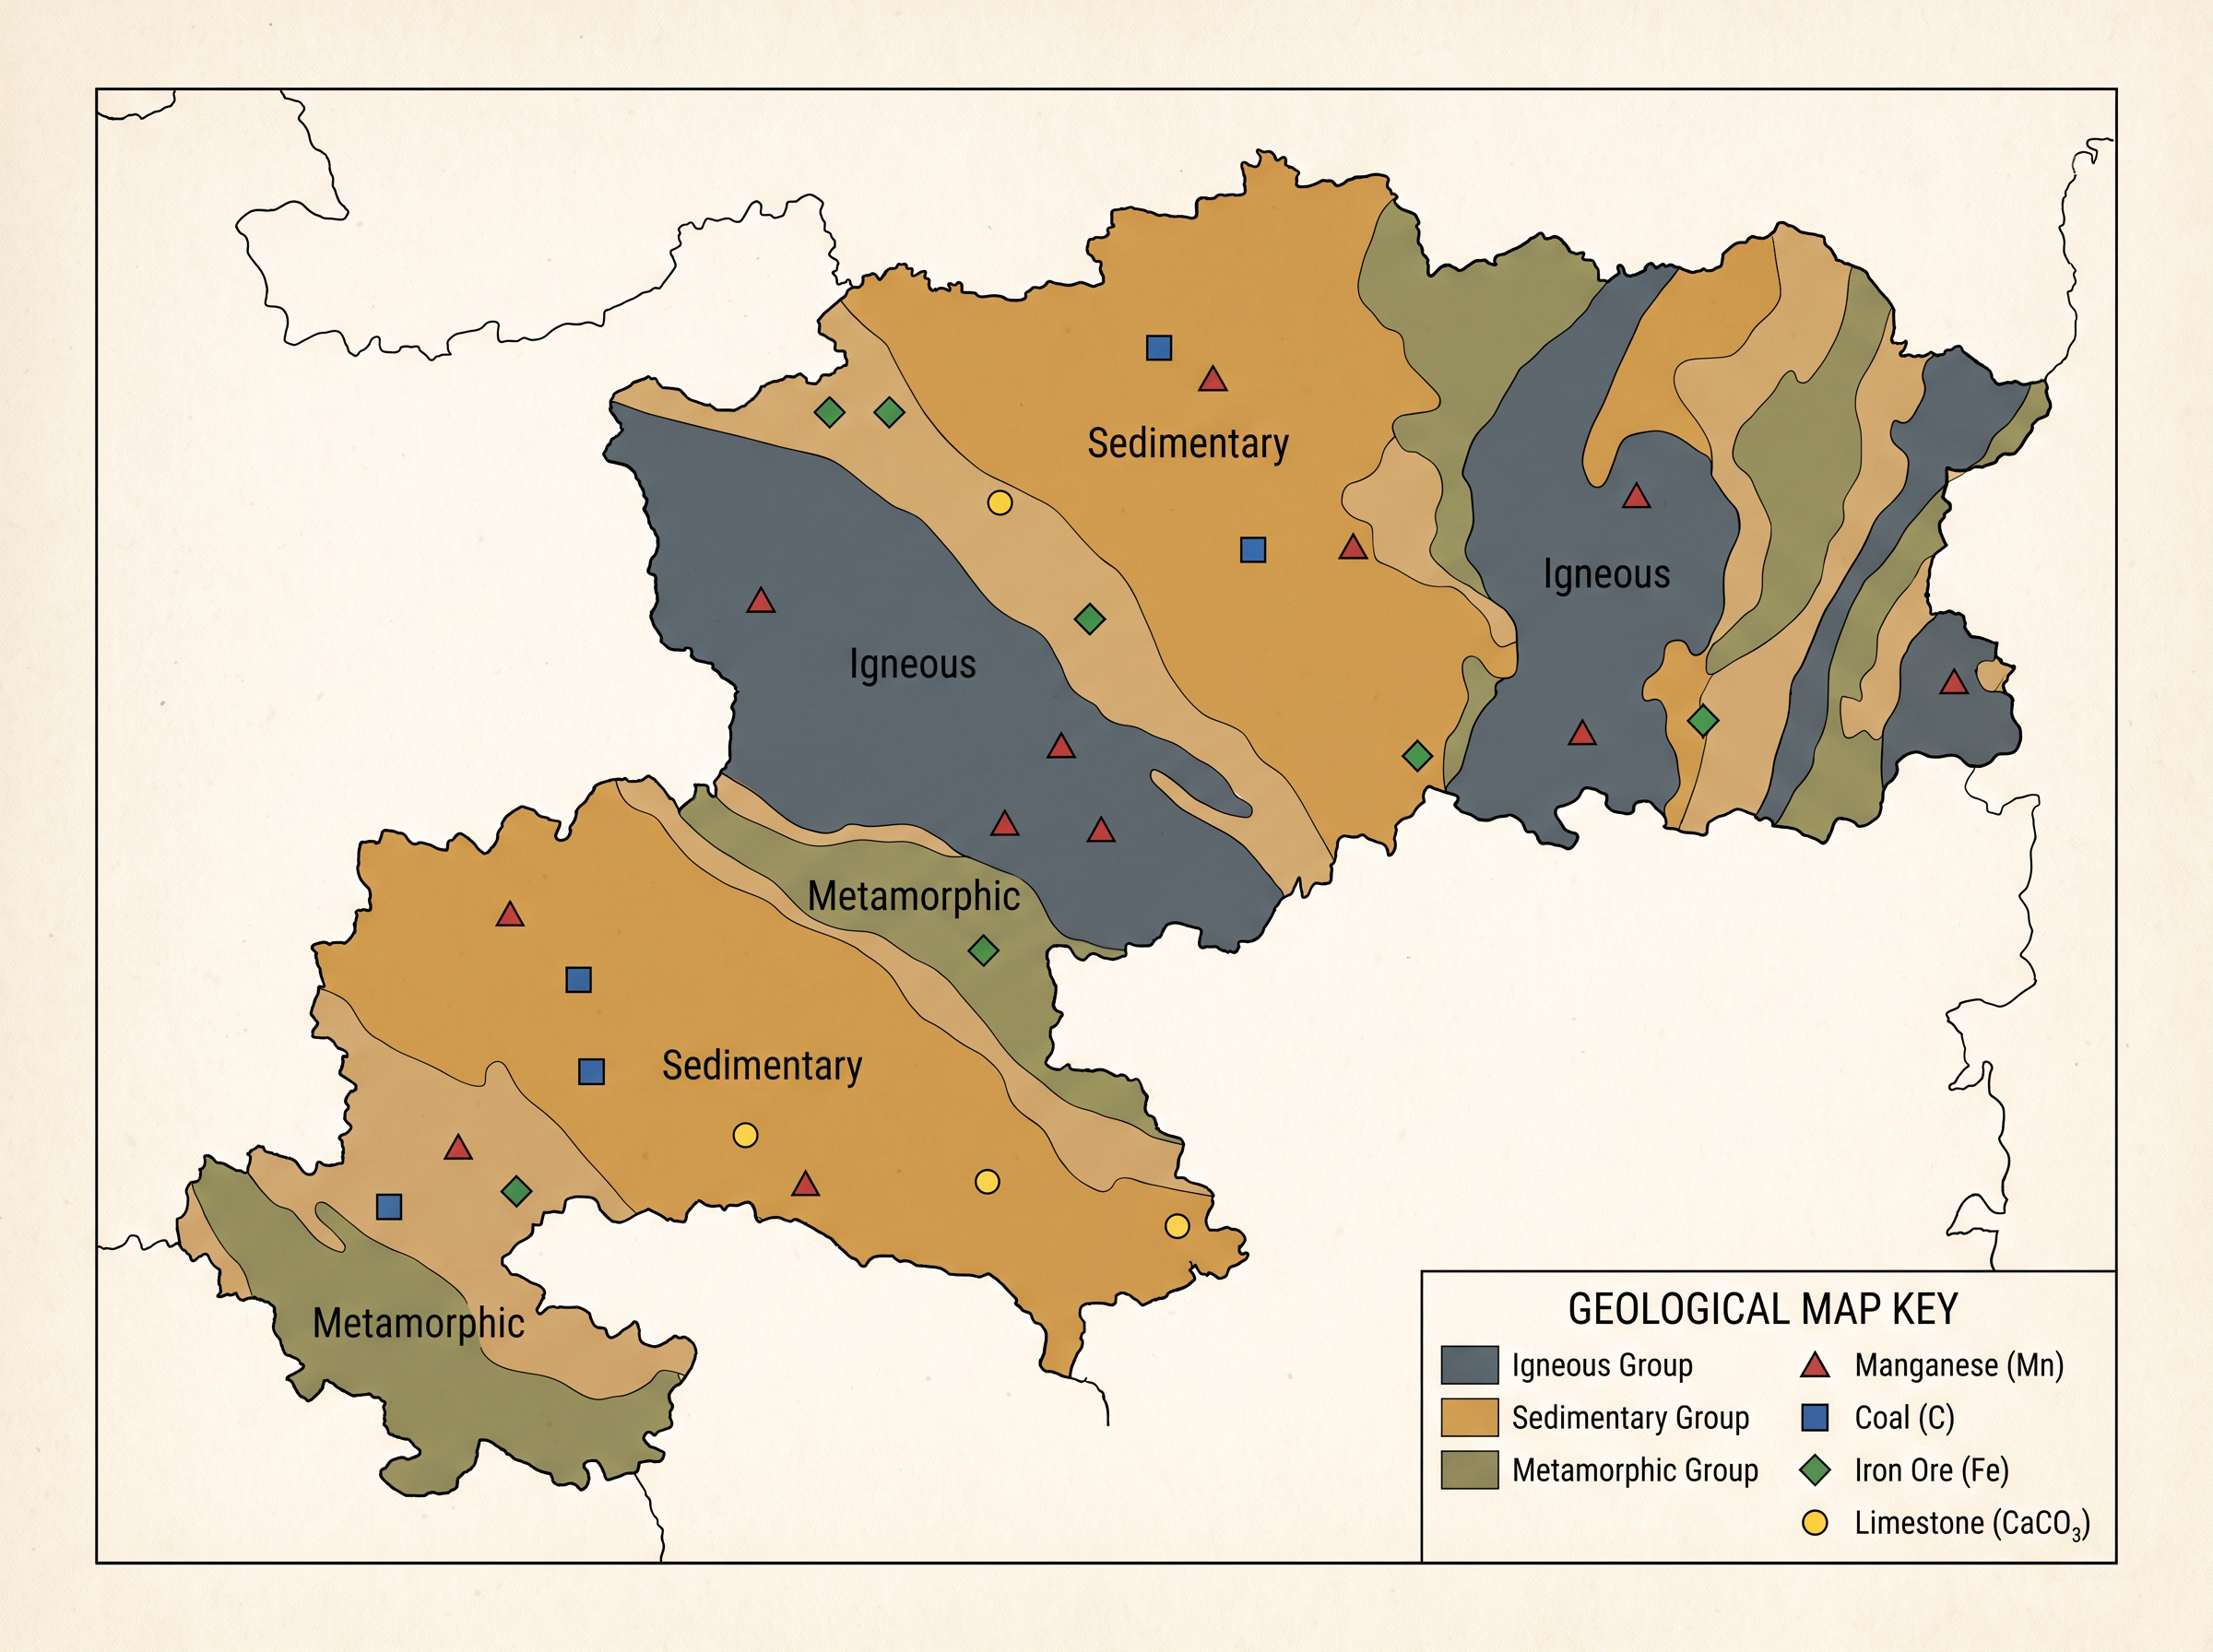
Fig. 1.9 – Distribution of rocks and minerals in Nagpur.
A climatic map shows climatic regions, and maps of this family also show the spread of single weather elements — temperature, rainfall, cloudiness, humidity, and the direction and speed of winds. Figure 1.10 shows the climatic conditions of Nagpur district.
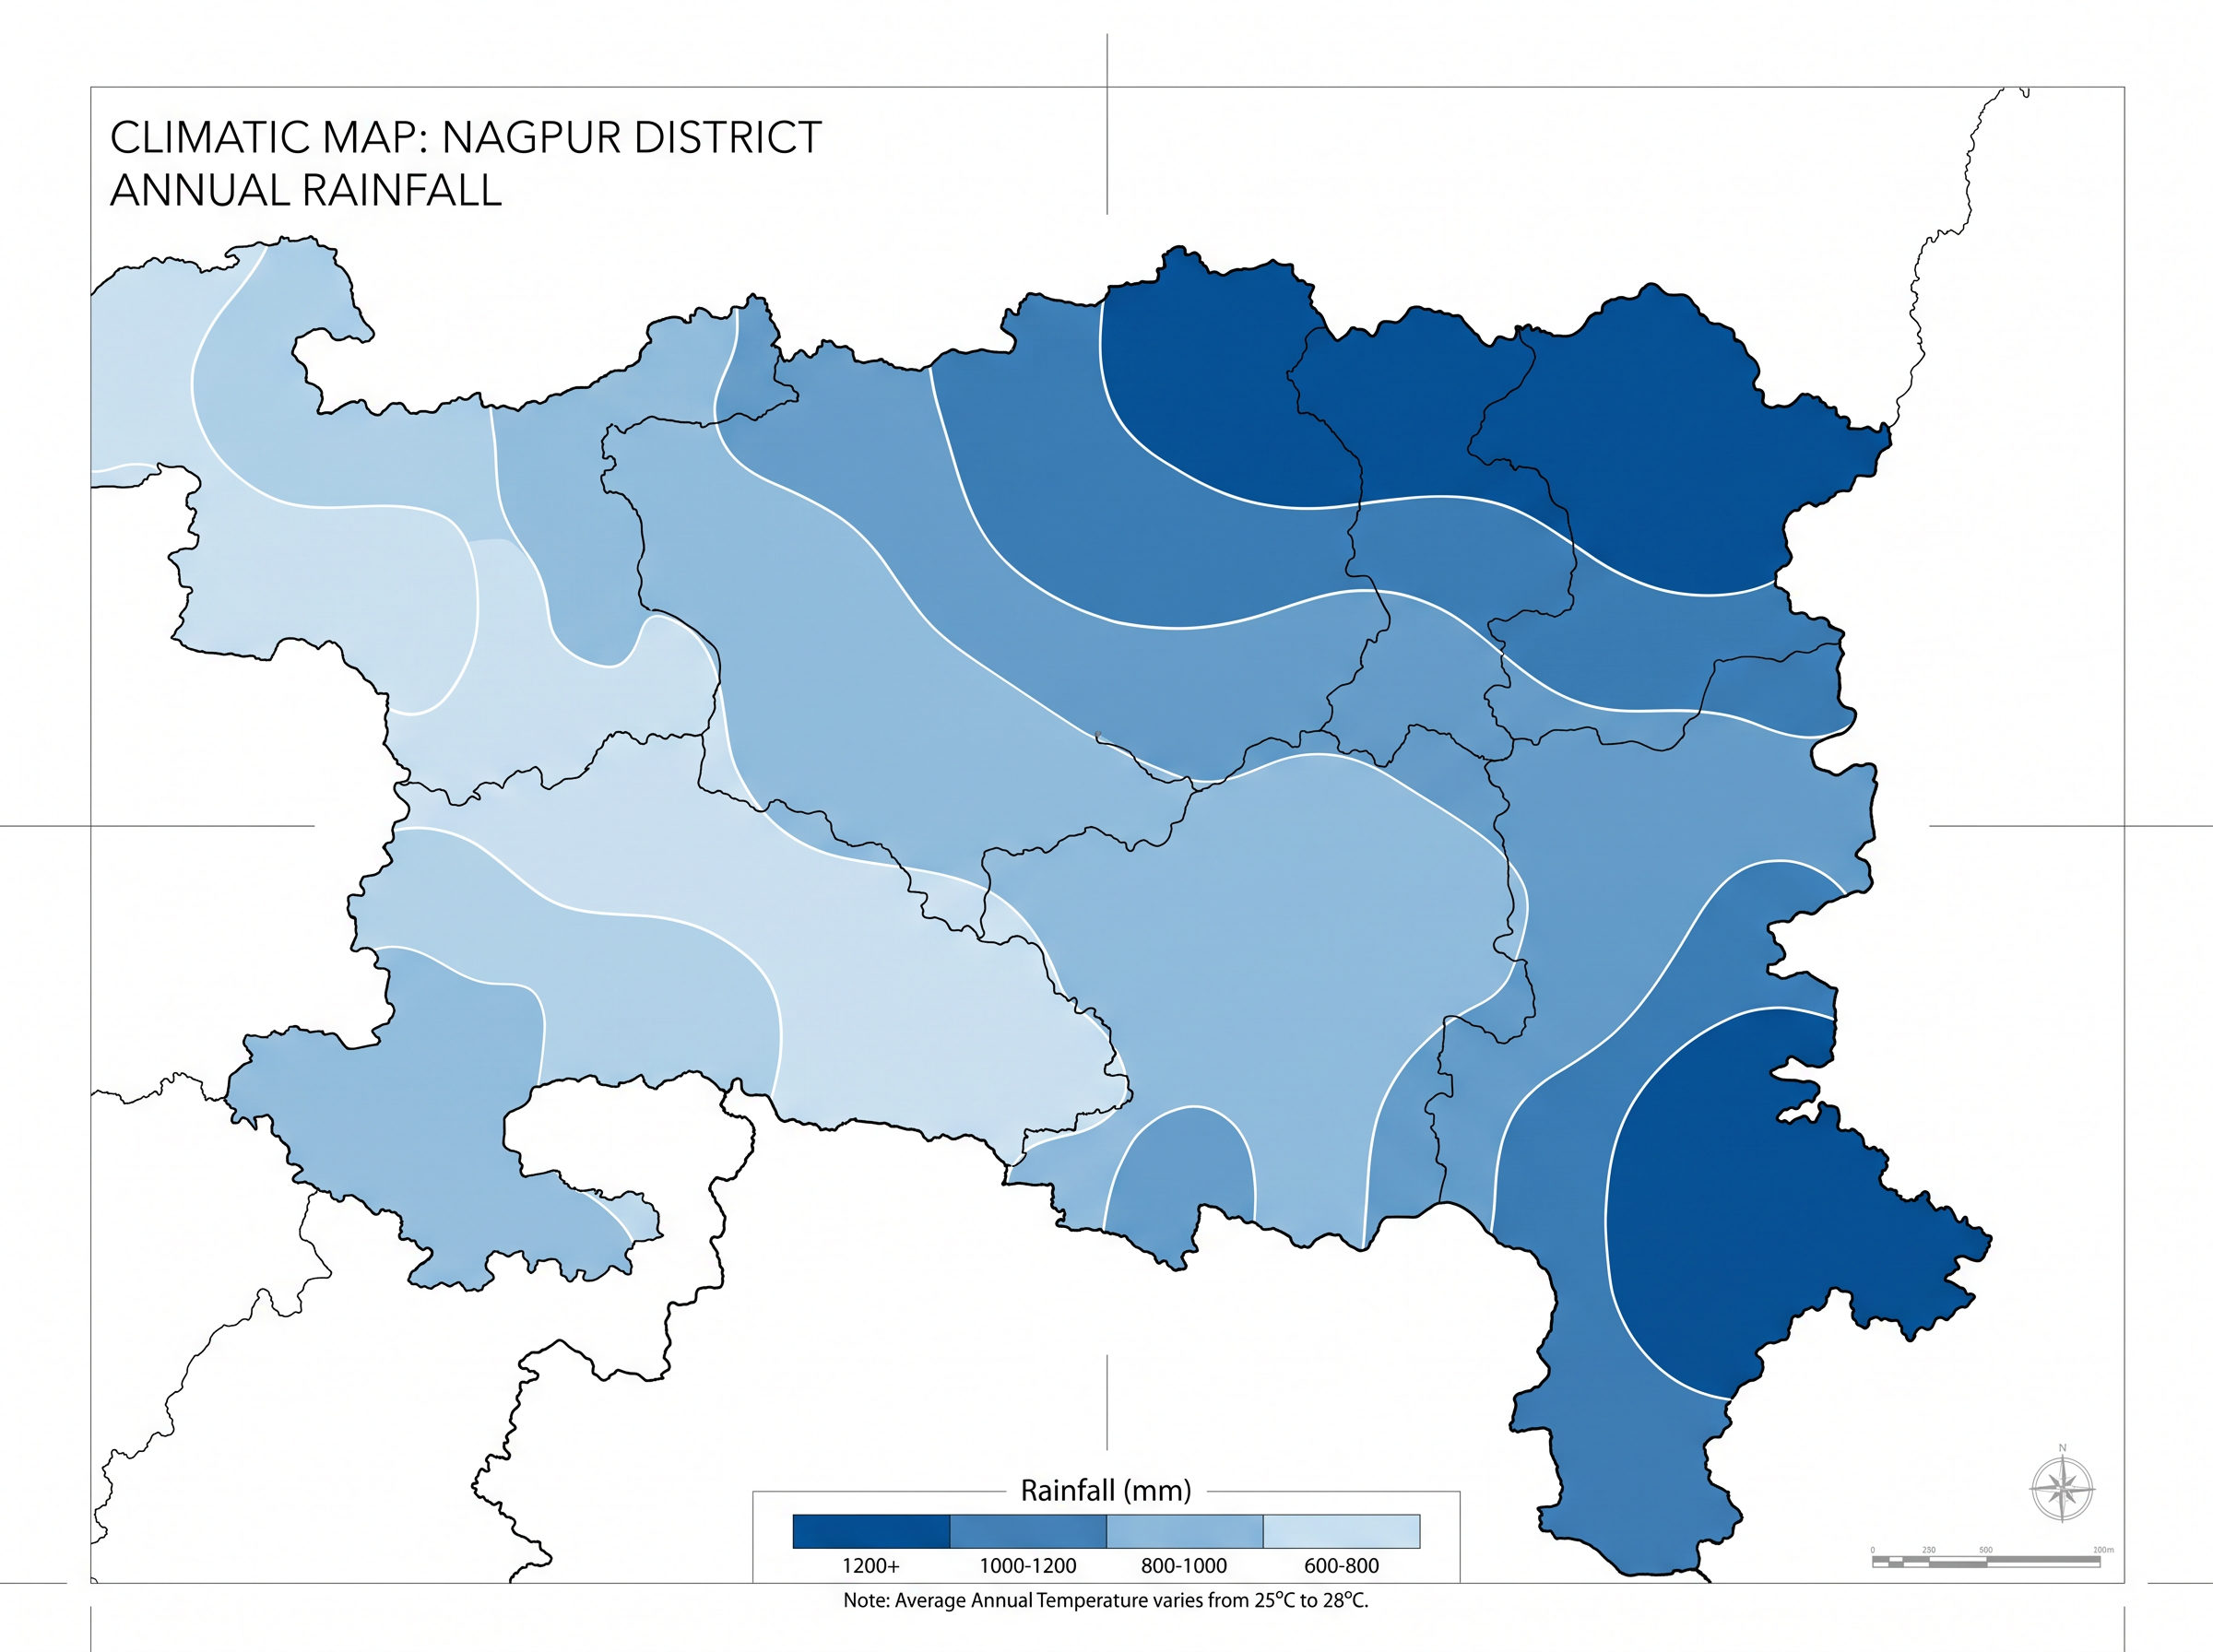
Fig. 1.10 – Climatic conditions of Nagpur.
A soil map shows the distribution of different soils and their properties. Figure 1.11 maps the soils of Nagpur district.
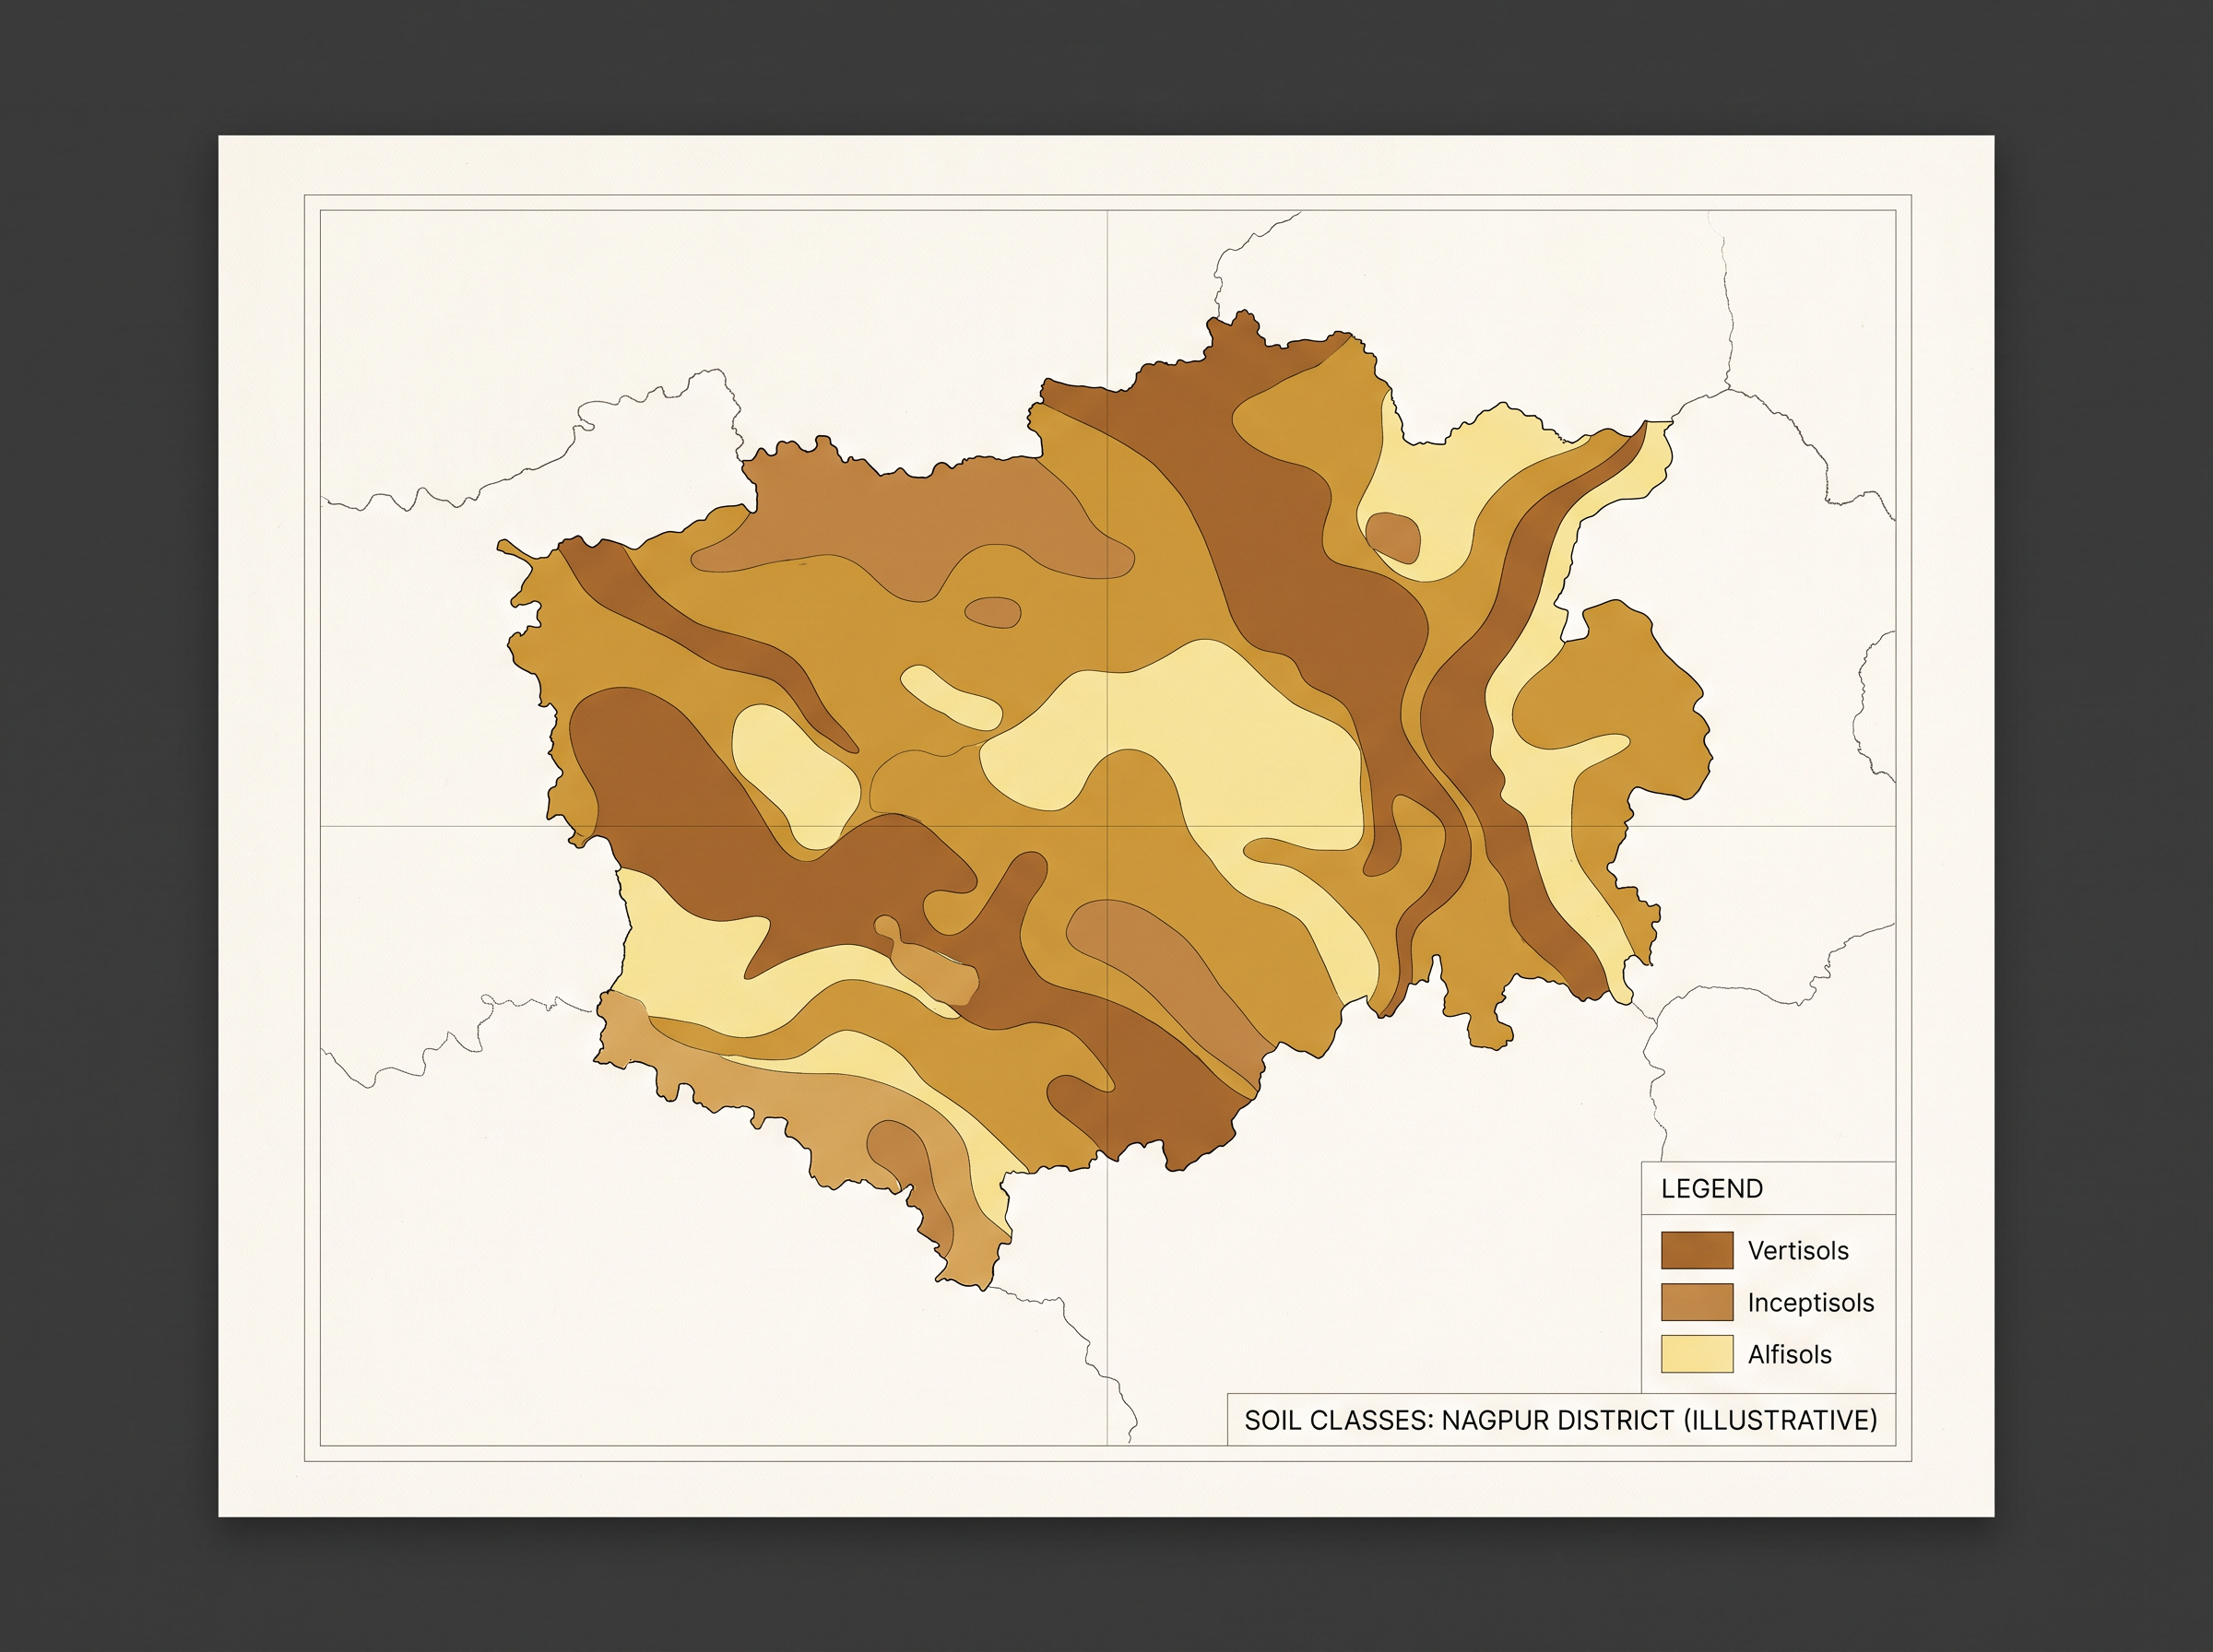
Fig. 1.11 – Soils of Nagpur.
Cultural Maps
Cultural maps show human-made features. They include maps of population distribution and growth, sex and age, social and religious make-up, literacy and education, occupations, the location of settlements and services, transport lines, and the production and flow of goods.
A political map shows the administrative divisions of an area — a country, a state or a district — and helps the administration plan and manage the unit concerned.
A population map shows how population is distributed, how dense it is and how it is growing, along with age and sex composition and the spread of religious, linguistic and social groups. Figure 1.12 shows the distribution of population in Nagpur district. Population maps are among the most important tools in planning the development of an area.
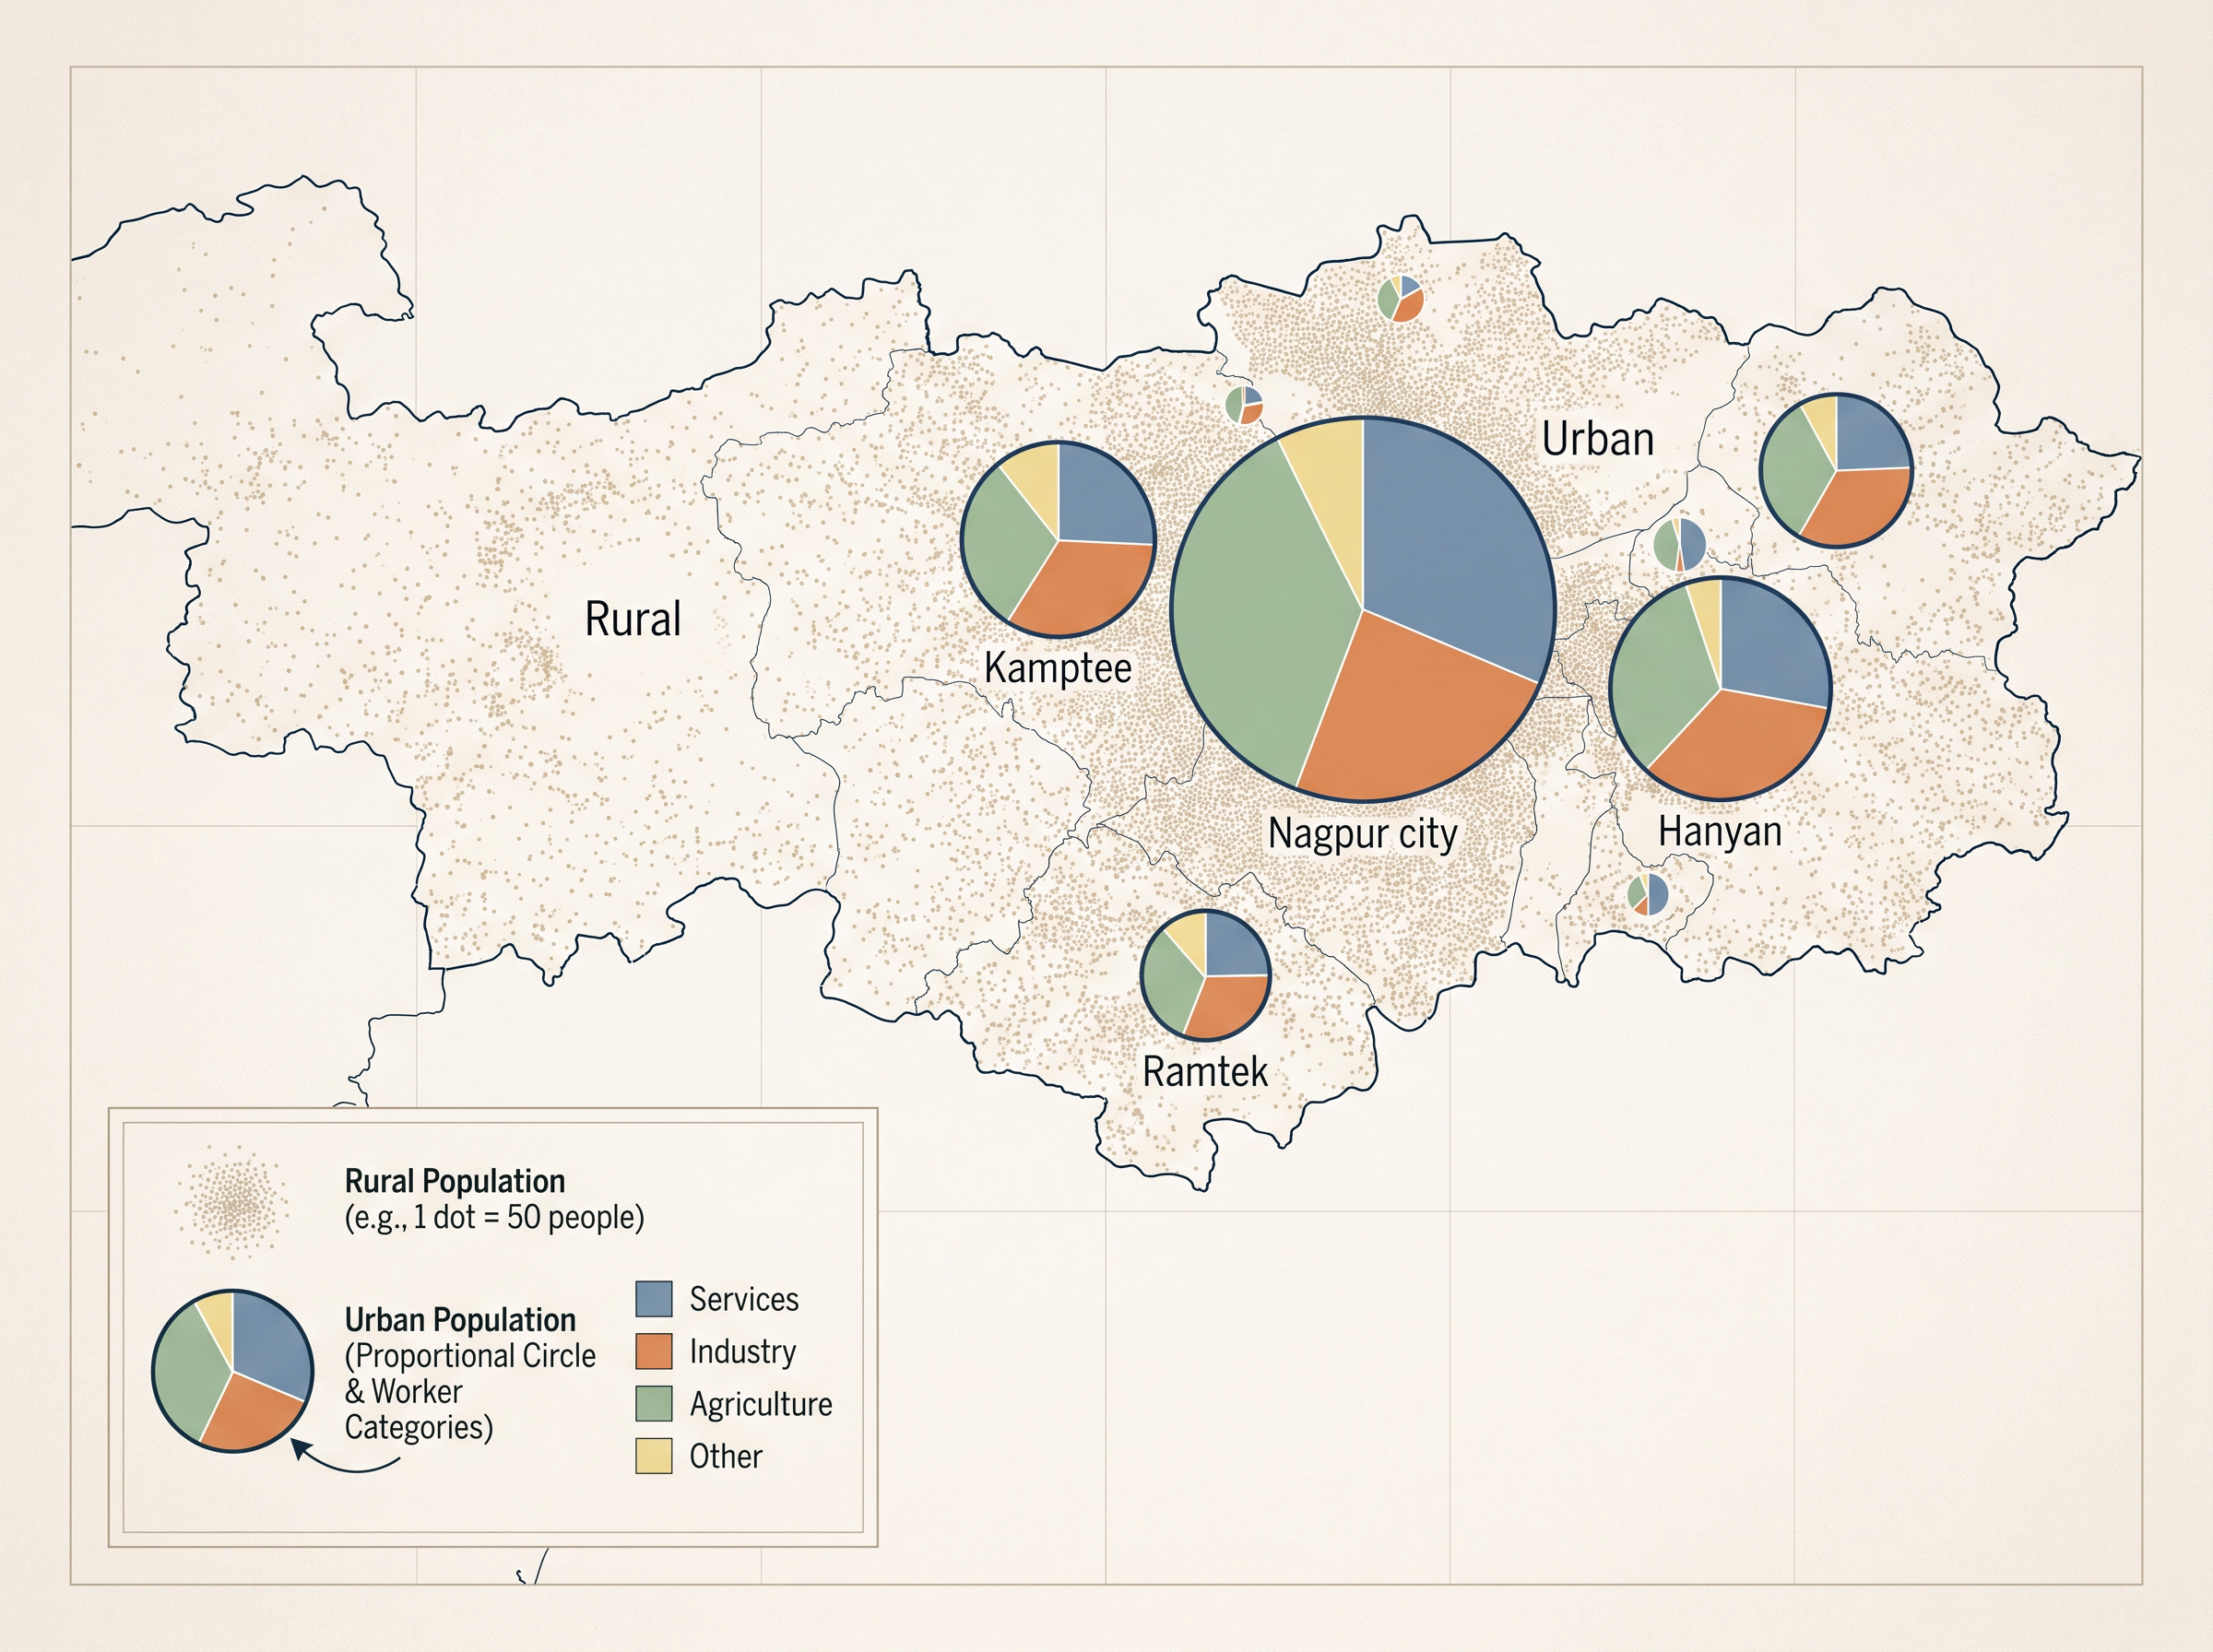
Fig. 1.12 – Distribution of population in Nagpur.
An economic map shows the production and distribution of crops and minerals, the location of industries and markets, and the routes along which trade and goods flow. Figures 1.13 and 1.14 show, in turn, the land use and cropping pattern and the location of industries in Nagpur district.
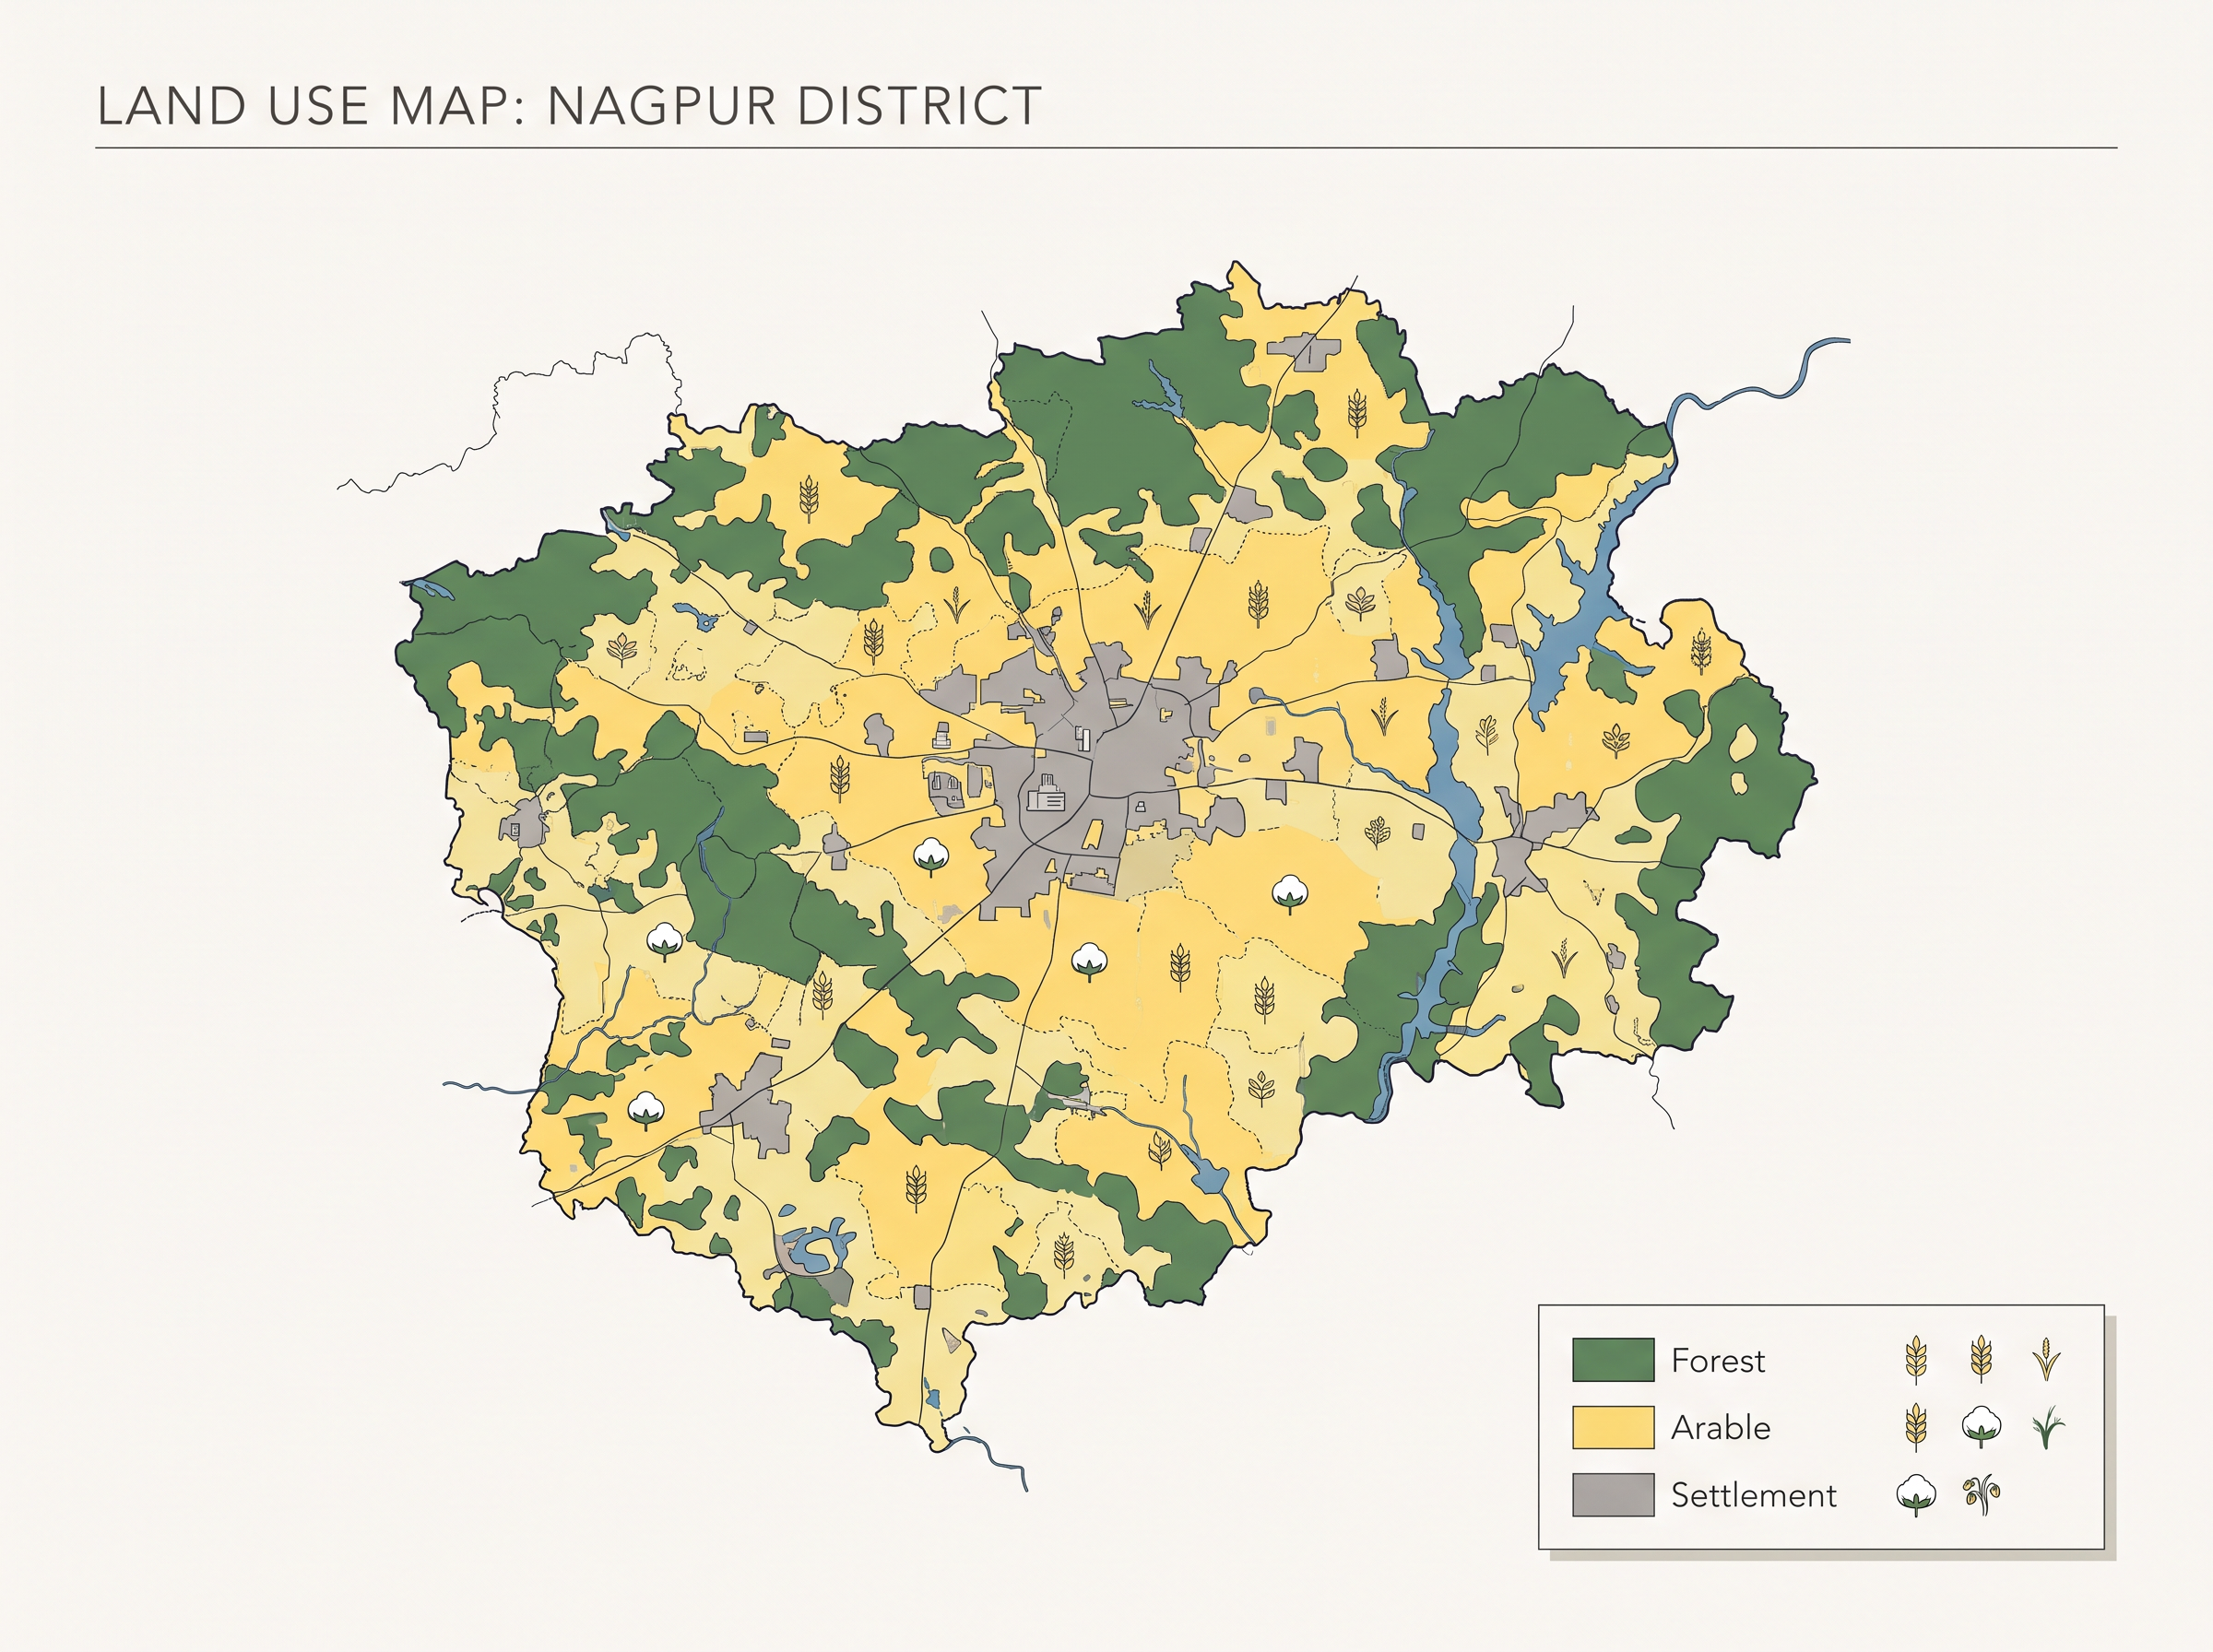
Fig. 1.13 – Land use and cropping patterns in Nagpur.
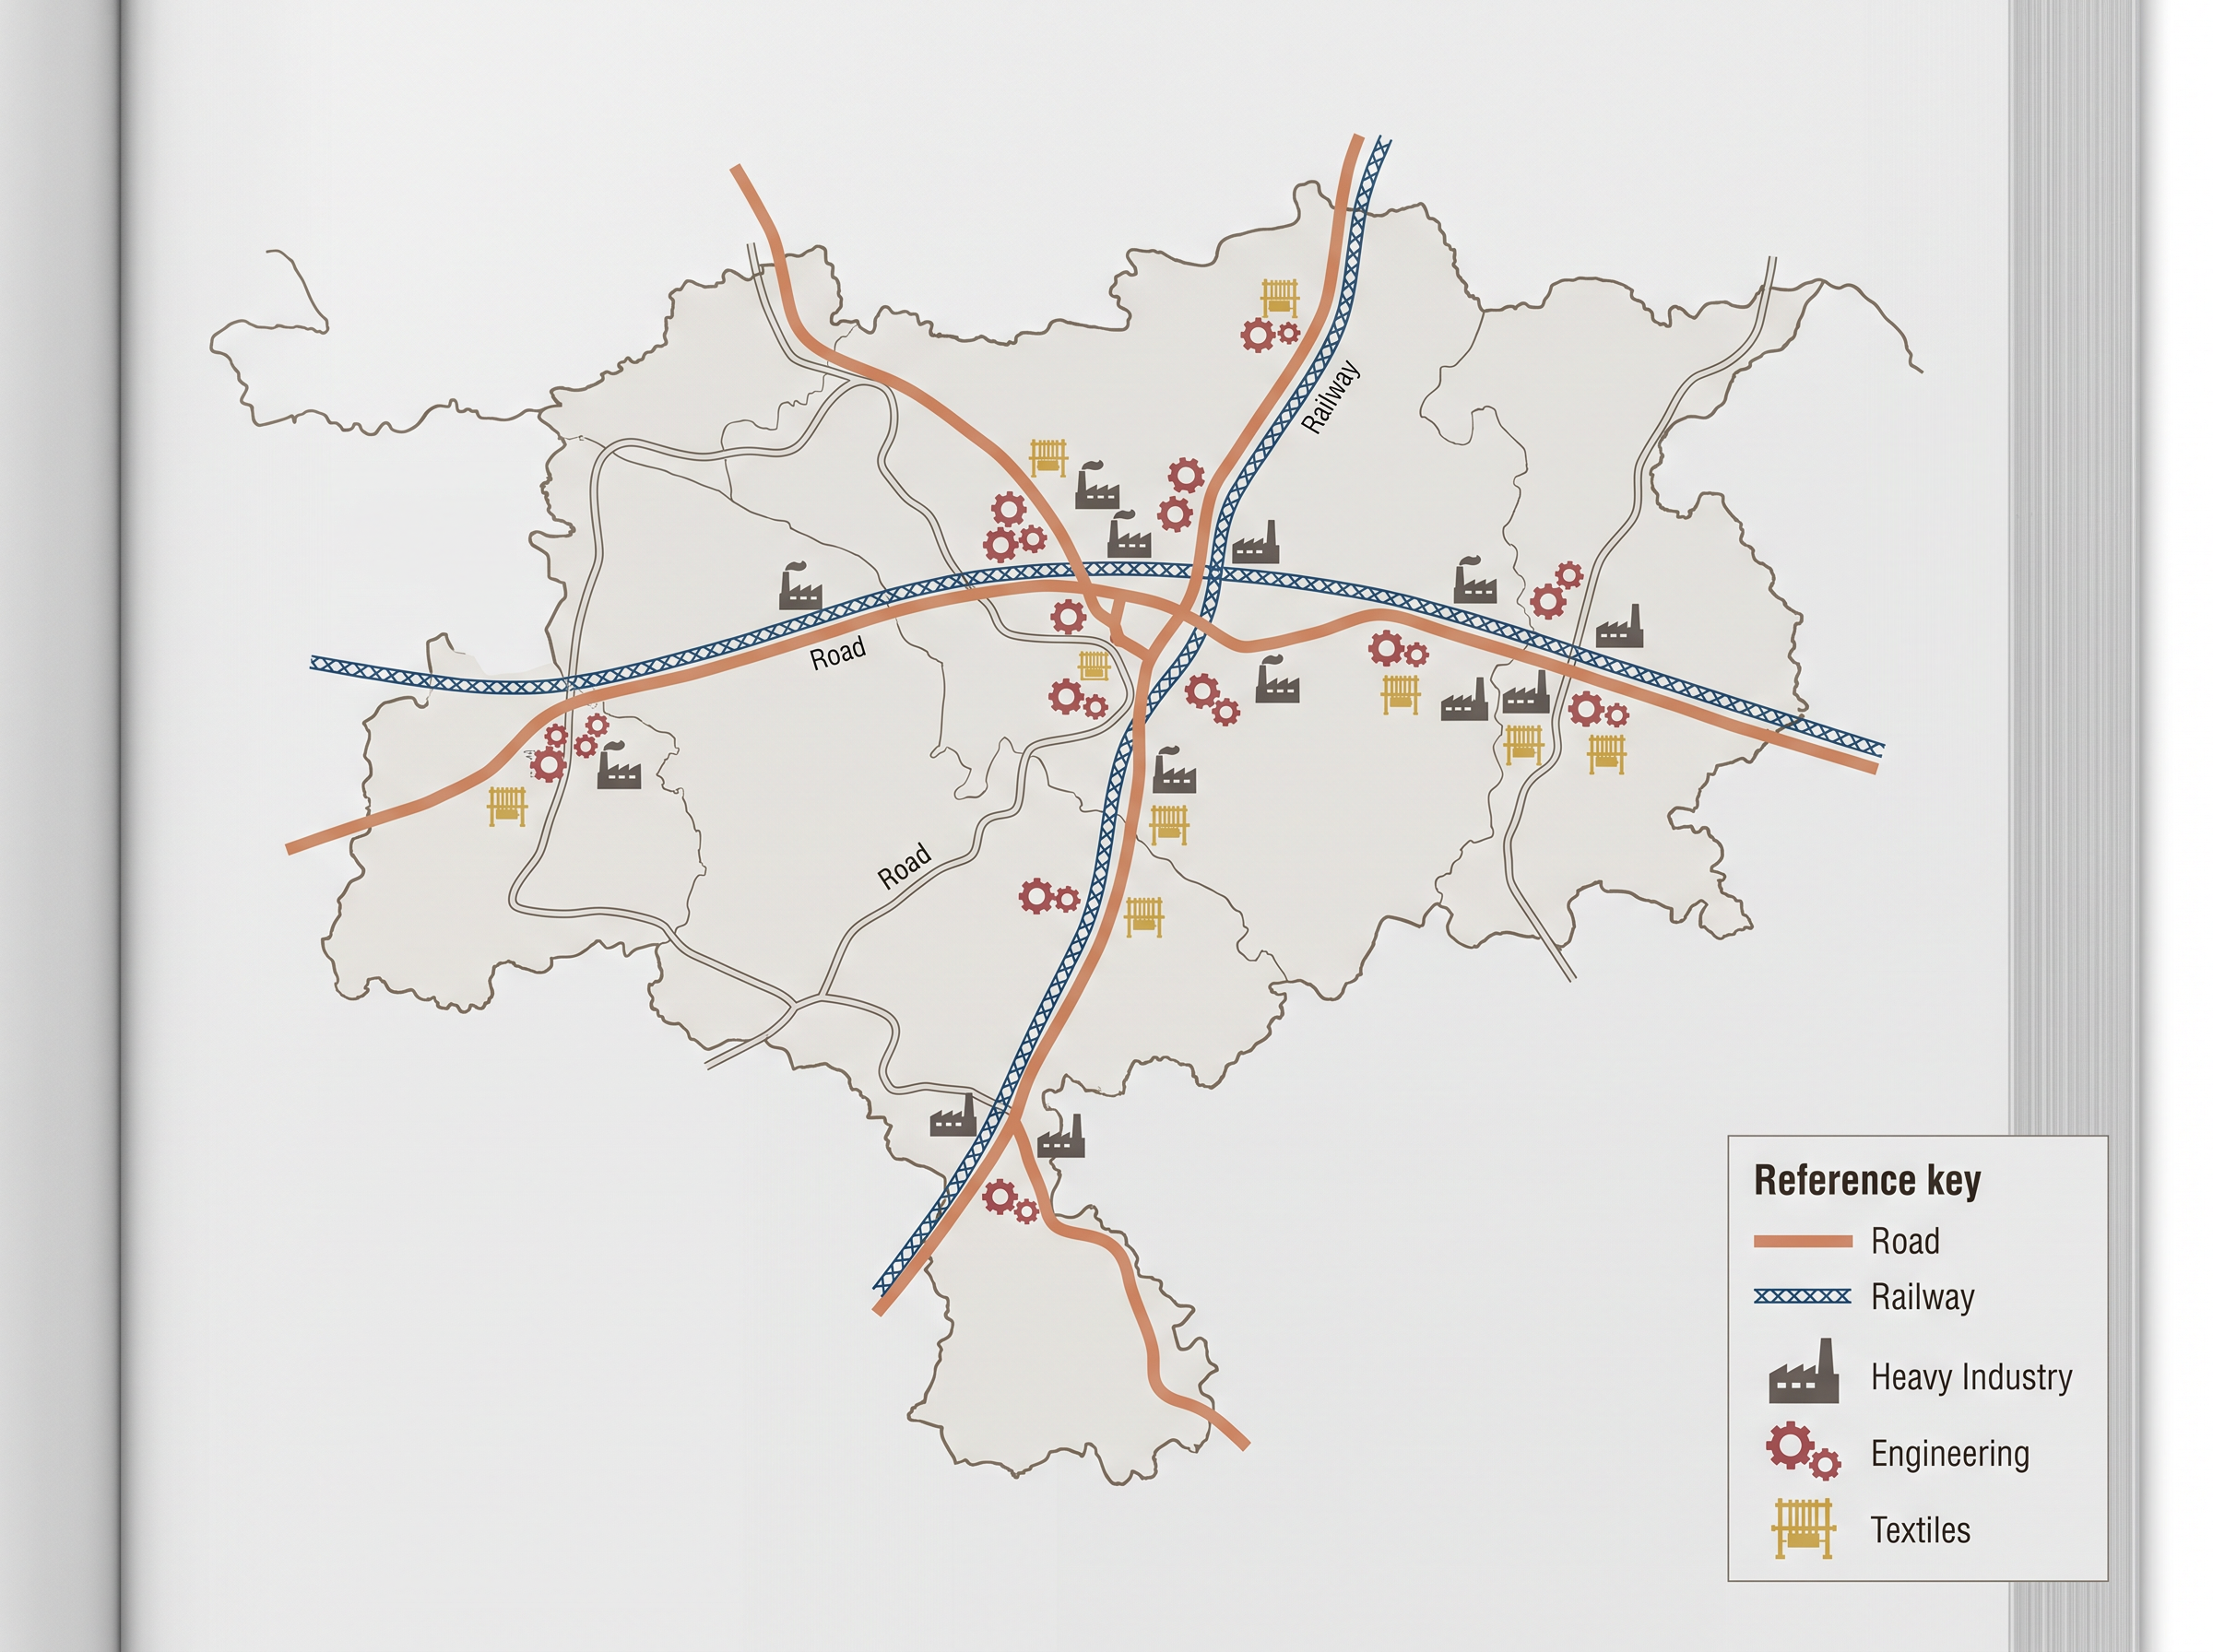
Fig. 1.14 – Location of industries in Nagpur.
Finally, a transportation map shows roads, railway lines, and the location of railway stations and airports.
1.4 Uses Of Maps
Maps are the working tools of geographers, planners and other resource scientists. Much of that work comes down to measurement: reading off a map how far apart two places are, in which direction one lies from another, and how large an area covers. This section takes the three measurements in turn — distance, direction and area.
1.4.1 Measurement Of Distance
The lines drawn on a map come in two kinds, and each is measured differently. Straight-line features — roads, railway lines and canals — are the simple case. You measure them directly, either with a pair of dividers stepped along the line or with a scale laid on the map surface.
The harder case is the erratic or zigzag line — a coastline, a river or a stream, which never runs straight for long. Here a straight scale is useless, because it would cut across every bend and undercount the true length. The way round it is a thread. You lay the thread along the feature from the starting point, following every curve to the end point, then lift it, pull it straight, and measure it against the scale. The same job can be done with a simple instrument called a rotameter, a small wheel that is run along the route and counts off the distance as it turns.
1.4.2 Measurement Of Direction
A direction is an imaginary straight line on the map giving the angular position of one point relative to a common base direction. That base is north: the line pointing north is taken as the zero direction, and every map shows it. All other directions are read against it, which is what lets a map-user fix where features lie in relation to one another.
The four best-known directions — North, South, East and West — are the cardinal points. Between them lie the intermediate directions, which name the in-between angles: north-east, south-east, south-west and north-west, and finer divisions still, such as NNE or ESE (Fig. 1.15).
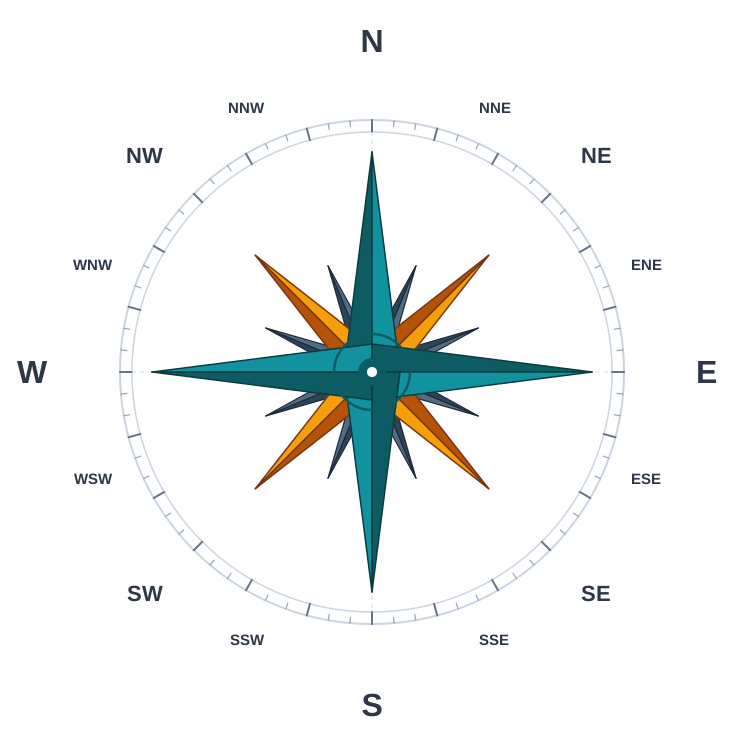
Fig. 1.15 – Cardinal and intermediate directions.
1.4.3 Measurement Of Area
Map-users also measure the area of features such as administrative and geographic units, straight off the map surface. Several methods exist. The simplest — though not the most accurate — is the method of squares.
In this method you cover the area with a grid of squares, either by laying graph paper under the map on an illuminated tracing table, or by tracing the area onto squared paper. You then count the squares. Squares lying wholly inside the area are the whole squares; squares the boundary cuts across are the partial squares, and each partial square is taken as one half. The count is turned into an area by a simple equation.
\[\text{Area} = \text{Sum of whole squares} + \left(\frac{\text{Sum of partial squares}}{2}\right) \times \text{Map scale}\]
Here the sum of whole squares is the number of squares fully inside the boundary, the sum of partial squares is the number the boundary crosses (each counted as a half), and the map scale converts that total square-count into a real ground area — in square kilometres, for instance, once the scale of the map is applied.
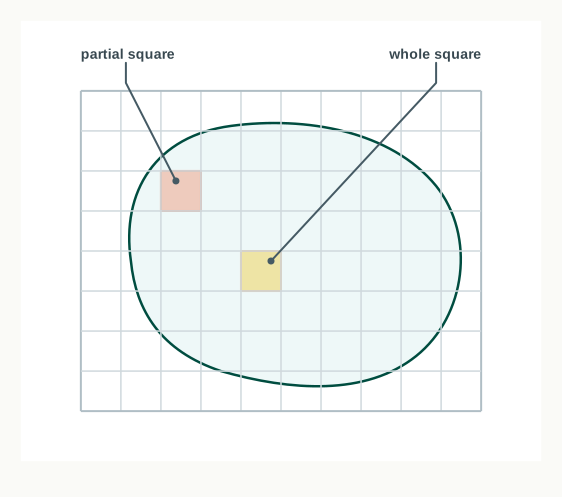
Fig. 1.16 – Measuring irregular area by squares.
Area can also be found with a fixed-area polar planimeter, a mechanical instrument that reads off an area as its arm is traced around the boundary.
You may explore more at bhuvan.nrsc.gov.in.
1.5 Summary
- A map is a selective, symbolised and generalised representation of the earth, or a part of it, drawn on a flat surface at a reduced scale. Without a scale, a network of lines and polygons is only a sketch.
- The earth’s true shape is a geoid, and a globe shows it most faithfully. A map trades the globe’s all-round accuracy for the convenience of flat paper.
- Map making rests on five essentials: scale, projection, generalisation, map design, and map construction and production.
- Scale is the first decision and sets the limit on how much detail a map can carry. Projection transforms the curved earth onto a plane and unavoidably distorts directions, distances, areas or shapes.
- Generalisation selects and simplifies the contents for the map’s purpose. Design plans its symbols, colours, lettering and legend. Construction and production draw and reproduce it, now largely by computer.
- Map making is ancient — from a Mesopotamian clay tablet of 2,500 B.C. and the Greek and Arab foundations of cartography, to India’s Vedic ‘sidhantas’, the seven ‘dwipas’, and revenue mapping under Todarmal and Sher Shah Suri. The Survey of India, set up in 1767, maps the whole country today.
- By scale, maps are large-scale (a small area in fine detail: cadastral and topographical) or small-scale (a large area in coarse detail: wall and atlas).
- By function, maps are physical (relief, geological, climatic and soil) or cultural (political, population, economic and transportation).
- Maps are used to measure distance (dividers or a scale for straight lines; a thread or rotameter for erratic lines), direction (angular position read against north, through the cardinal and intermediate points), and area (the method of squares, or a polar planimeter).
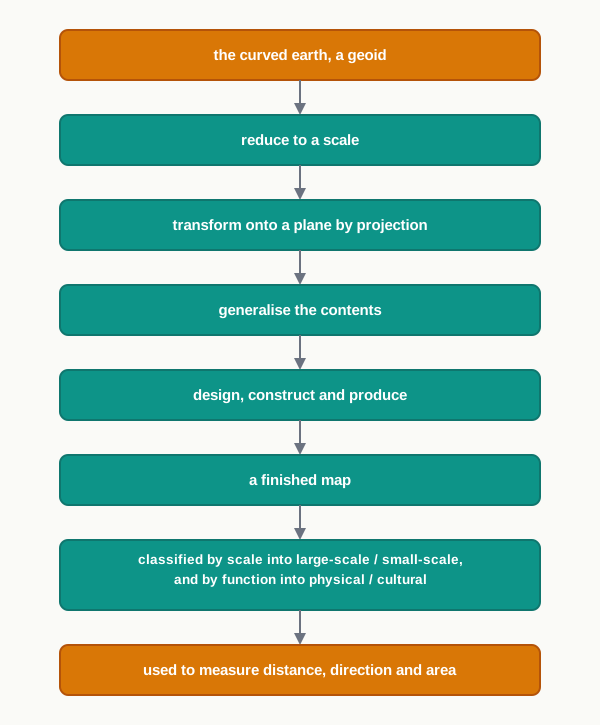
Fig. 1.17 – The map making process and classification.
What This Chapter Cannot Tell You
Every map is selective and generalised by design, so no single map shows the whole truth of a place — what it leaves out is a choice, not an oversight. No flat map is correct in all respects at once: a projection can keep directions, distances, areas or shapes true only by letting others go wrong. And measurement taken off a map carries error — the method of squares, as the chapter itself notes, is simple but not very accurate, and a small-scale map can never reveal the detail its scale has already discarded.
1.6 NCERT Questions
Which one of the following is essential for the network of lines and polygons to be called a map?
- Map Legend
- Symbols
- North Direction
- Map Scale
A map bearing a scale of 1 : 4000 and larger is called:
- Cadastral map
- Topographical map
- Wall map
- Atlas map
Which one of the following is NOT an essential element of maps?
- Map Projection
- Map Generalisation
- Map Design
- History of Maps
What is map generalisation?
Why is map design important?
What are different types of small-scale maps?
List out two major types of large-scale maps?
How is a map different from a sketch?
Write an explanatory account of types of maps.
1.7 Check Your Concepts
List the five essentials of map making in the order a cartographer works through them.
Why is north taken as the base direction on a map, and what does knowing it allow a map-user to do?
Why can a straight scale not measure the true length of a winding river, and what method is used instead?
Figure 1.4 shows the Delhi region drawn at several scales. As the scale grows larger, what happens to the area shown and to the amount of detail, and why?
In Figure 1.12, what does one dot on the map represent, and why can this map not tell you how crowded the land is per square kilometre?
How does a large-scale map differ from a small-scale map in the area it covers and the detail it shows? Give one example of each.
Why does transferring the curved earth onto flat paper always distort some of the directions, distances, areas or shapes?
The method of squares is described as simple but not very accurate. Explain how partial squares are counted in this method, and give one reason it can be inaccurate.