Chapter 2: Map Scale
A student in a geography class is handed a printed map sheet and told to trace a route to a village twelve kilometres away. In the corner sits a single line: ‘1 cm represents 0.5 km’. She measures with a ruler, multiplies, and marks the spot. Then the class is asked to enlarge the same sheet on a photocopier so the small print becomes readable. The machine blows it up to one and a half times its size.
Now the trouble begins. The village she marked has drifted. Every road is longer on the enlarged copy, every river wider — yet that printed line still reads ‘1 cm represents 0.5 km’. The words did not stretch with the paper. The scale is now lying to her.
One thing on the sheet did not lie. Beside the written statement sat a small ruled bar, divided into equal parts and labelled in kilometres. It grew by exactly as much as the map did, so its divisions still matched the ground. Read against that bar, the distances came out right.
That small bar is the heart of this chapter. Scale is the fixed relationship between a distance on the map and the real distance it stands for on the ground — and there is more than one way to state it. This chapter asks which ways survive a photocopier, which do not, and why a scale written as a plain fraction can be read by anyone in the world.
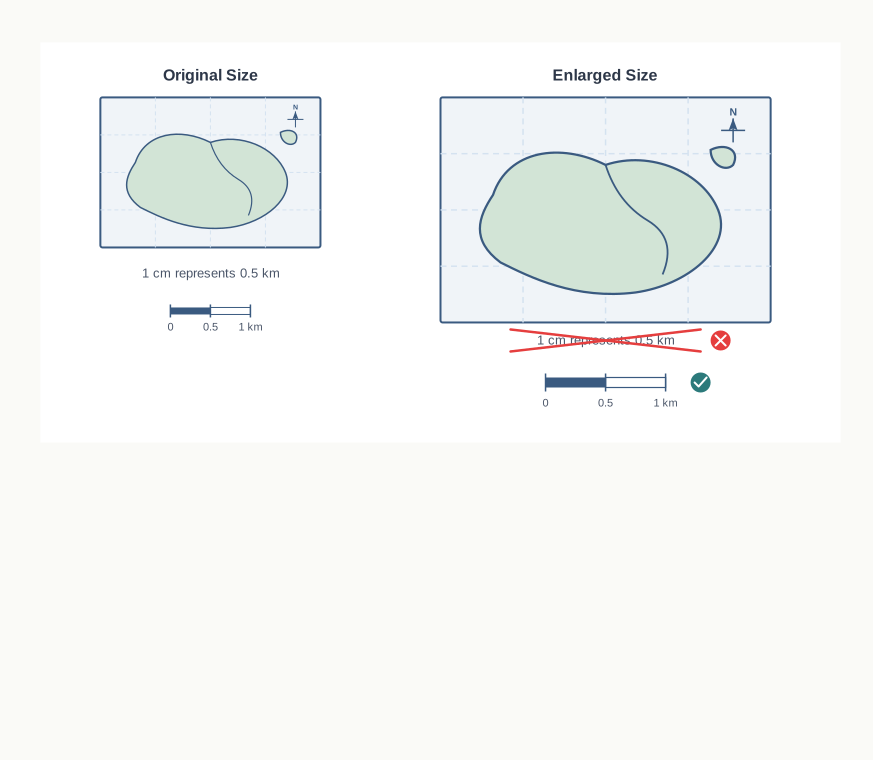
Fig. 2.0 – Map enlargement and the bar scale.
2.1 What Is Scale?
Every map is a shrinking of the real world. A country that is a thousand kilometres across has to fit onto a page you can hold, and the mapmaker manages this by reducing every real distance by the same fixed amount. That fixed amount is the map’s scale — the settled relationship between a distance measured on the map and the actual distance it stands for on the ground.
Scale is not one detail among many; it is what makes a map a map. A network of lines and polygons that carries no scale is only a sketch — it may show what lies next to what, but it cannot tell you how far apart anything really is. Without a scale you cannot measure a single distance with confidence. So the questions worth asking are plain ones: why does scale matter, what exactly does it mean, and what are the different ways of showing it on a map?
The Relationship Behind Every Map
You have probably seen a small ruled bar in the margin of a map, divided into equal parts and labelled in kilometres or miles. Those divisions let you lift a distance straight off the map and read it back as a ground distance. Put plainly, a map scale states the relationship between the map and the whole, or the part, of the earth’s surface drawn on it.
There is a second, equally useful way to say the same thing. Take any two points on the map and measure the distance between them. Scale is the ratio of that map distance to the real distance between the same two points on the ground. Whether you picture it as a labelled bar or as a ratio between two measured distances, the relationship is one and the same.
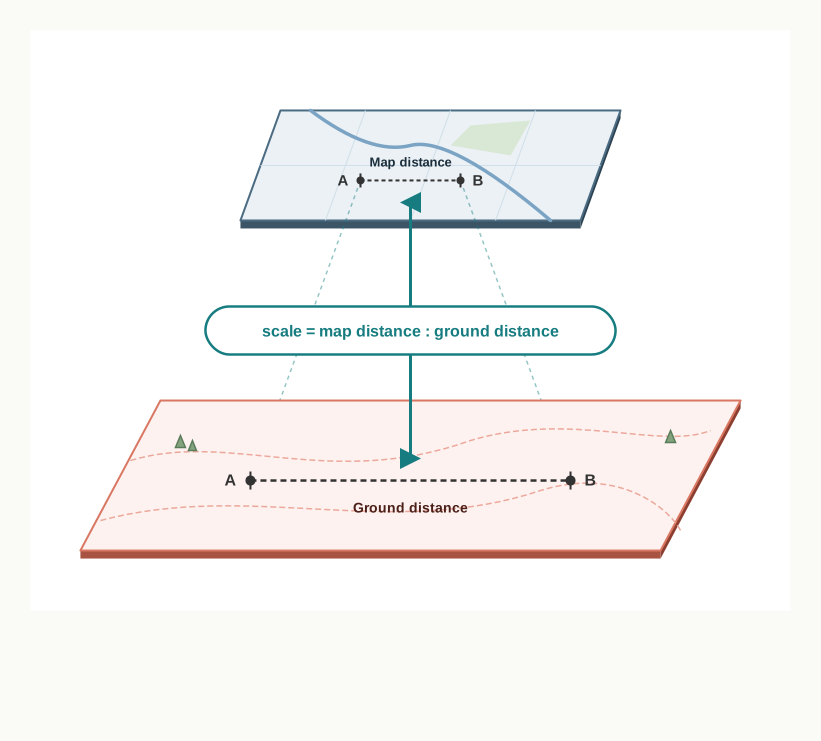
Fig. 2.1 – The ratio between map and ground distances.
Three Ways To State It
There are at least three ways to express this relationship, and the chapter takes up each in turn. The scale may be written out in words, as a statement of scale. It may be written as a fraction, called the representative fraction, or R. F. Or it may be drawn as a ruled bar, the graphical scale. Each of the three has its own advantages and its own limitations, examined one by one in the next section. For now it is enough to hold on to a single idea: these are three ways of saying the very same thing.
Two Systems Of Measurement
Before the three methods can be compared, one more thing has to be settled — the units a scale is written in. To measure a linear distance, the straight-line distance between two points, you need a unit of length, and the world uses two different families of them.
The first is the Metric System of Measurement, built on the kilometre, metre, centimetre and millimetre. India uses it today, as do many other countries. The second is the English System of Measurement, built on the mile, furlong, yard, foot and inch. It is still in everyday use in the United States and the United Kingdom. India measured and showed distances in the English system too, until 1957, before shifting to the metric system.
The two systems do not mix easily. Someone who thinks in kilometres will not immediately grasp a scale written in miles and furlongs, and the reverse is just as true. This is why the units a scale is written in matter as much as the numbers themselves — and why one of the three methods, as you will see, escapes the problem entirely. The exact unit relationships within each system are set out alongside.
2.2 Methods Of Scale
A map’s scale can be shown by any one of the three methods, or by a combination of them on the same sheet. Each method states the same relationship between map and ground, but each carries its own strengths and its own weak points. This section takes them one at a time.
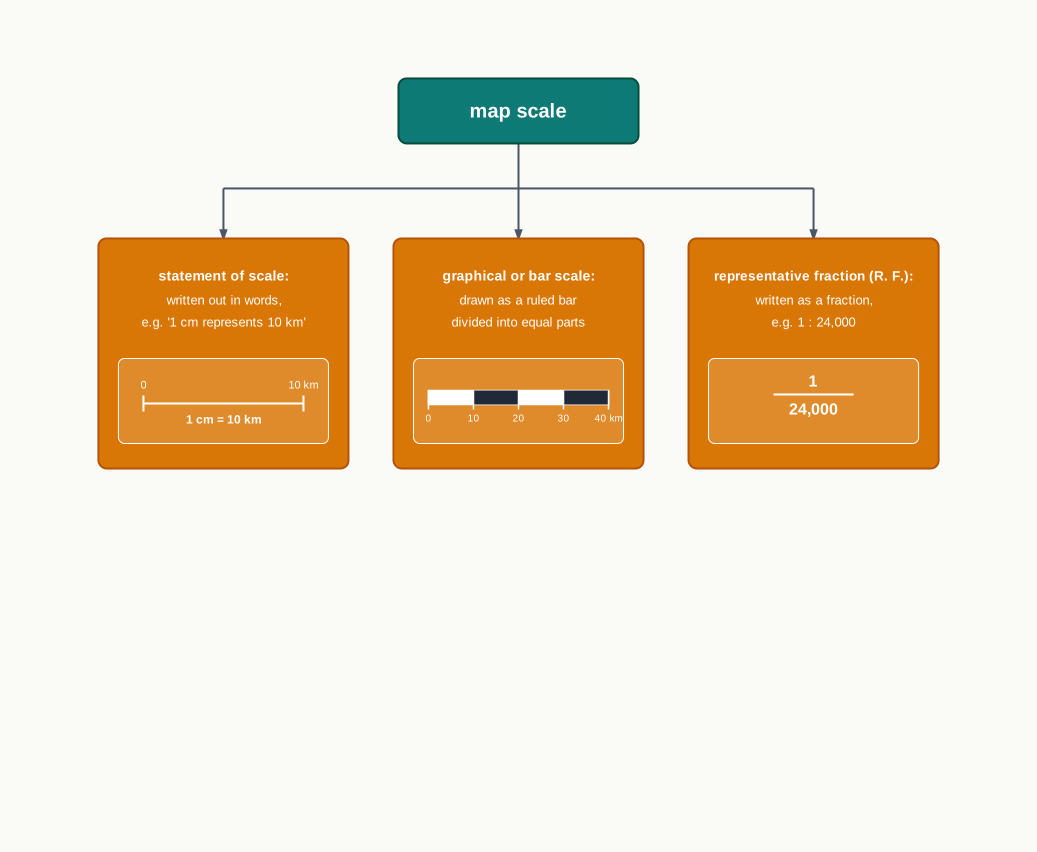
Fig. 2.2 – Three methods of stating map scale.
2.2.1 Statement Of Scale
The statement of scale gives the scale in words. A line such as ‘1 cm represents 10 km’ means that one centimetre measured on the map stands for ten kilometres on the ground. The same scale can be written in any system of measurement — for a reader who thinks in the English system, ‘1 inch represents 10 miles’ does the same job. This is the simplest of the three methods, and the easiest to grasp at a glance.
Its simplicity comes at a price, in two ways. First, a statement written in one system means little to a reader used to the other: someone who works in kilometres cannot use ‘1 inch represents 10 miles’ without first converting it. Second, and more serious, the statement is tied to the size of the map as printed. If the map is later reduced or enlarged — photocopied smaller, or blown up bigger — every distance on it changes, but the words do not. The old statement is now false, and a fresh scale has to be worked out from scratch.
2.2.2 Graphical Or Bar Scale
The graphical scale, also called the bar scale, shows map distances and their matching ground distances as a line bar (Fig. 2.3). The bar carries primary divisions — the main, whole-unit steps — and secondary divisions, the smaller sub-steps within one primary division that let you read fractions of a unit. To measure a distance, you set it against the bar and read the ground value straight off.
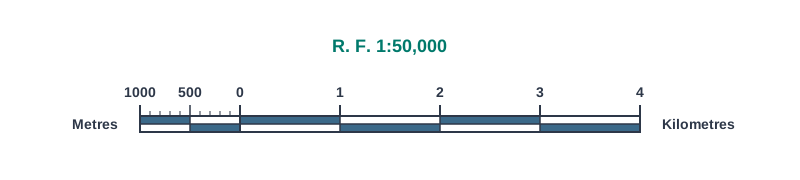
Fig. 2.3 – Bar scale for R. F. 1 : 50,000 in kilometres.
The bar in Fig. 2.3 reads in kilometres and metres; another bar, for the same map, could just as easily be drawn to read in miles and furlongs. So the graphical scale shares one weakness with the statement of scale: it is fully useful only to a reader who works in the units it is drawn in.
But it has one advantage the statement of scale cannot match. Because the bar is drawn on the map itself, it is reduced or enlarged along with the map. Shrink the sheet to half its size and the bar shrinks to half as well, so its divisions still line up with the ground. The graphical scale therefore stays valid however the map is resized — its single, defining strength.
2.2.3 Representative Fraction (R. F.)
The third method is the representative fraction, or R. F.. It states the relationship between map distance and ground distance in units of length, and it is the most versatile of the three because of how it uses those units.
The R. F. is written as a fraction, because a fraction shows exactly how much the real world has been shrunk to fit on the paper. Take an R. F. of 1 : 24,000. It says that one unit of length on the map represents 24,000 of the very same units on the ground. So one millimetre on the map stands for 24,000 millimetres of ground, one centimetre for 24,000 centimetres, and one inch for 24,000 inches. The fraction never names a unit; it works in whichever unit you choose, so long as both sides are measured in the same one.
Here lies the reason the R. F. is called a universal method. Because it fixes only a ratio and leaves the unit open, a reader in any system can pick it up and read it in their own units. By convention, the centimetre or the inch is the unit chosen when the fraction is turned back into a spoken scale.
To see this at work, take an R. F. of 1 : 36,000. A reader used to the metric system takes 1 unit as 1 cm, and 36,000 units as 36,000 cm on the ground. Dividing by 100 — the number of centimetres in a metre — gives 360 metres, so the scale reads ‘1 cm represents 360 metres’. A reader used to the English system instead takes the unit as an inch: 36,000 inches on the ground, divided by 36 — the number of inches in a yard — gives 1,000 yards, so the very same fraction reads ‘1 inch represents 1,000 yards’.
One fraction, two readers, two correct statements in two different systems — and neither reader had to be told which units the mapmaker had in mind. That is what ‘universal’ means here, and it is the quality that both the statement of scale and the bar scale lack.
2.3 Conversion Of Scale
Once you know what each method can and cannot do, moving between them is not hard. A statement of scale can be turned into a representative fraction, and an R. F. can be turned back into a statement. This section works both conversions, and then shows how to draw a bar scale from a scale you are given.
2.3.1 Statement Of Scale Into R. F.
A spoken scale names a unit; an R. F. does not. To convert one into the other, the trick is to get the same unit on both sides of the relationship, and then drop it.
The result is a fraction with no unit attached, and that is the whole point of the conversion. A spoken scale locked to inches and miles has become a bare ratio that a reader in any system can pick up. Turning a statement into an R. F. is the step that makes a map’s scale portable.
2.3.2 R. F. Into Statement Of Scale
Going the other way, we choose a convenient unit — a centimetre for the metric system — read the ratio in that unit, and then step up to a larger unit that is easier to say aloud.
Converting back fixes a unit by convention — the centimetre — and trades a little precision for a number a reader can hold in mind: one centimetre spans about two and a half kilometres of ground. Notice what is gained and lost. The spoken scale is easy to read, but it is now tied to the metric system, while the R. F. it came from could be read by anyone.
2.3.3 Construction Of The Graphical/Bar Scale
Converting a scale is one thing; drawing a bar you can actually lay a ruler against is another. By convention a graphical scale is drawn to a handy length — about 15 cm when working in the metric system, about 6 inches when working in the English system. The problem is that the round drawing length rarely stands for a round ground distance, so most of the work is choosing a sensible round distance and finding the exact line length that shows it.
The finished bar is shown in Fig. 2.4. The awkward 7.5 km is exactly why the bar is redrawn to a round 5 km — a reader should not have to measure against a scale that ends on a fraction. The two sides of the bar do different jobs: the right reads whole kilometres for long distances, and the finely cut left division reads down to 100 m for short ones, so a single bar serves both coarse and fine measurement.
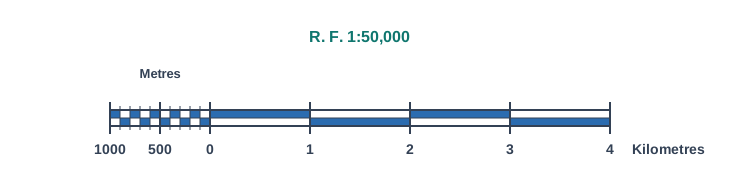
Fig. 2.4 – Completed 5 km bar scale for R. F. 1 : 50,000.
The completed scale is shown in Fig. 2.5. This case came out cleanly because 6 inches happened to stand for a round 6 miles, so the redrawing step of the previous case was not needed. The left division does the fine work: by cutting the last mile into furlongs, it lets a reader measure distances shorter than a whole mile.

Fig. 2.5 – Bar scale reading miles and furlongs.
The method is drawn in Fig. 2.6. This is the same ‘make it round’ problem as the kilometre case, but the English units force an untidy 6.34-inch line, so the round-number trick alone is not enough. The slanted-guide-line construction is a general way to cut any length into equal parts using only a ruler and a set square — a small piece of geometry that rescues the measurement.
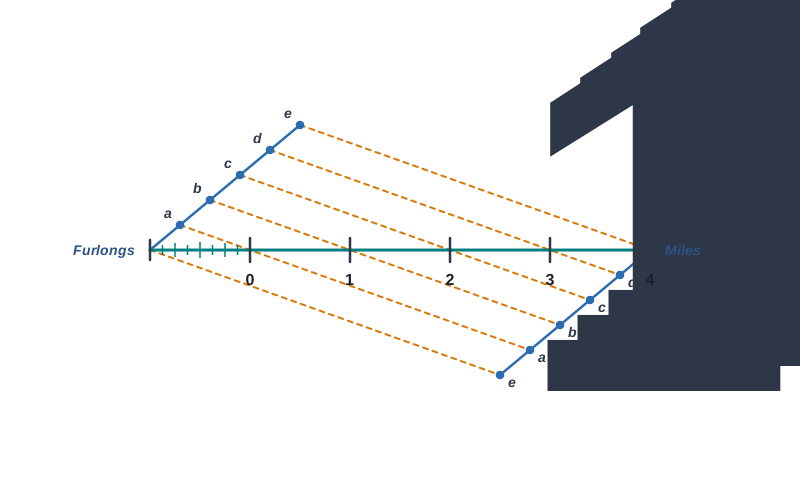
Fig. 2.6 – Geometric construction for equal divisions.
2.4 Summary
- Scale is the fixed relationship between a distance measured on the map and the real distance it stands for on the ground. A network of lines and polygons with no scale is only a sketch.
- The relationship can be read either from a labelled bar or as a ratio of the map distance to the ground distance between the same two points.
- Distances are measured in one of two systems. The metric system uses the kilometre, metre, centimetre and millimetre and is used in India today; the English system uses the mile, furlong, yard, foot and inch and is still used in the United States and the United Kingdom. India used the English system until 1957.
- Scale can be shown in three ways: the statement of scale, the graphical or bar scale, and the representative fraction.
- The statement of scale gives the scale in words. It is the simplest method, but it is tied to one measurement system and becomes false if the map is reduced or enlarged.
- The graphical or bar scale shows distances on a divided line bar. It is also unit-bound, but its defining advantage is that it stays valid when the map is resized, because the bar is redrawn along with the map.
- The representative fraction, or R. F., states the scale as a unit-free fraction. Because it fixes only a ratio, a reader in any system can read it in their own units, which is why it is the universal method.
- A statement of scale is converted into an R. F. by writing both sides in the same unit and then dropping the unit. An R. F. is converted into a statement by choosing a convenient unit and converting the ground figure into a larger one such as the kilometre.
- A bar scale is built by finding the line length that stands for a convenient round distance, then dividing it into readable primary and secondary divisions. Where the length is awkward, it is divided into equal parts by a geometric construction rather than by the ruler alone.
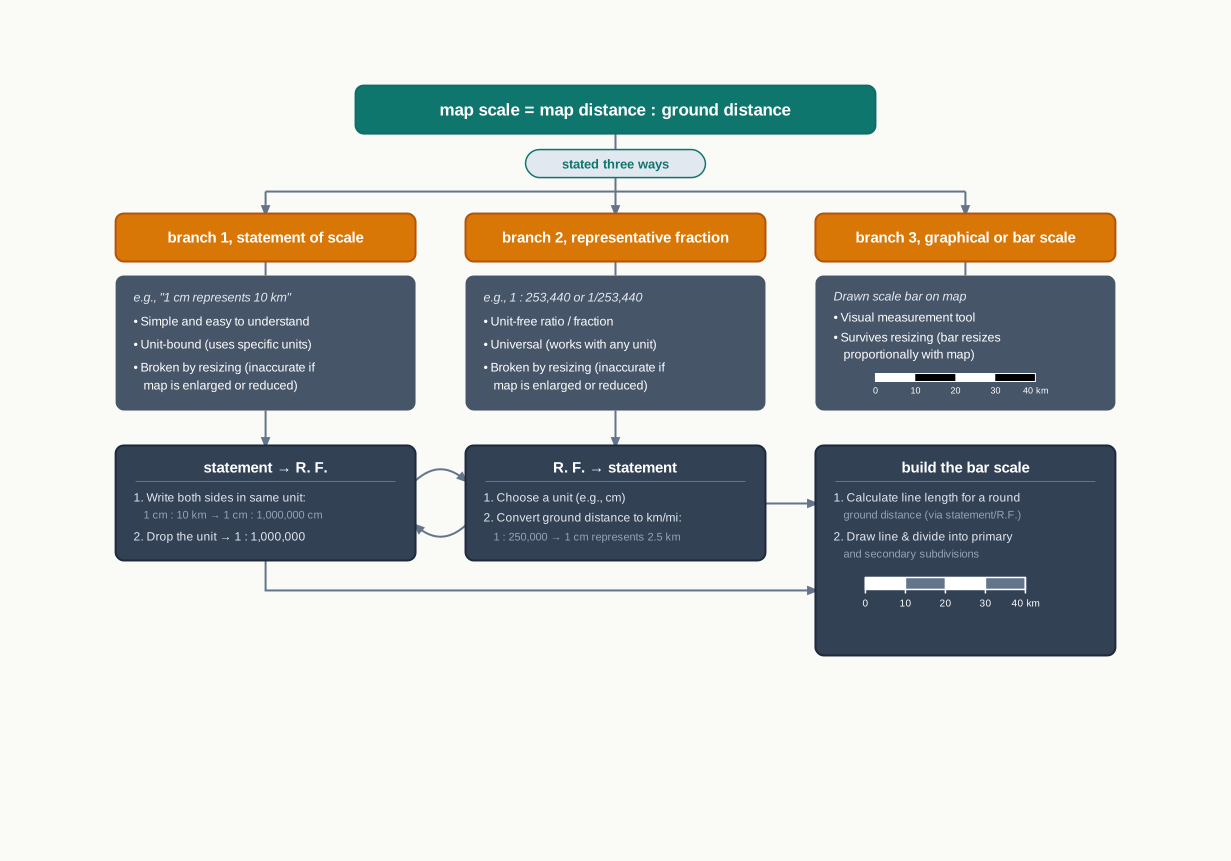
Fig. 2.7 – The three methods of scale and their conversions.
What This Chapter Cannot Tell You
- Scale fixes distance, and only distance. It says nothing about direction, about the true length of a bending road, or, straight off, about area.
- A spoken scale is rounded for reading: ‘1 cm represents 2.53 km’ hides the exact 2.5344 km it came from. The fraction is the precise figure; the statement is a convenience.
- The chapter shows how to state and convert a scale, not how to choose one. How far to shrink the world depends on a map’s purpose, a question it leaves open.
2.5 NCERT Questions
Which one of the following methods of scale is a universal method?
- Simple Statement
- Representative Fraction
- Graphical Scale
- None of the above
Map distance in a scale is also known as:
- Numerator
- Denominator
- Statement of Scale
- Representative Fraction
‘Numerator’ in scale represents:
- Ground distance
- Map distance
- Both the distances
- None of the above
What are the two different systems of measurement?
Give one example each of statement of scale in Metric and English system.
Why is the Representative Fraction method called a Universal method?
What are the major advantages of the graphical method?
Convert the given Statement of Scale into Representative Fraction (R. F.):
- 5 cm represents 10 km
- 2 inches represents 4 miles
- 1 inch represents 1 yard
- 1 cm represents 100 metres
Convert the given Representative Fraction (R. F.) into Statement of Scale in the system of measurement shown in parentheses:
- 1 : 100,000 (into km)
- 1 : 31680 (into furlongs)
- 1 : 126,720 (into miles)
- 1 : 50,000 (into metres)
Construct a graphical scale when the given R. F. is 1 : 50,000 and read the distances in kilometre and metre.
2.6 Check Your Concepts
Look at Fig. 2.4. The bar reads whole kilometres to the right of the 0 mark but is finely subdivided to the left of it. What kind of distance is that finely divided left-hand part meant to measure?
In Fig. 2.5, the divisions to the right of the 0 mark are read in miles, while the single division to the left is read in furlongs. Why is the left-hand division marked in furlongs rather than in miles?
A written statement of scale has to be re-worked whenever the map it belongs to is reduced or enlarged. Explain why the statement stops being true, using what happens to the distances on the map.
The chapter describes three methods of showing scale. Which one of them can be read correctly by a person working in any system of measurement, and which one alone stays valid when the map is enlarged or reduced? Give the reason in each case.
While converting the R. F. 1 : 253,440, the chapter reaches ‘1 cm represents 2.5344 km’ and then rounds it to ‘1 cm represents 2.53 km’. How much ground distance, per centimetre of the map, is dropped by this rounding, and why does it usually not matter on a map?
To build a bar of 6.34 inches divided into 5 equal parts, the chapter uses the geometric construction shown in Fig. 2.6 instead of measuring the parts with a ruler. Why is the ruler not a reliable way to make these five divisions?