Chapter 5: Topographical Maps
Spread a topographical sheet across a table and, at first, it looks like a tangle. Brown lines loop and crowd and swirl; blue threads wander across it; tiny black symbols crowd the margins. There is not a single hill drawn on it, not one mountain, not a valley you can point to. And yet a trained reader can look at that flat paper and say, without ever visiting the place, where the land climbs steeply and where it lies almost level, where a river has cut a deep gorge, where the ground drops away in a cliff.
The Survey of India, the country’s national mapping organisation, has been turning the three-dimensional land into flat sheets like this for well over a century. Earlier its surveyors climbed and levelled the ground by hand; today aerial photographs do much of that work. But the code they use has barely changed. Every loop of brown, every gap between two lines, every place where two lines merge carries a precise message about the shape of the ground.
Learn that code and the paper stops being a tangle. It becomes a landscape you can walk with your eyes — reading a slope from the spacing of the lines, a town from a cluster of symbols, and a people’s whole way of living from the way they have used their land.
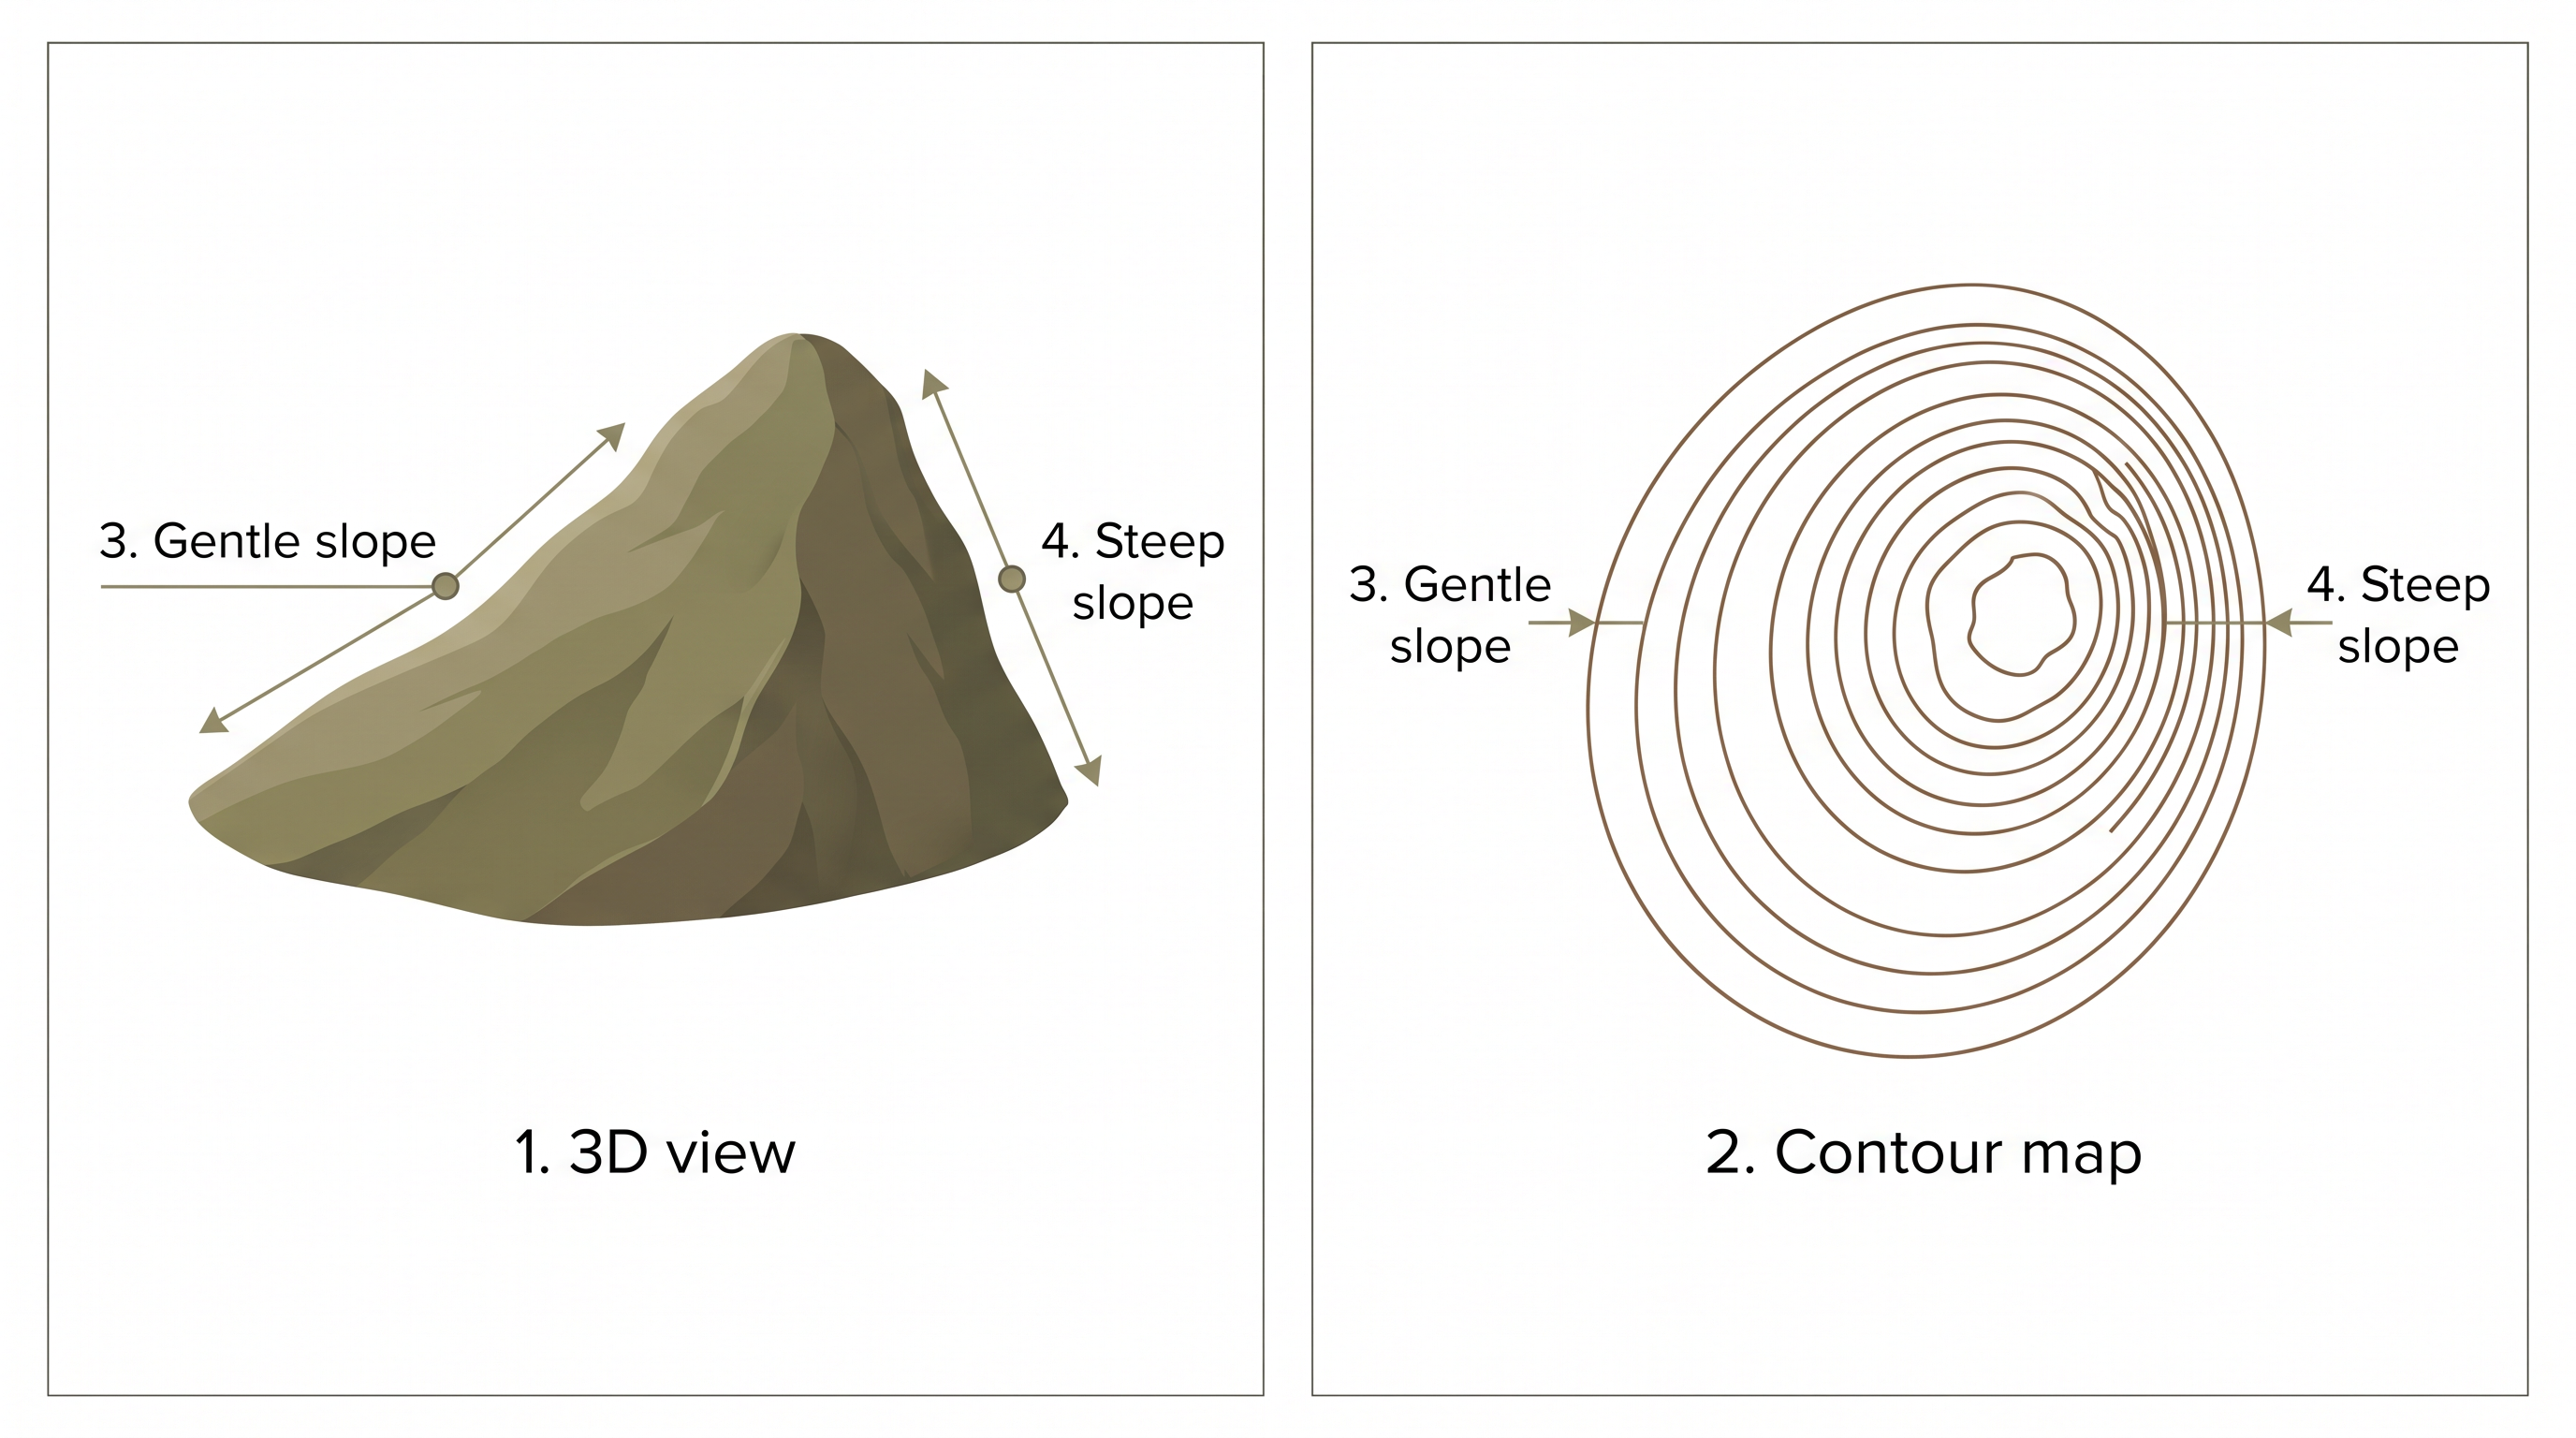
Fig. 5.0 – The same hill shown as a 3D view and as contours.
5.1 Topographical Maps
You already know that a map is one of a geographer’s most important tools, and that maps are grouped both by their scale and by the job they are meant to do. Topographical maps sit right at the base of that grouping. They serve as base maps — the maps from which all the other, more specialised maps are drawn.
A topographical map, also called a general purpose map, is drawn at a relatively large scale and shows the important natural and cultural features of an area side by side: its relief (the shape and height of the land), its vegetation, its water bodies, its cultivated land, its settlements and its transport networks. A large scale here means a small piece of ground is shown in great detail, rather than a whole region shrunk to a glance.
Each country’s National Mapping Organisation prepares and publishes these maps. In India that body is the Survey of India, which maps the entire country. The maps are issued as a series drawn at several scales, and every sheet in a series shares the same reference point, scale, projection, conventional signs, symbols and colours — so the sheets fit together like tiles of one larger picture.
India’s topographical maps are prepared in two such series: the India and Adjacent Countries Series, and the International Map Series of the World.
5.1.1 India And Adjacent Countries Series
The India and Adjacent Countries Series was prepared by the Survey of India until the Delhi Survey Conference of 1937, an international meeting that fixed common mapping standards. After it, the Survey stopped preparing maps for the neighbouring countries and confined itself to India, following the specifications laid down for the International Map Series of the World. It kept, however, the numbering system and the layout plan of the older, abandoned series. That numbering system is shown in Fig. 5.1.
Map
Fig. 5.1 Caption: Reference map of the topographical sheets published by the Survey of India, showing how each sheet is numbered. Brief: An index map of India and the adjacent countries, gridded into numbered rectangles (numbers 32 to 93), with the sub-division scheme shown by the letters A to P and by the 1-to-16 grid inset. Label the graticule from 68°E to 96°E and 8°N to 36°N. Neighbouring countries (Afghanistan, Pakistan, China/Tibet, Nepal, Bhutan, Bangladesh, Myanmar, Sri Lanka) named faintly. The map must show the full extent of India as officially defined, including the Andaman and Nicobar Islands and Lakshadweep.
Reading The Scales
India’s sheets in this series are drawn at five scales, and each scale fixes how much ground a single sheet covers. At 1:10,00,000 one sheet covers 4° × 4° of latitude and longitude; at 1:250,000 it covers 1° × 1°; at 1:1,25,000, 30’ × 30’; at 1:50,000, 15’ × 15’; and at the largest scale, 1:25,000, just 5’ × 7’30”. The numbering of each of these is set out in Fig. 5.1.
A scale written as a ratio, like 1:50,000, means one unit on the map stands for 50,000 of the same units on the ground — one centimetre on the sheet for 50,000 centimetres, which is half a kilometre, of real land. Notice that scale and coverage move in opposite directions. The smallest scale, 1:10,00,000, covers the most ground on one sheet but shows the least detail; the largest scale, 1:25,000, covers the smallest patch but shows the most.
5.1.2 International Map Series Of The World
The International Map Series of the World is designed to produce standardised maps for the entire world, so that a sheet drawn in one country matches one drawn in another. Under this series, maps are prepared at two scales: 1:10,00,00,000 and 1:250,000.
5.1.3 Reading Of Topographical Maps
Reading a topographical map is, in principle, simple. The reader only has to become familiar with its legend — the key that explains the conventional signs, symbols and colours printed on the sheet. Because these signs are agreed internationally, a person can read a map made anywhere in the world without knowing the language of that country. The full set of conventional signs and symbols is shown in Fig. 5.2.
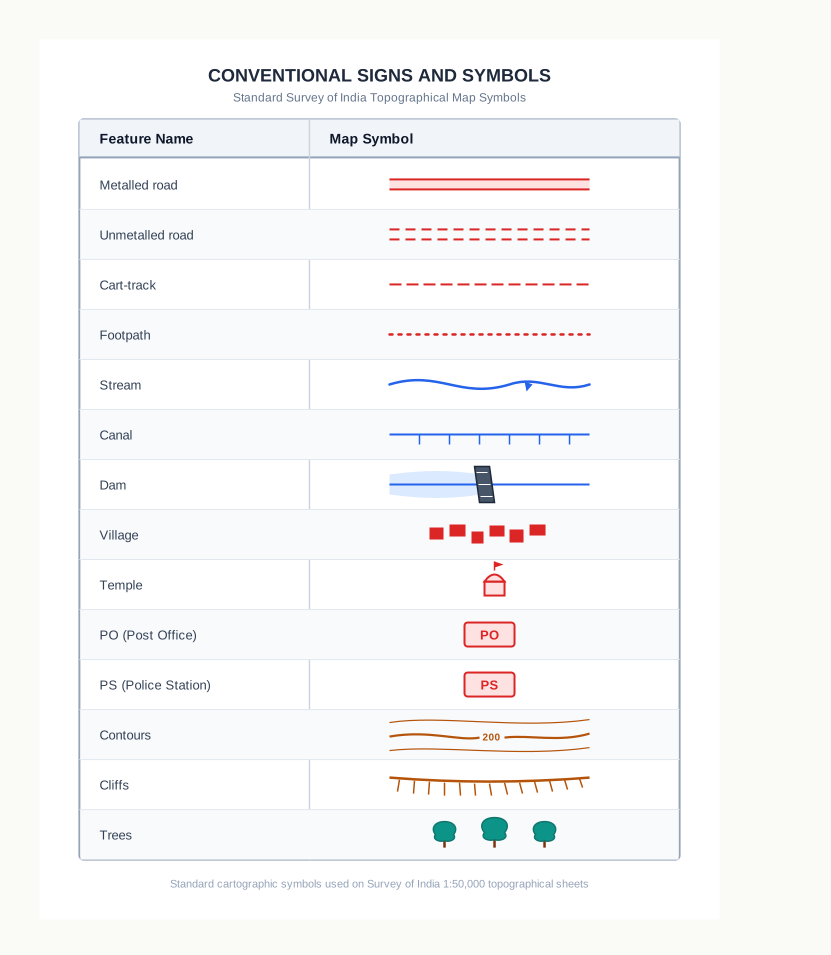
Fig. 5.2 – Conventional signs and symbols on topographical sheets.
5.2 Methods Of Relief Representation
The earth’s surface is never flat and uniform. It rises into mountains and hills and falls away into plateaus and plains, and this constant variation in height is what gives a landscape its character. The high and low points of the surface — its elevations and its depressions — are together called the relief features, or physical features, of the earth. A map made to show them is a relief map.
The hard problem is that the land is three-dimensional and the paper is flat. Over the years, cartographers have found several ways to solve it. Hachures are short lines drawn down the direction of steepest slope; the closer and heavier they are, the steeper the ground they mark. Hill shading imagines light falling across the land from one side, so that slopes facing away from the light are drawn darker — giving the map a shadowed, sculpted look. Layer tints colour the map in bands, each band standing for a range of height, often greens for the lowest land rising through yellows and browns to the highest.
The remaining methods fix or state exact heights. A bench mark is a point on the ground whose height above mean sea level has been precisely measured and permanently marked, so it can serve as a reference. A spot height is a single point on the map with its measured height printed beside it. And contours, the subject of the next section, join all the points that stand at the same height.
These methods form one family of solutions to a single problem, as Fig. 5.3 sets out.
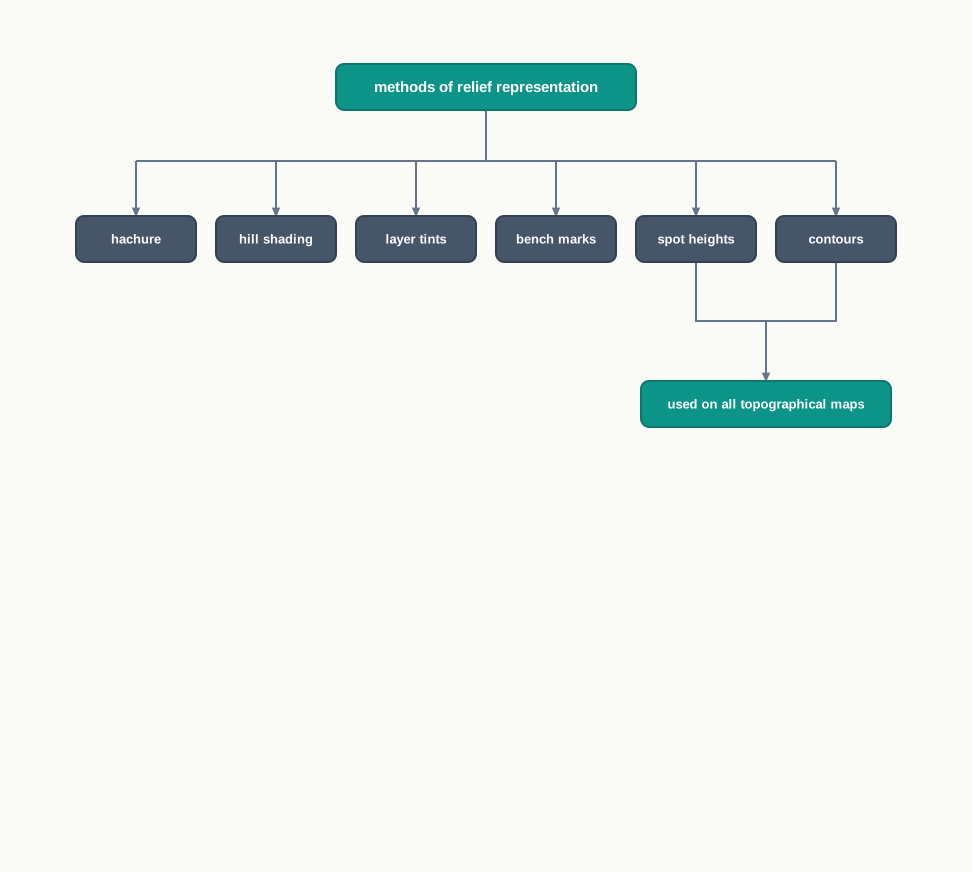
Fig. 5.3 – Methods of relief representation.
Of all these methods, two are used on every topographical sheet: contours and spot heights. The others appear on maps made for other purposes, but the topo-sheet leans on the contour line and the printed spot height to carry the shape of the land.
5.3 Contours
A contour is an imaginary line joining places that stand at the same elevation above mean sea level. A map that shows the shape of the land through such lines is called a contour map, and the method is a remarkably versatile one: from a set of contour lines a reader can picture the whole topography of an area without ever seeing it.
Earlier, contours were fixed by ground surveys and by levelling — measuring heights point by point across the land. The invention of photography, and then of aerial photography, has since replaced most of that painstaking fieldwork, and photographs taken from the air now do much of the mapping.
Contours are drawn at fixed vertical steps — 20, 50 or 100 metres above mean sea level, for example. This step is the contour interval, also called the vertical interval, and it is usually kept constant across a single map and stated in metres. While the vertical interval between two successive lines stays the same, the horizontal distance between them on the map changes from place to place with the slope. That horizontal distance is the horizontal equivalent (HE): it is large where the slope is gentle and grows smaller as the slope steepens. This single fact — constant height step, varying spacing — is what lets contour spacing report the slope of the land.
5.3.1 Some Basic Features Of Contour Lines Are
A contour line is drawn to join places of equal height, and the line’s shape carries information about both the height and the slope, or gradient, of the landform.
The spacing is the key to reading a slope. Closely spaced contours mean a steep slope, because the land gains a lot of height over a short horizontal distance; widely spaced contours mean a gentle slope. Where two or more contour lines merge into each other, they mark a vertical or near-vertical feature such as a cliff or a waterfall. And as a rule, two contours of different elevation do not cross one another, since a single point on the ground cannot have two different heights.
5.3.2 Drawing Of Contours And Their Cross Sections
Every topographical feature carries some degree of slope. A flat plain has gentle slopes; cliffs and gorges have very steep ones; valleys and mountain ranges run the whole range from steep to gentle within a single feature. Because the steepness varies, the spacing of the contours varies with it — and that spacing is the first thing a reader interprets. The landforms below each leave a distinct contour signature, and once you know the signatures you can name a feature from its lines alone.
5.3.3 Types Of Slope
Slopes can be grouped broadly into gentle, steep, concave, convex, and irregular or undulating. Each type leaves its own spacing pattern in the contours.
A gentle slope is one where the angle of the land is very low; its contours lie far apart. A steep slope has a high angle, and its contours are closely spaced. The interesting cases are the two that change along their length. A concave slope is gentle in its lower parts and steep in its upper parts, so its contours are widely spaced low down and crowd together higher up. A convex slope is the reverse — gentle in the upper part and steep in the lower — so its contours are widely spaced at the top and closely spaced at the bottom.
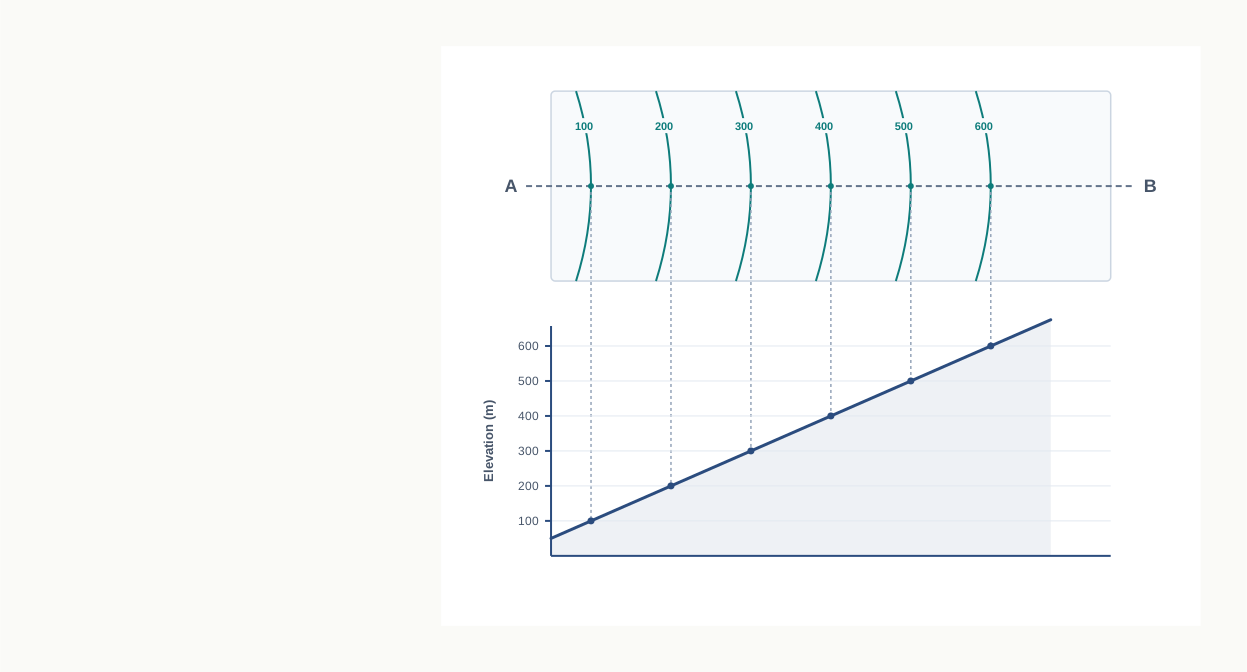
Fig. 5.4 – Gentle slope and its cross-section.
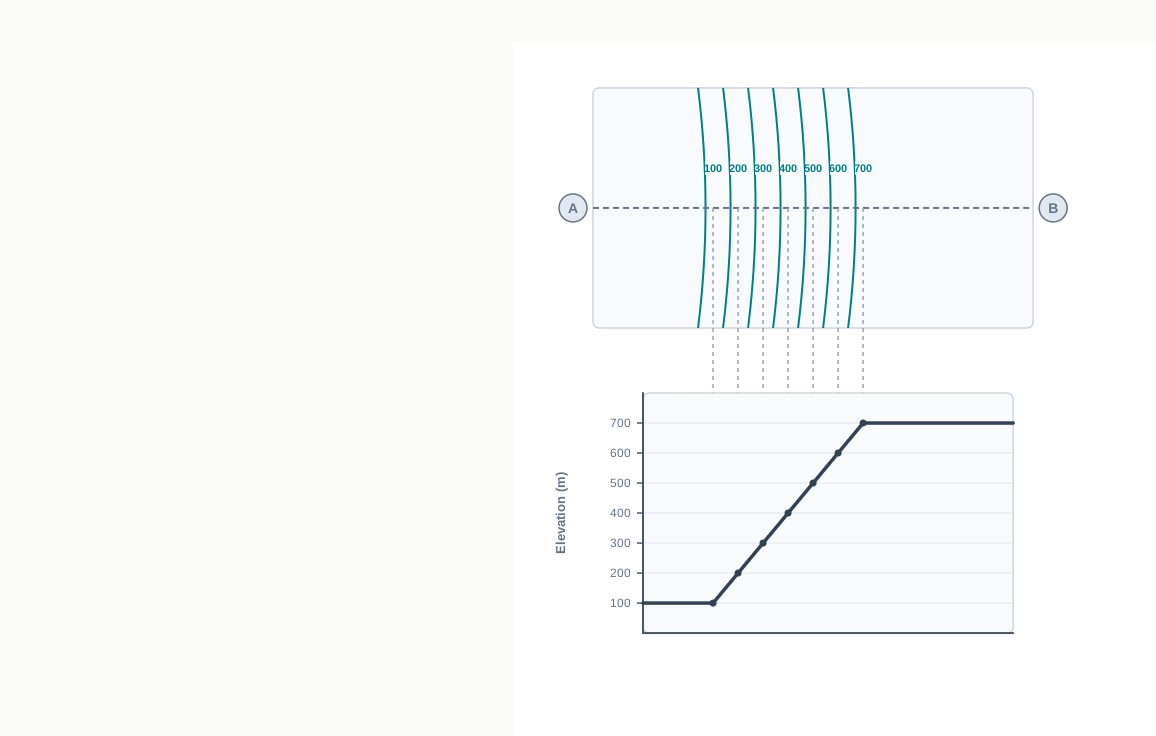
Fig. 5.5 – Steep slope and its cross-section.
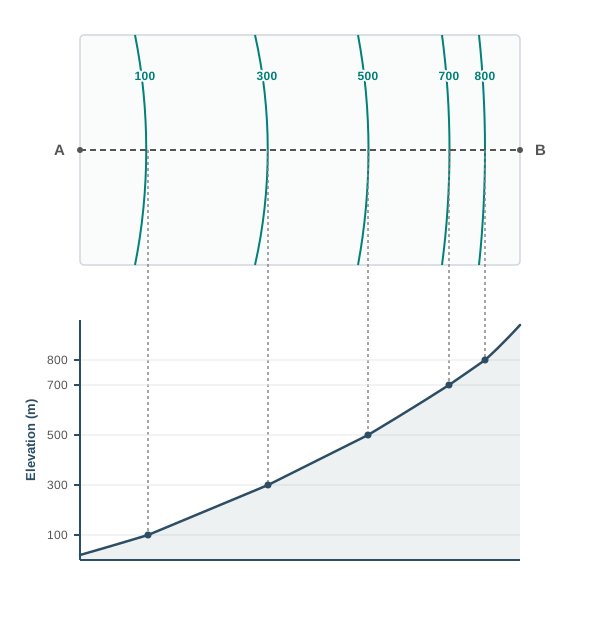
Fig. 5.6 – Concave slope and its cross-section.
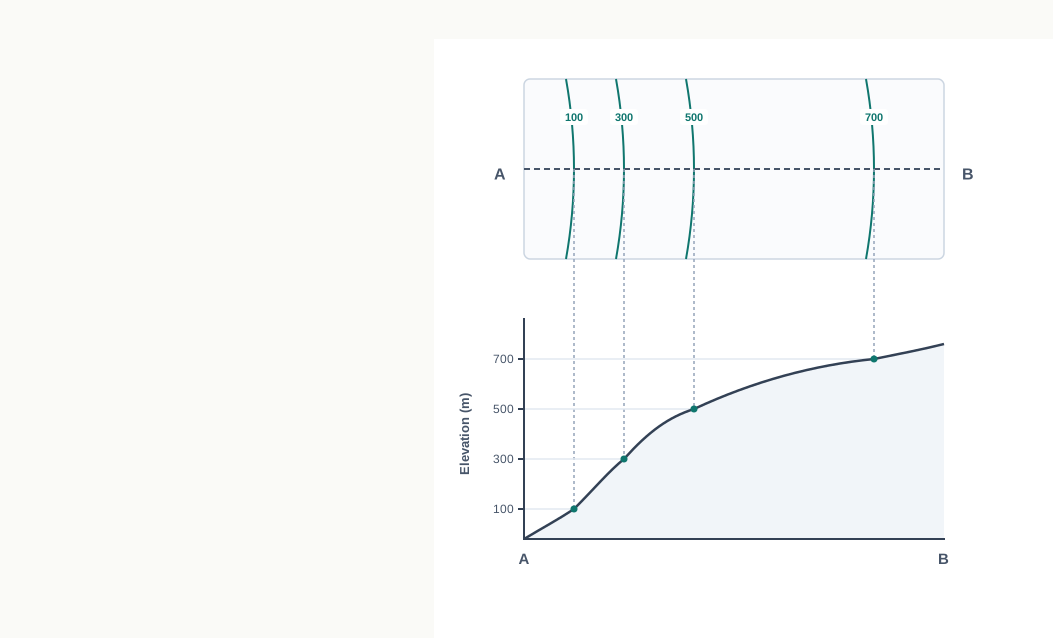
Fig. 5.7 – Convex slope and its cross-section.
5.3.4 Types Of Landform
Two simple landforms show the idea clearly. A conical hill rises almost uniformly from the land around it; with a uniform slope and a narrow top, it is drawn as concentric contours spaced at almost regular intervals. A plateau is a widely stretched, flat-topped highland with relatively steep sides, rising above the plain or the sea around it; its contours are close-spaced at the margins, where the sides are steep, while the innermost contour shows a wide gap between its two sides, marking the broad flat top.
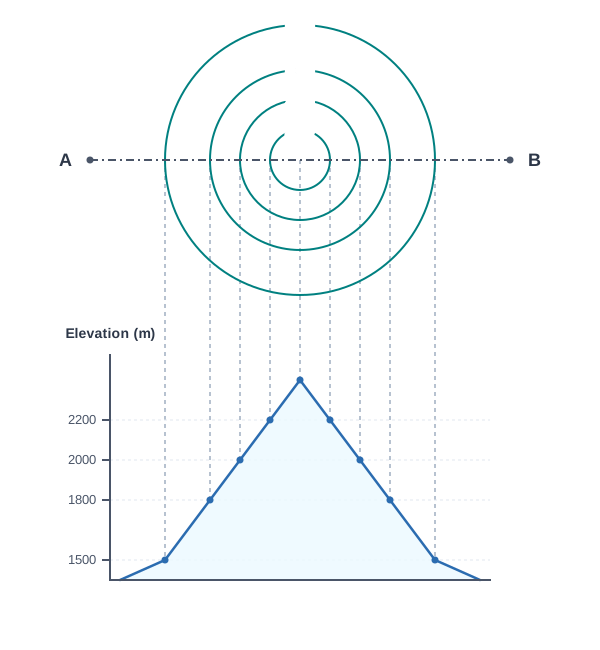
Fig. 5.8 – Conical hill and its cross-section.
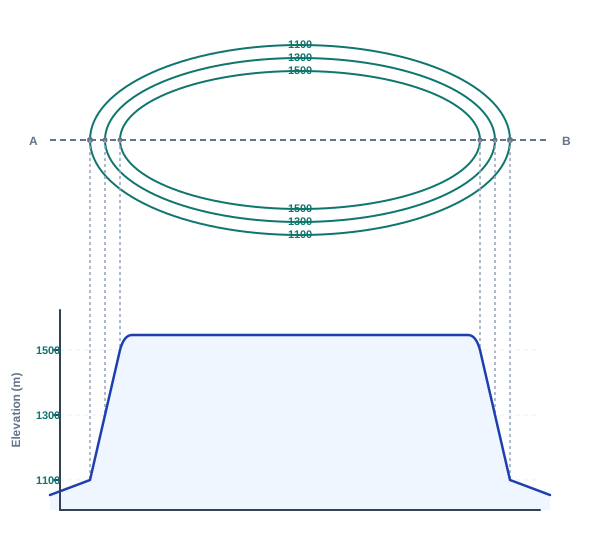
Fig. 5.9 – Plateau and its cross-section.
5.3.5 Valley
A valley is a geomorphic feature lying between two hills or ridges, formed by the lateral (sideways) erosion of a river or a glacier. Several kinds of valley and related features each have their own contour signature.
River Valleys And Glacial Valleys
A ‘V’-shaped valley resembles the letter V and occurs in mountainous areas cut by rivers. Its lowest part — the valley floor — is shown by the innermost contour line, which has a very small gap between its two sides and carries the lowest value; the contour values then increase at uniform intervals outward. A ‘U’-shaped valley is formed instead by the strong lateral erosion of glaciers at high altitudes; its flat, wide bottom and steep sides make it resemble the letter U. It too has the lowest value on the innermost contour, but that contour shows a wide gap between its sides, matching the broad valley floor, with values rising uniformly outward. The contrast is worth holding in mind: the V-shape is a river’s work and closes to a narrow point, while the U-shape is a glacier’s work and closes to a broad flat floor.
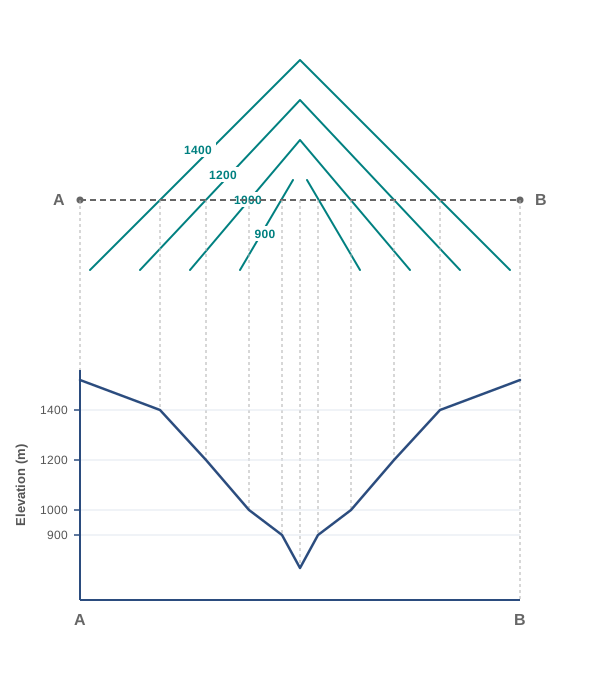
Fig. 5.10 – V-shaped valley and its cross-section.
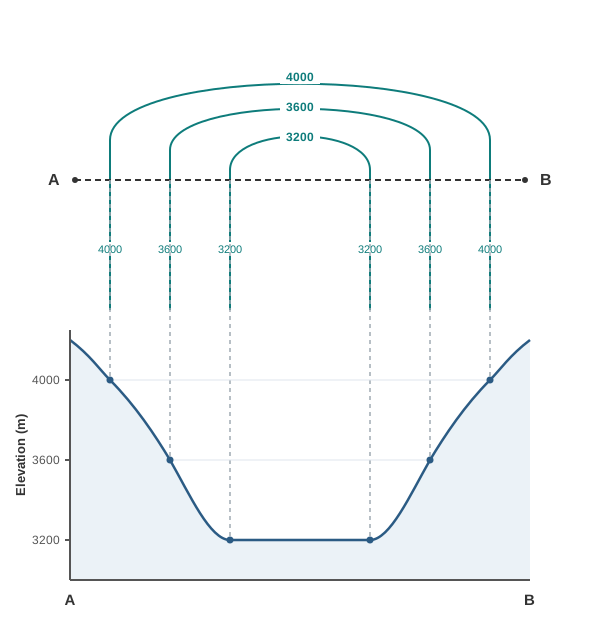
Fig. 5.11 – U-shaped valley and its cross-section.
Gorge, Spur, Cliff And Waterfall
A gorge forms at high altitudes where a river’s vertical (downward) erosion is stronger than its sideways erosion, cutting a deep, narrow valley with very steep sides. On a map it appears as very closely spaced contour lines, the innermost showing a small gap between its two sides. A spur is a tongue of land projecting from higher ground into lower ground. It is drawn with V-shaped contours, but reversed from a valley: the arms of the V point towards the higher ground and the apex of the V points to the lower ground.
A cliff is a very steep or almost perpendicular face of a landform; on a map it is recognised where the contours run very close together and finally merge into one line. A waterfall is a sudden, more or less perpendicular descent of water from a considerable height in a river’s bed. It may be joined upstream or downstream by a cascading stretch of stream called rapids. The contours representing a waterfall merge into one another where they cross the river, while the rapids are shown by relatively more distant contour lines.
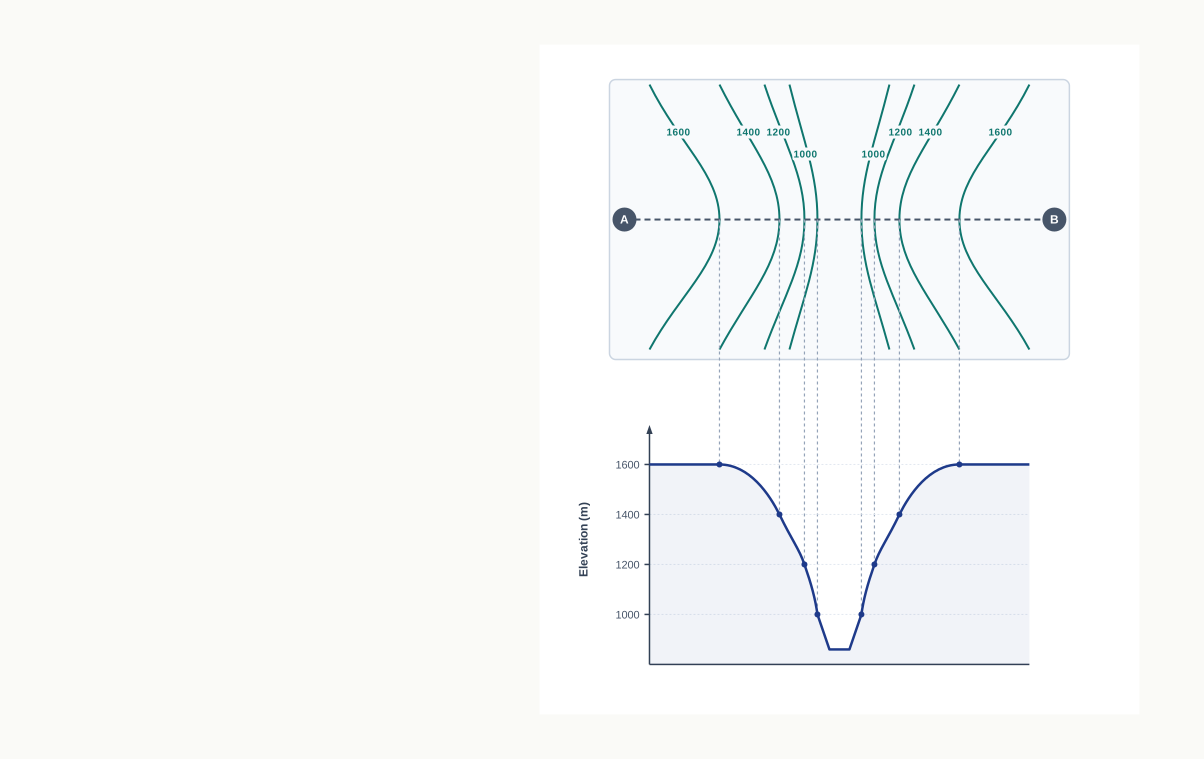
Fig. 5.12 – Gorge and its cross-section.
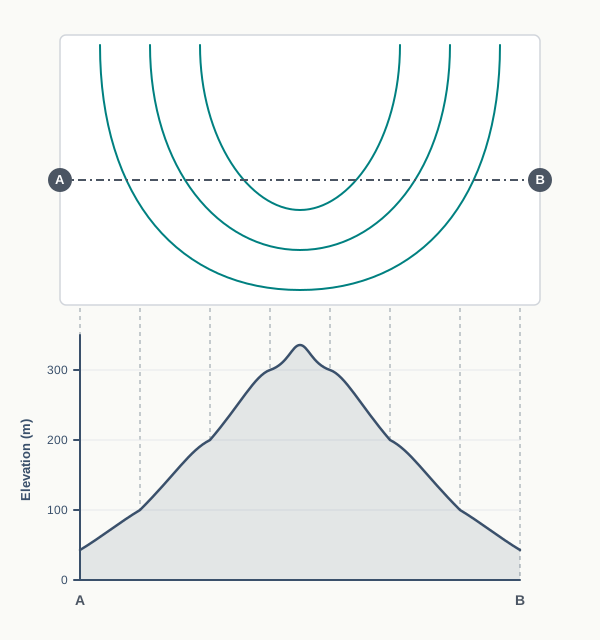
Fig. 5.13 – Spur and its cross-section.
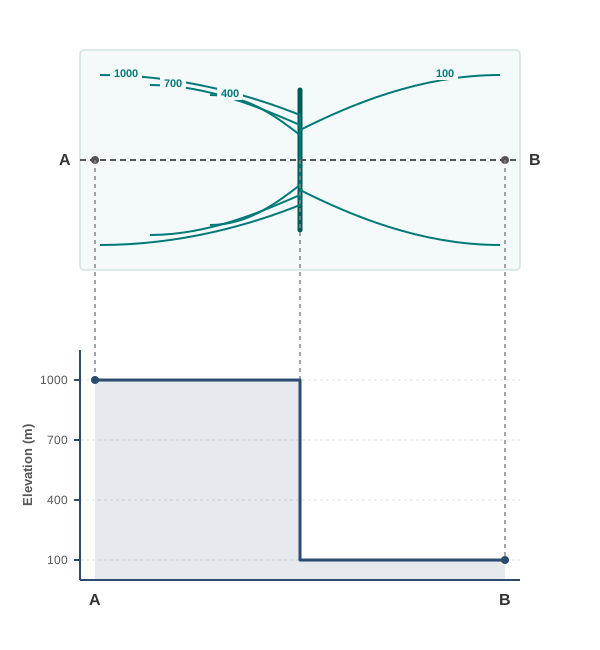
Fig. 5.14 – Cliff and its cross-section.
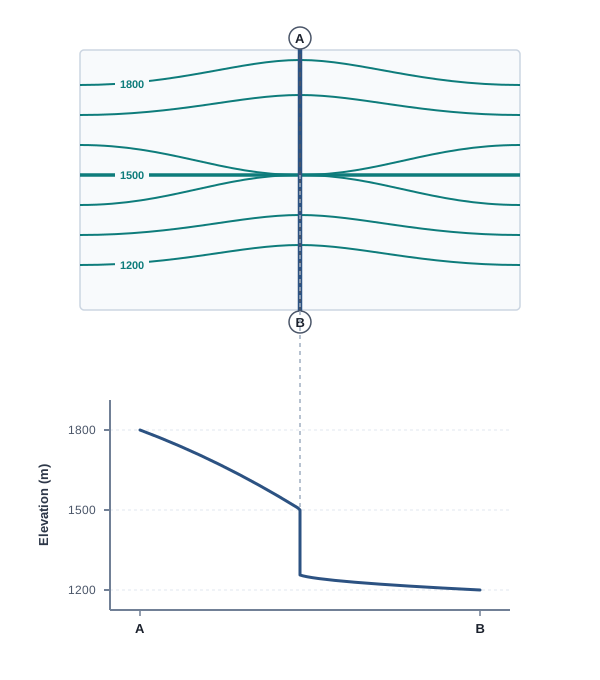
Fig. 5.15 – Waterfall and its cross-section.
5.3.6 Steps For Drawing A Cross-Section
A cross-section turns the contours along a chosen line into a side view of the ground. The vertical scale sets how much height each centimetre stands for, so the profile can be read at a glance. The following steps draw the cross-section of any relief feature from its contours.
- Draw a straight line cutting across the contours on the map and mark it as AB.
- Take a strip of white paper or graph paper and place its edge along the line AB.
- Mark the position and the value of every contour that the line AB cuts.
- Choose a suitable vertical scale — for example, ½ cm = 100 metres — and draw horizontal lines parallel to each other, equal in length to AB. The number of these lines should be equal to or more than the total number of contour lines.
- Mark the appropriate values against these horizontal lines, along the vertical of the cross-section, starting the numbering from the lowest value the contours reach.
- Now place the edge of the marked paper along the bottom horizontal line so that its AB matches the AB of the map, and mark the contour points on it.
- Draw perpendiculars up from the AB line at each contour point, meeting the horizontal line that carries its height value.
- Smoothly join all the points marked on the different height lines. The joined curve is the cross-section.
5.4 Identification Of Cultural Features From Topographical Sheets
Alongside the natural, physical features of the land, a topographical sheet records the marks people have left on it. Settlements, buildings, roads and railways are cultural features — the works of human beings, as against the physical features shaped by nature — and they are shown on the sheet through conventional signs, symbols and colours. Where these features sit, and how they are spread across the map, tells a reader a great deal about the area itself.
5.4.1 Distribution Of Settlements
A settlement can be read on the map through four things: its site (the actual ground it stands on), its location pattern, its alignment, and its density. The nature and the causes of a settlement pattern become much clearer when the settlement map is compared against the contour map, because relief and water largely decide where people choose to live.
Rural And Urban Types
Four types of rural settlement can be identified on a map: compact, where houses are bunched tightly together; scattered, where they are spread apart; linear, where they are strung out along a line; and circular, where they are arranged around a central space. Urban centres can be told apart by the function they serve — a cross-road town, a nodal point, a market centre, a hill station, a coastal resort centre, a port, a manufacturing centre with its suburban villages or satellite towns, a capital town, or a religious centre. These patterns and types are set out together in Fig. 5.16 and Fig. 5.17.
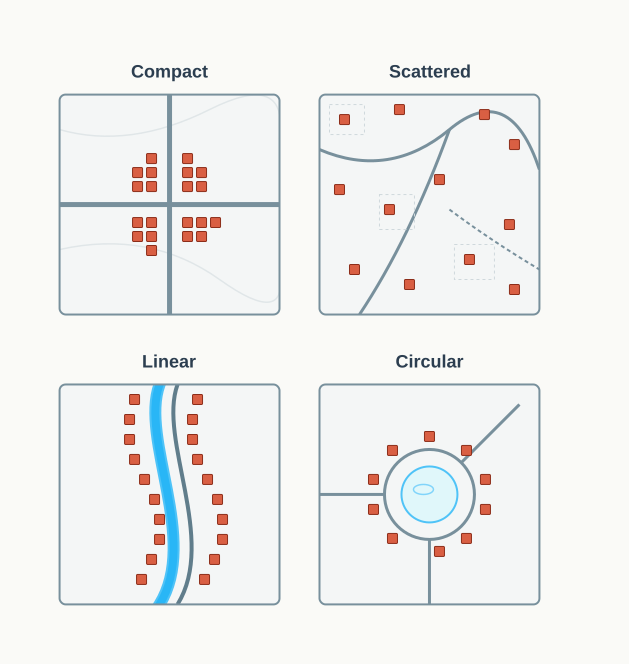
Fig. 5.16 – The four types of rural settlement patterns.
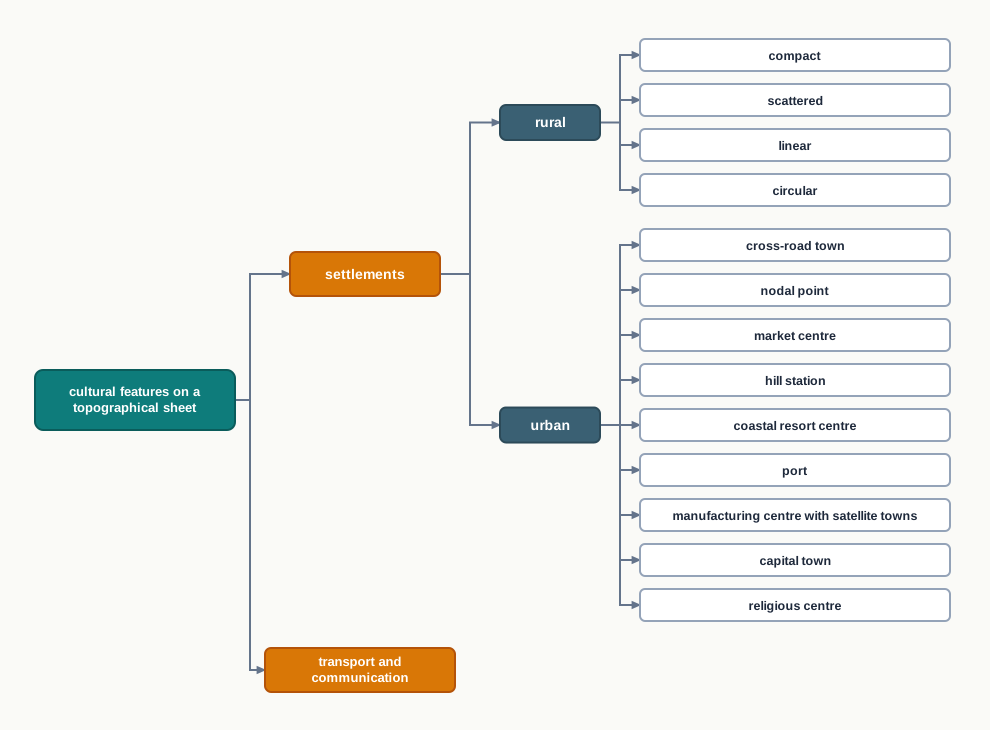
Fig. 5.17 – Cultural features recorded on a topographical sheet.
Why Settlements Sit Where They Do
Several factors decide the site of a settlement: a source of water, a provision of food, the nature of the relief, the nature and character of the occupation people follow, and defence. The site is best examined against the contour and drainage map, since those two maps show the water and the lie of the land that the factors depend on. The density of a settlement is directly tied to its food supply — land that can feed more people carries a denser settlement.
Sometimes village settlements form alignments, spreading out along a river valley, a road, an embankment or a coastline. Such strung-out villages are called linear settlements. Among urban settlements, a cross-road town takes on a fan-shaped pattern: the houses line the roadsides, and the crossing sits at the heart of the town as its main market place. In a nodal town, by contrast, the roads radiate outward in all directions from a central point.
5.4.2 Transport And Communication Pattern
The means of transport and communication in an area, and how dense they are, are shaped directly by its relief, its population, its size and the way its resources have been developed. These too are drawn on the sheet through conventional signs and symbols. Read together, the transport and communication lines add another useful layer of information about the area the map shows — how its parts are joined, and how easily people and goods can move across it.
5.5 Interpretation Of Topographical Maps
Interpreting a topographical sheet asks for two things: a knowledge of map language, and a steady sense of direction. Begin by finding the northline and the scale, and orient the sheet accordingly, so that directions and distances on the paper match the real ground. You also need a thorough grasp of the legend, or key, that explains the features drawn on the sheet. Every topo-sheet carries a table of the conventional signs and symbols it uses, as shown in Fig. 5.2; and because these signs are agreed internationally, a reader anywhere can interpret a map without knowing the language of the country that made it.
A topographical sheet is usually interpreted under five heads: marginal information, relief and drainage, land use, means of transport and communication, and human settlement. Each is examined in turn below.
5.5.1 Marginal Information
The marginal information is what the sheet tells you about itself, printed around its edges. It includes the topographical sheet number, the location of the area, the grid references, the extent of the sheet in degrees and minutes, the scale, and the districts the sheet covers. Grid references are the numbered lines that let you pin down any point by its coordinates. This information sets the frame before you read anything inside it.
5.5.2 Relief Of The Area
Here the general topography is studied to identify the plains, plateaus, hills and mountains, along with their peaks, ridges and spurs, and the general direction in which the land slopes. It is read under four heads. A hill is described by its slope — concave, convex, steep or gentle — and its shape. A plateau is described as broad or narrow, and as flat, undulating or dissected (cut into by streams). A plain is described by its type: alluvial, laid down by rivers; glacial, shaped by ice; karst, formed on limestone; coastal, along the sea; or marshy, where the ground is waterlogged. A mountain is described by its general elevation, its peaks and its passes.
5.5.3 Drainage Of The Area
The drainage is read from the important rivers and their tributaries, the type and extent of the valleys they have cut, and the overall pattern in which the streams are arranged. The main drainage patterns are dendritic, radial, ring, trellis and internal, and each hints at the rock and structure beneath, as Fig. 5.18 shows.
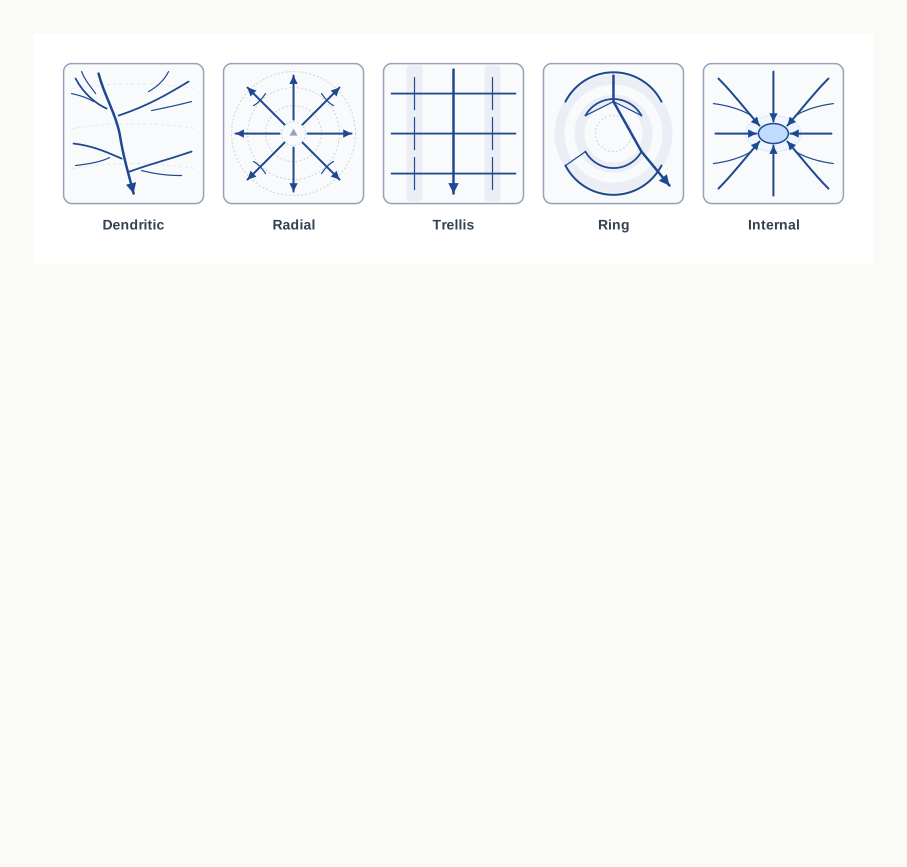
Fig. 5.18 – The main drainage patterns.
5.5.4 Land Use
Land use covers the ways the ground is put to work. It includes natural vegetation and forest — noting which part is forested, whether the forest is dense or thin, and its category, such as Reserved, Protected, or Classified and Unclassified. It includes agricultural land, orchards, wasteland and industrial land. And it includes the facilities and services an area is provided with — schools, colleges, hospitals, parks, airports and electric substations among them.
5.5.5 Transport And Communication
The means of transport and communication are read from the national and state highways, district roads, cart-tracks, camel-tracks and footpaths; from the railways and waterways; and from the major communication lines and the post offices marked on the sheet. Together they show how the parts of the area are joined.
5.5.6 Settlement
Settlements are studied under two heads. Rural settlements are read by their types and patterns — compact, semi-compact, dispersed, linear and so on. Urban settlements are read by their type and function — capital cities, administrative towns, religious towns, port towns and hill stations among them. The patterns themselves were set out earlier in the chapter; here they become one of the layers through which the whole sheet is interpreted.
5.5.7 Occupation
The occupation of the people can be worked out from the land use and the type of settlement together, even though no line on the map states it directly. In rural areas the main occupation of most people is agriculture. In tribal regions, lumbering and simple, small-scale agriculture dominate. Along coasts, fishing is practised. And in cities and towns, services and business appear as the main occupations. The map does not name a livelihood; it lets you infer one from the evidence it does show.
5.6 Map Interpretation Procedure
Map interpretation goes a step beyond simply naming features. It studies the factors that explain the causal relationships among the several features shown on the sheet — the ways in which one pattern helps account for another. The distribution of natural vegetation and cultivated land, for instance, is understood far better against the background of the landform and the drainage. In the same way, the distribution of settlements can be examined alongside the transport network and the nature of the topography, because easy ground and good links draw people together.
The Steps In Order
A few steps make the interpretation orderly, and Fig. 5.19 sets them out as a sequence.
First, use the index number of the sheet to find where the area lies in India; this places it within the country’s major and minor physiographic divisions — its broad natural regions of mountains, plains, plateaus and coasts. Note the scale and the contour interval too, since together they fix the extent of the area and the general shape of its land.
Next, trace out the main features on separate tracing sheets — transparent sheets laid over the map so each layer can be studied on its own. Trace the major landforms as shown by the contours and other graphical features; the drainage and water features, meaning the main river and its important tributaries; the land use, such as forest, agricultural land, wastes, a sanctuary (a protected area for wildlife), a park or a school; and the settlement and transport pattern.
Then describe the distributional pattern of each feature separately, drawing attention to its most important aspect. Finally, superimpose pairs of these tracings — lay one over another — and note any relationship between the two patterns. Laying a contour map over a land use map, for example, reveals the relationship between the degree of slope and the type of land put to use.
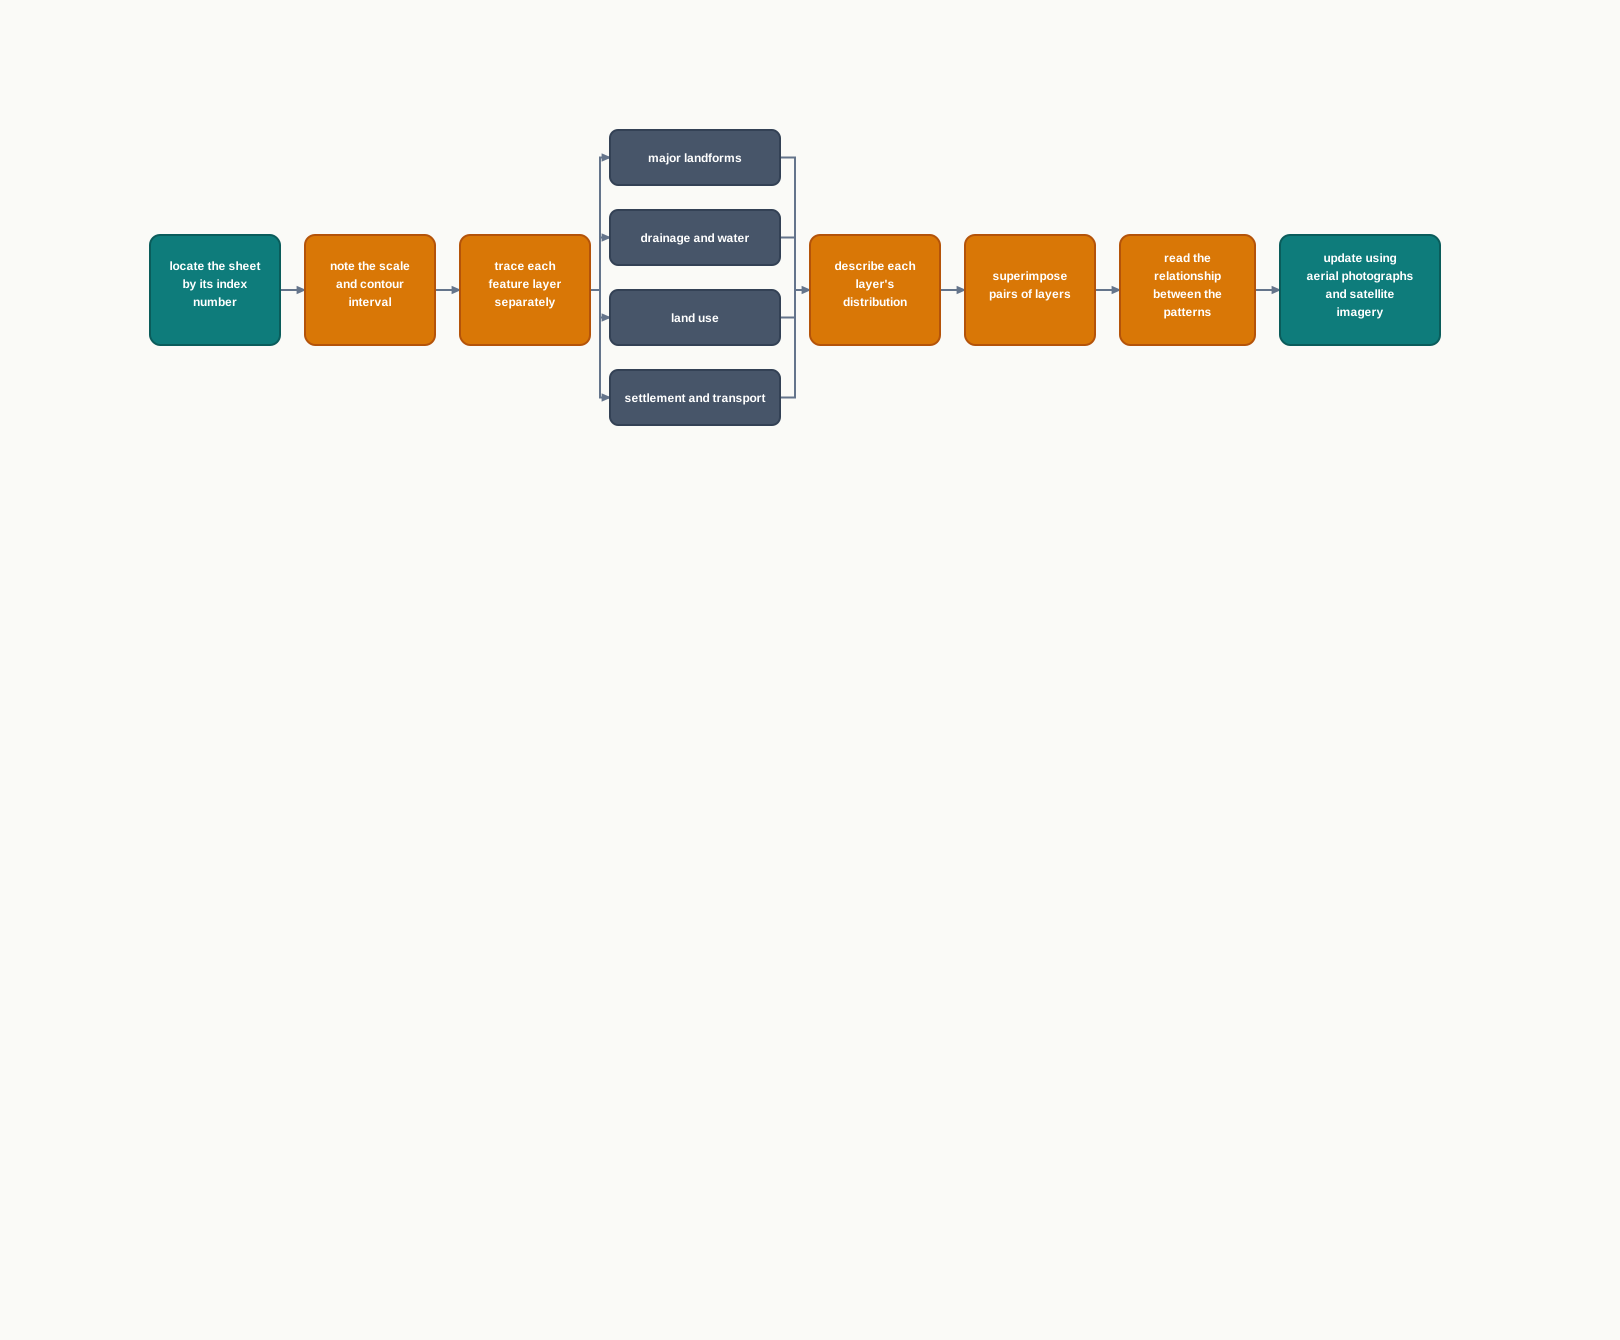
Fig. 5.19 – Steps for map interpretation.
Keeping The Map Up To Date
A topographical sheet is a record of one moment, and the ground keeps changing. Aerial photographs and satellite imageries of the same area, taken at the same scale, can be compared with the sheet to check what has altered and to update the information it holds.
5.7 Summary
- Topographical maps, also called general purpose maps, are large-scale base maps that show the natural and cultural features of an area together; in India the Survey of India prepares them for the whole country as a series drawn at several scales.
- India’s maps are made in two series — the India and Adjacent Countries Series and the International Map Series of the World — and each scale covers a fixed area of latitude and longitude, from 4° × 4° at 1:10,00,000 down to 5’ × 7’30” at 1:25,000.
- Relief can be shown by hachures, hill shading, layer tints, bench marks, spot heights and contours; of these, contours and spot heights are used on every topographical sheet.
- A contour joins points of equal height above mean sea level; the contour interval (the vertical step) stays constant, while the horizontal spacing changes with the slope — closely spaced lines mean a steep slope, widely spaced lines a gentle one.
- Where contours merge they mark a vertical feature such as a cliff or a waterfall; and each landform — the slope types, the conical hill, the plateau, the V- and U-shaped valleys, the gorge, the spur — has its own contour signature.
- A cross-section turns the contours along a chosen line AB into a side view of the ground, drawn to a chosen vertical scale.
- Cultural features — settlements (rural ones as compact, scattered, linear or circular; urban ones by their function) and the transport and communication network — are read from the conventional signs and from the pattern in which they are distributed.
- A sheet is interpreted under marginal information, relief and drainage, land use, transport and communication, and settlement; the occupation of the people is not stated but inferred from the land use and the settlements.
- Interpretation studies the causal relationships among features by tracing them out, describing each pattern, and superimposing pairs of maps; aerial photographs and satellite images of the same scale are used to update the sheet.
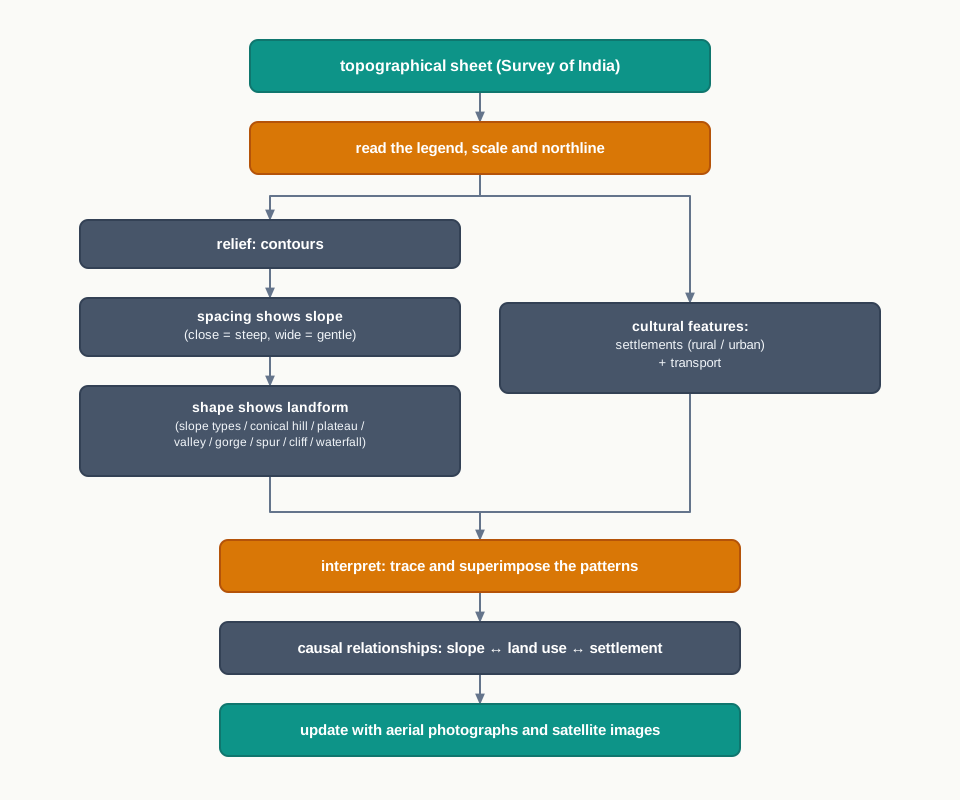
Fig. 5.20 – Process of reading a topographical sheet.
What This Chapter Cannot Tell You
A contour map fixes the height only along the lines actually drawn; the ground between two contours may rise or dip unseen, and a spot height speaks only for its own exact point. The sheet is a snapshot of a single moment, and a printed map may be years older than the land it shows — which is why aerial photographs and satellite images are needed to bring it up to date. And the symbols tell you that a feature exists and where it lies, but never why it is there; the cause has to be inferred by reading the features against one another.
5.8 NCERT Questions
What are topographical maps?
Name the organisation which prepares the topographical maps of India.
Which are the commonly used scales for mapping our country used by the Survey of India?
What are contours?
What does the spacing of contours indicate?
What are conventional signs?
Write short notes on
Contours.
‘Marginal Information’ in topographical sheets.
The Survey of India.
Explain what is meant by ‘map interpretation’ and what procedure is followed for its interpretation.
If you are interpreting the cultural features from a topographical sheet, what information would you like to seek and how would you derive this information? Discuss with the help of suitable examples.
Draw the conventional signs and symbols for the following features: (i) International Boundary, (ii) Bench Mark, (iii) Villages, (iv) Metalled Road, (v) Footpath with bridges, (vi) Places of Worship, (vii) Railwayline.
Study the contour pattern in Fig. 5.21 and answer the following questions.
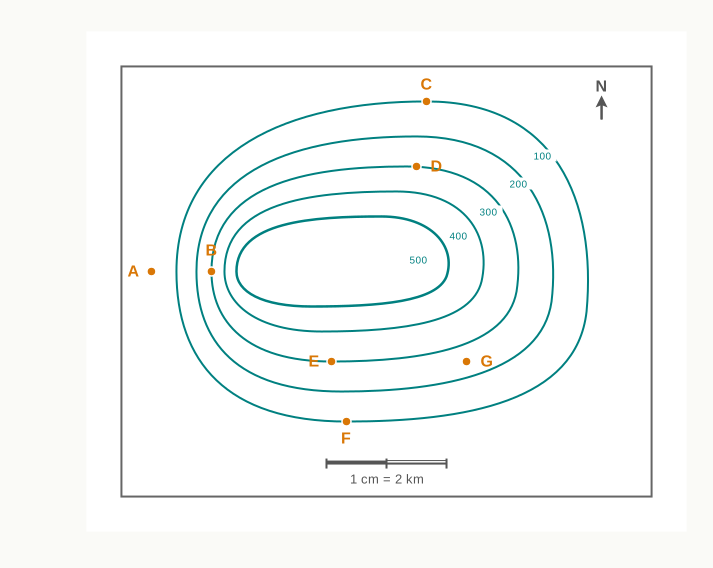
Fig. 5.21 – Contour pattern for exercise questions.
Name the geographical feature formed by the contours.
Find out the contour interval in the map.
Find out the map distance between E and F and convert it into ground distance.
Name the type of slope between A and B; C and D; and E and F.
Find out the direction of E, D and F from G.
Study the extract from topographical sheet No. 63K/12 shown in Map 5.1 and answer the following questions.
Map
Fig. 5.1 Caption: Part of topographical sheet No. 63K/12 — Uttar Pradesh, Mirzapur and Varanasi district, at R.F. 1:50,000. Brief: Reproduce the coloured topographical sheet extract showing the Ganga river crossing the sheet, the settlements (including Kachhwa, Bhatauli and Baraini), the roads, the canal and the ferry, with the graticule running from 82°40’E to 82°45’E and 25°10’N to 25°15’N, and the yellow tint marking cultivated land. This is a local sheet extract, not a map of India.
Convert 1:50,000 into a statement of scale.
Name the major settlements of the area.
What is the direction of flow of the river Ganga?
On which one of the banks of the river Ganga is Bhatauli located?
What is the pattern of rural settlements along the right bank of the river Ganga?
Name the villages or settlements where a Post Office is located.
What does the yellow colour in the area refer to?
What means of transportation is used to cross the river by the people of Bhatauli village?
Study the extract from topographical sheet 63K/12 shown in Map 5.2 and answer the following questions.
Map
Map 5.2 Caption: Part of topographical sheet No. 63K/12 — Uttar Pradesh, Mirzapur and Varanasi district, at R.F. 1:50,000. Brief: Reproduce the coloured topographical sheet extract showing the Danti Reserved Forest, the Jamtihwa Nadi, the Kuardari Nala, the Sipu Nadi, the Lower Khajuri Dam, the power lines, and the vegetation types (open scrub and fairly dense mixed jungle and bamboo), with the graticule running from 82°35’E to 82°40’E and 25°0’N to 25°5’N. This is a local sheet extract, not a map of India.
Give the height of the highest point on the map.
River Jamtihwa Nadi is flowing through which quarter of the map?
Which is the major settlement located to the east of the Kuardari Nala?
What type of settlement does the area have?
Name the geographical feature represented by the white patches in the middle of the Sipu Nadi.
Name the two types of vegetation shown on the part of the topographical sheet.
What is the direction of the flow of the Kuardari?
In which part of the sheet area is the Lower Khajuri Dam located?
5.9 Check Your Concepts
The chapter lists several methods of showing relief on a map. Name them, and state which two of them are used on every topographical sheet.
The chapter calls the horizontal distance between two successive contours the horizontal equivalent. Why does it change from place to place on the same map, even though the contour interval does not?
Both a concave slope and a convex slope change their steepness along their length. Describe how their contour spacing differs, so that one could be told from the other on a map.
A V-shaped and a U-shaped valley are both shown by nested contours with the lowest value innermost. What single difference in the innermost contour lets you tell the river-cut valley from the glacier-cut one, and why does that difference arise?
The contours of a spur form V-shapes, just as a valley’s do, yet a spur is higher ground and a valley is lower. How do the V-shapes let you tell the two apart?
Using Fig. 5.1, describe how you would find the number of the topographical sheet that covers a chosen part of India.
A topographical sheet names no one’s livelihood, yet the main occupation of an area can be inferred from it. Explain what evidence you would use, and how a mainly farming area would look different from a mainly fishing one.