Chapter 2: The Demographic Structure of the Indian Society
In February 2011, close to twenty-seven lakh enumerators — most of them schoolteachers — walked out with a printed schedule and a pen, and knocked on every door in India. They climbed to hill hamlets, crossed rivers into island villages, and stopped at pavements and railway platforms to count people who had no door to knock on at all. At each household they asked a set of plain questions. How many people live here? What are their ages? Who is male, who is female? Who can read and write? Is this a village or a town?
None of these questions is difficult. Yet when the answers of more than a hundred and twenty crore people were added up, they produced facts that no single household could have told you. That India had 121 crore people. That for every 1000 men there were 943 women — and among children under six, only 919 girls for every 1000 boys. That 73 out of every 100 Indians above the age of six could read and write, but the figure for women was far lower than for men. That nearly 69 out of every 100 Indians still lived in a village.
These numbers are not just arithmetic. They are a photograph of Indian society — of how it treats its daughters, educates its children, and moves its people from field to city.
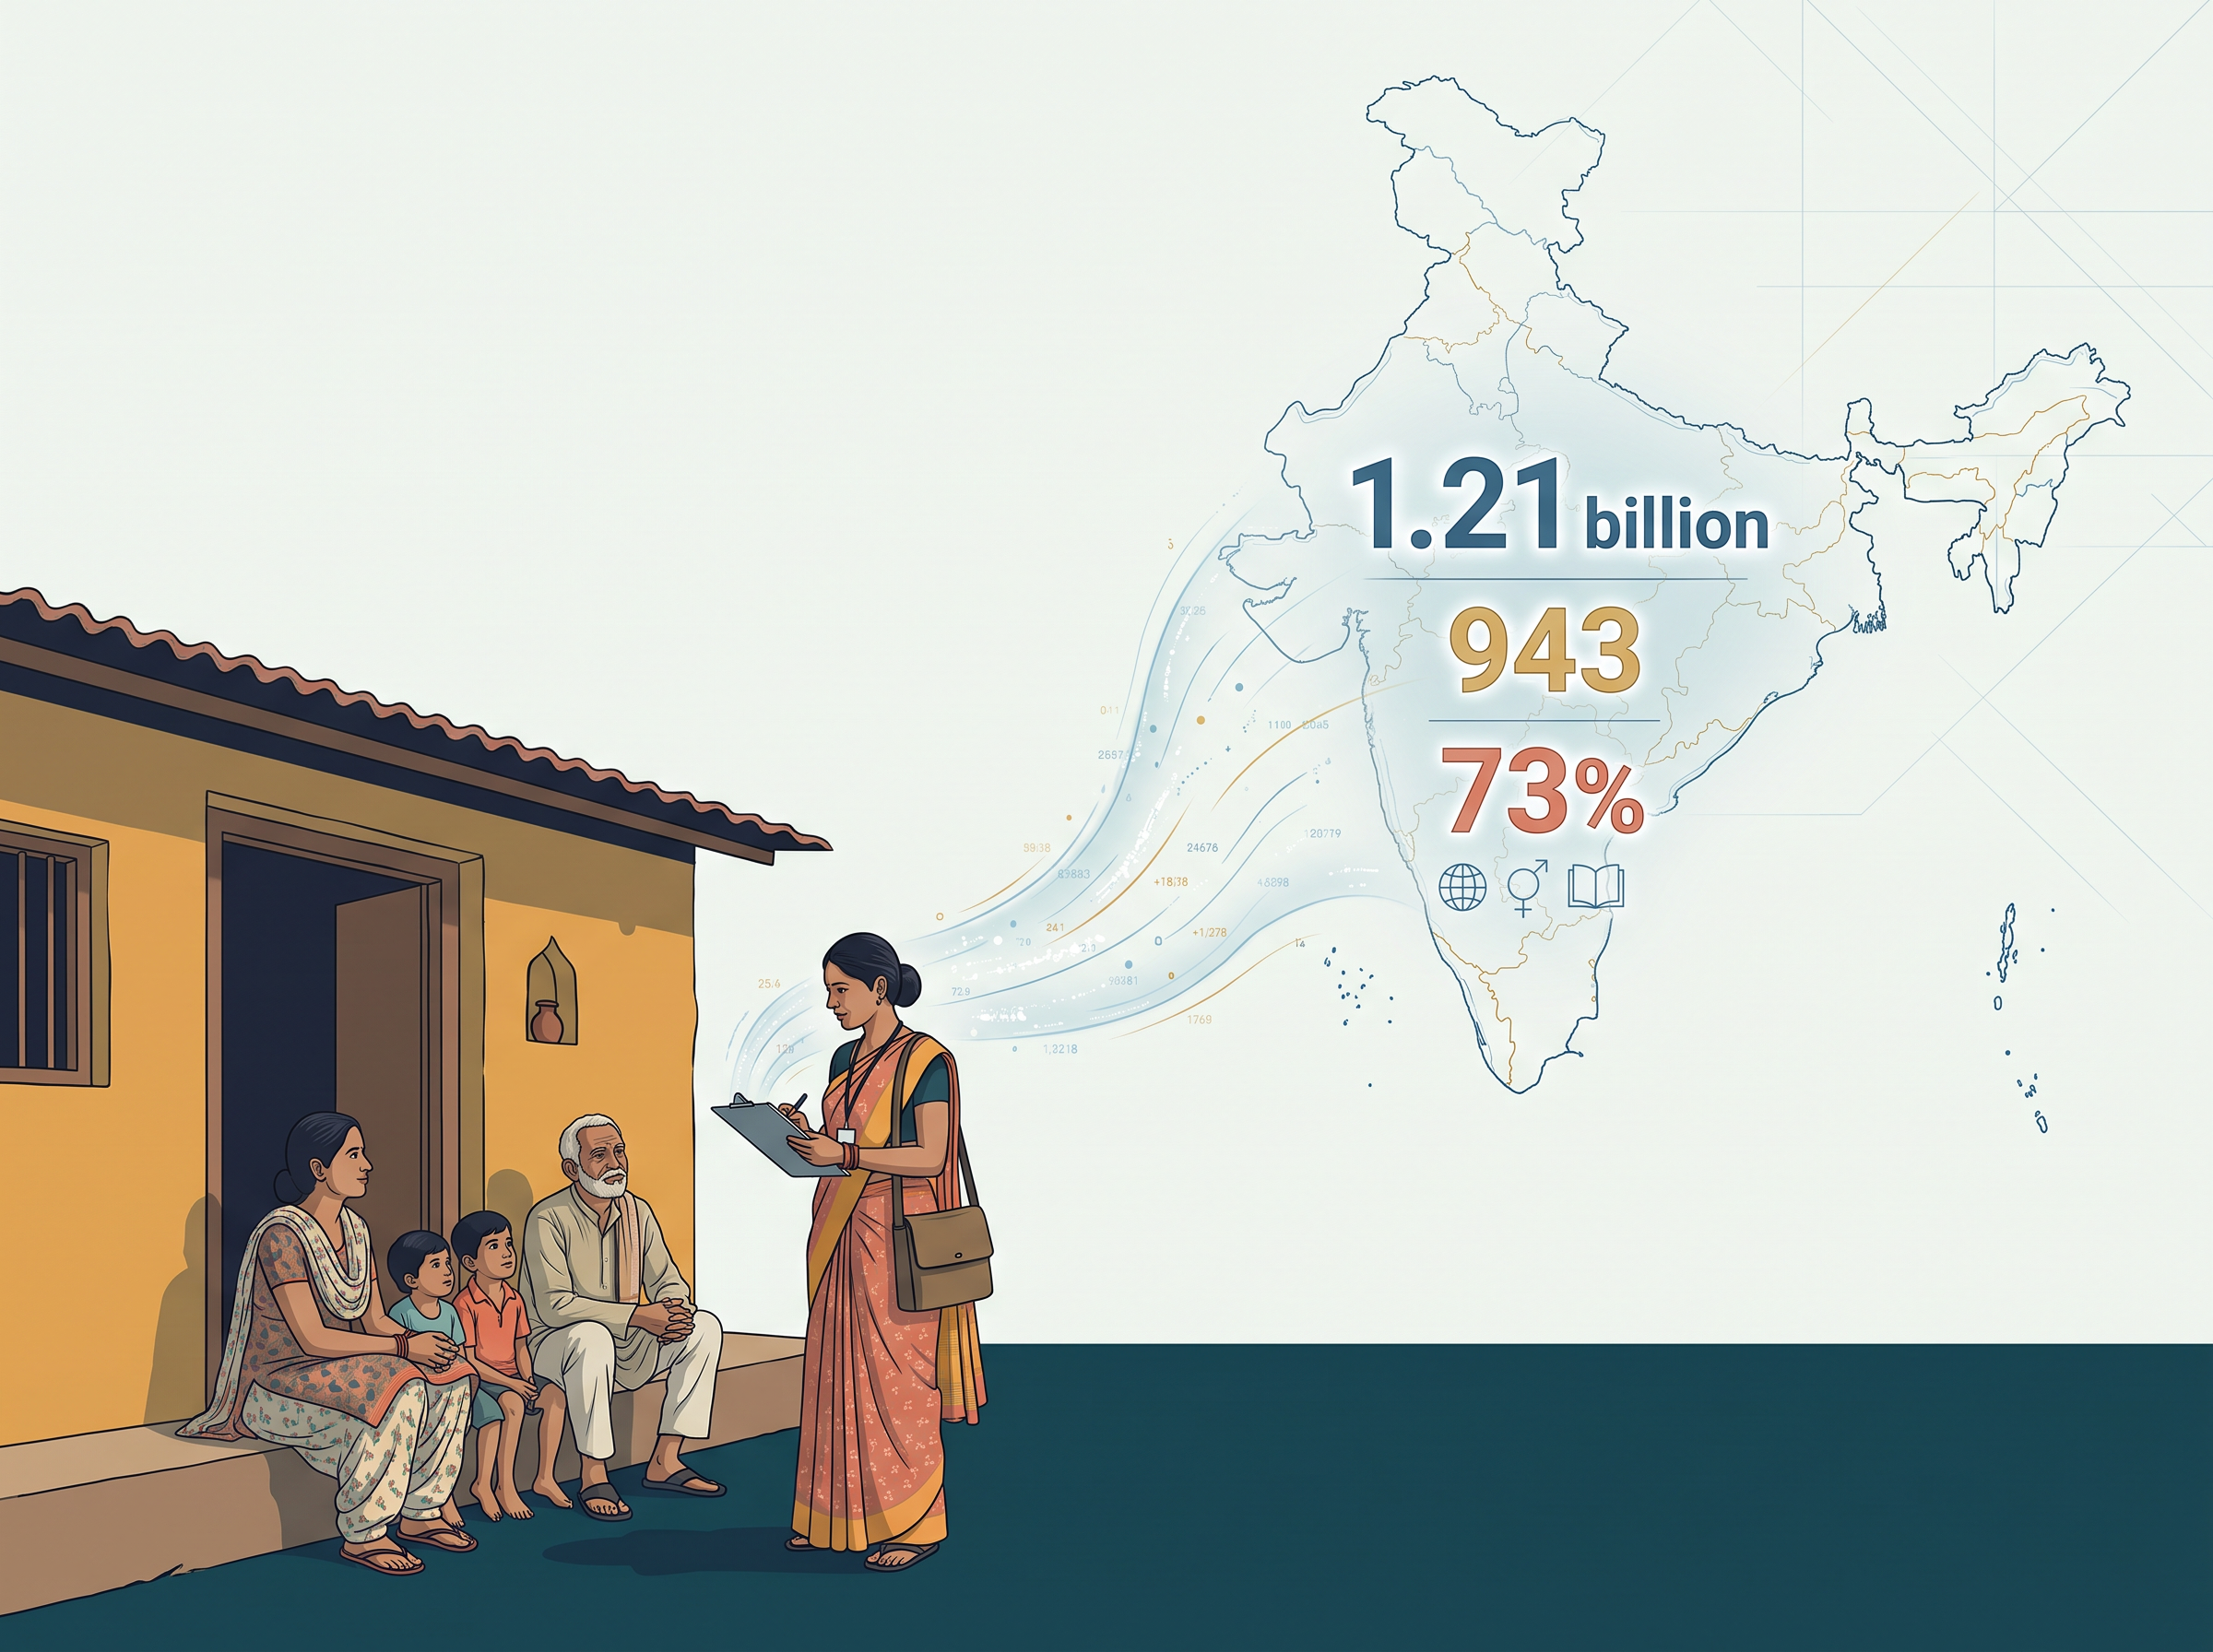
Fig. 2.1 – The census and aggregate statistics.
This chapter will answer each of these questions.
2.1 Some Theories and Concepts in Demography
What Demography Studies
Every society, at every moment, is being quietly rebuilt. Children are born, old people die, families move from a village to a city, a couple decides that two children are enough. None of these events is remarkable on its own. Added together, across millions of households, they decide how many people a country has, how old they are, whether it has more men or more women, and where they live.
The systematic study of population is called demography. The word comes from two Greek words — demos, meaning people, and graphein, meaning to describe. Demography is, quite literally, the description of a people.
Notice how wide that description is. Demography is not only interested in how many people there are. It also asks how they are distributed: how many are children, how many are old, how many are women, how many live in towns. Size is one question; composition is another, and often the more interesting one for a sociologist.
Demography has two main varieties. Formal demography is largely a quantitative field: it counts, measures and calculates. Social demography turns to the social, economic or political aspects of populations — it asks what social arrangements produce a particular pattern of births or deaths, and what such a pattern does to a society in turn.
Whichever variety it is, all demographic study rests on counting. Every demographic finding is finally based on a process of enumeration — a census or a survey — that systematically collects data on the people living within a specified territory. Without the counting, there is no demography.
Why the State Began Counting
Counting people on this scale is expensive, slow and difficult. Why would anyone do it? The answer lies in the history of the modern state.
In the latter half of the eighteenth century, two developments happened in Europe at roughly the same time. Nation-states became the principal form of political organisation, and the modern science of statistics began. These two events were connected.
The modern state had begun to expand its role and its functions. It was no longer content simply to collect taxes and fight wars. It had begun to take an active interest in early forms of public health management; in policing and the maintenance of law and order; in economic policies relating to agriculture and industry; in taxation and revenue generation; and in the governance of cities.
A state that wants to control an epidemic must know how many people live where. A state that wants to plan a city must know how fast that city is growing. This constantly expanding sphere of state activity required the systematic and regular collection of social statistics — quantitative data on various aspects of the population and the economy.
States had gathered such information in some form for a very long time. What was new was its scale and regularity: the practice acquired its modern form towards the end of the eighteenth century. The American census of 1790 was probably the first modern census, and the practice was soon taken up in Europe as well in the early 1800s.
The Census in India
India’s own experience follows this pattern, though it begins under colonial rule. Censuses began to be conducted by the British Indian government between 1867–72, and regular ten-yearly — that is, decennial — censuses have been conducted since 1881.
Independent India continued the practice. Seven decennial censuses have been conducted since 1951, the most recent being in 2011. The Indian census is the largest such exercise in the world, since China, which has a slightly larger population, does not conduct regular censuses.
Demographic data of this kind are important for the planning and implementation of state policies, especially those meant for economic development and general public welfare. A government that does not know how many children will need schools in ten years cannot build them in time.
Why Sociology Needed Demography
Here is a point that is easy to read past. The emergence of sociology, and its successful establishment as an academic discipline, owed a great deal to demography.
When social statistics first emerged, they provided a strong justification for the new discipline. They did so through what are called aggregate statistics — the numerical characteristics that refer to a large collectivity consisting of millions of people.
Consider the death rate: the number of deaths per 1,000 population. Every death that goes into it is a private grief in a particular family, with its own particular cause — an illness, an accident, old age. The death rate is made up by aggregating, or adding up, these individual deaths.
And yet the death rate itself is not a private fact. It stays remarkably steady from year to year. It is higher in one district than in another. It rises when a famine comes. It is, in short, a social phenomenon, and it must be explained at the social level. That is what aggregate statistics demonstrate: patterns that no individual intends, and that no individual biography can explain.
Emile Durkheim’s famous study of suicide is the classic example of exactly this argument. Suicide looks like the most private act imaginable. Durkheim showed that its rate is nevertheless patterned, and that the pattern demands a social explanation.
Formal Demography and Population Studies
You have already met the distinction between formal demography and social demography. It is worth stating more carefully, because a distinction is sometimes drawn between formal demography and a broader field of population studies.
Formal demography is primarily concerned with the measurement and analysis of the components of population change — births, deaths, migration. Its focus is on quantitative analysis, for which it has a highly developed mathematical methodology suitable for forecasting population growth and changes in the composition of population.
Population studies, or social demography, enquires instead into the wider causes and consequences of population structures and change. Social demographers believe that social processes and structures regulate demographic processes. Like sociologists, they seek to trace the social reasons that account for population trends.
The difference is not that one uses numbers and the other does not. Both use numbers. The difference is in the question. Formal demography asks what is happening to the population, and how fast? Social demography asks why is it happening, and what will it do to society?
2.1.1 The Malthusian Theory of Population Growth
Among the most famous theories of demography is the one associated with the English political economist Thomas Robert Malthus (1766–1834). His theory of population growth was outlined in his Essay on Population (1798), and it was a rather pessimistic one.
Malthus’s argument begins with a comparison of two rates of growth. Human populations, he argued, tend to grow at a much faster rate than the rate at which the means of human subsistence can grow. By subsistence he meant especially food, but also clothing and other agriculture-based products.
He put the contrast in mathematical form. Population rises in geometric progression — that is, like 2, 4, 8, 16, 32, and so on, each figure doubling the last. Agricultural production can only grow in arithmetic progression — like 2, 4, 6, 8, 10, adding the same quantity each time. Set these two side by side and the outcome is only a matter of time: the second can never keep up with the first.
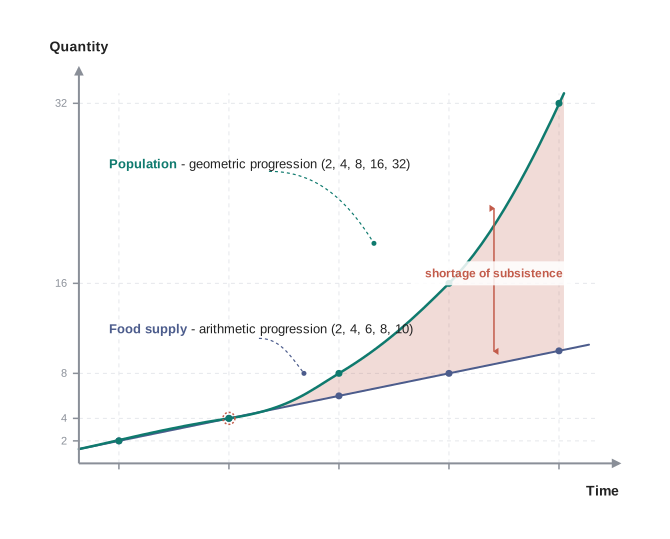
Fig. 2.2 – The Malthusian theory of population growth.
The conclusion follows harshly. Because the growth of agricultural production will always be overtaken by population growth, humanity is condemned to live in poverty forever. And since population growth always outstrips growth in the production of subsistence resources, the only way to increase prosperity is by controlling the growth of population.
Two Kinds of Check
How, then, is population to be controlled? Malthus saw two ways, and he had little faith in the first.
The first he called preventive checks — the deliberate, voluntary limiting of births, through such means as postponing marriage or practising sexual abstinence or celibacy. Unfortunately, he thought, humanity has only a limited ability to reduce the growth of its population in this voluntary way.
The second he called positive checks — famines and diseases. These were not chosen by anyone. Malthus believed they were inevitable, because they were nature’s way of dealing with the imbalance between food supply and increasing population. When people would not restrain births, hunger and epidemic would restrain numbers instead.
Why Malthus Was Proved Wrong
Malthus’s theory was influential for a long time. It was also challenged, and in the end it was defeated — first by argument, and then by history.
The argument came from theorists who claimed that economic growth could outstrip population growth. If output can be made to rise faster than numbers, the whole gloomy arithmetic collapses.
The most effective refutation of his theory, however, was provided by the historical experience of European countries themselves. The pattern of population growth began to change in the latter half of the nineteenth century, and by the end of the first quarter of the twentieth century these changes were quite dramatic. Birth rates had declined. Outbreaks of epidemic diseases were being controlled.
In other words, both of Malthus’s checks failed him. Births fell without famine forcing them down, and the diseases he had counted on as nature’s corrective were being defeated by medicine and public health. Malthus’s predictions were proved false, because both food production and standards of living continued to rise despite the rapid growth of population.
The Critics’ Answer: Distribution, Not Numbers
There was a second, and deeper, line of criticism. Malthus was criticised by liberal and Marxist scholars for asserting that poverty was caused by population growth.
The critics argued that problems like poverty and starvation were caused by the unequal distribution of economic resources rather than by population growth. An unjust social system allowed a wealthy and privileged minority to live in luxury while the vast majority of the people were forced to live in poverty.
The difference between the two positions is not a technical quarrel. It decides where a society looks for a solution. If numbers are the problem, the answer is birth control. If distribution is the problem, the answer is the reform of an unjust social system. This is the point at which demography becomes unavoidably sociological.
2.1.2 The Theory of Demographic Transition
If Malthus’s theory says that population growth is a permanent danger, the theory of demographic transition says something quite different: that rapid population growth is a phase, and that societies pass through it and come out the other side.
The theory suggests that population growth is linked to overall levels of economic development, and that every society follows a typical pattern of development-related population growth. It sets out three basic stages.
The Three Stages
The first stage is one of low population growth, in a society that is underdeveloped and technologically backward. Growth rates are low — but not because few children are born. They are low because both the death rate and the birth rate are very high, so that the difference between the two, which is the net growth rate, is small.
The third and last stage is also one of low growth, but for the opposite reason. This is a developed society in which both the death rate and the birth rate have been reduced considerably, and the difference between them is again small.
Between these two stages lies the second, transitional stage — the movement from a backward to an advanced stage. This is the stage that matters, and it is characterised by very high rates of growth of population.
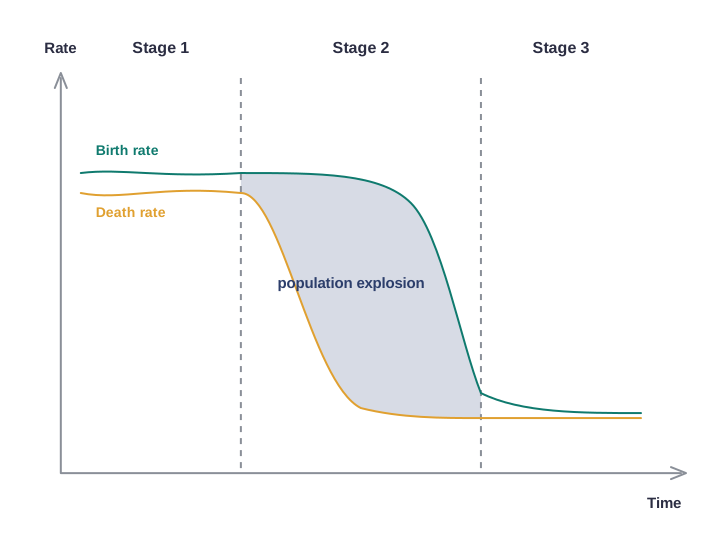
Fig. 2.3 – The three stages of demographic transition.
Why the Explosion Happens
Why should the two rates fall at different speeds? The answer takes us straight from medicine to culture.
Death rates are brought down relatively quickly, through advanced methods of disease control, public health and better nutrition. A vaccination campaign, a clean water supply, an antibiotic — these can be introduced by the state within a few years, and they save lives immediately. Dying less is something people accept at once.
Birth rates behave quite differently. It takes longer for a society to adjust to change and to alter its reproductive behaviour. That behaviour evolved during a period of poverty and high death rates, when a family that wanted surviving children had good reason to have many. It does not change simply because the situation has changed to one of relative prosperity and longer life spans.
The result is the gap — and the gap is the ‘population explosion’. It is not caused by people suddenly having more children. It is caused by more of the children they were already having surviving to adulthood, while the old reasoning about family size takes a generation or more to catch up.
This kind of transition was effected in Western Europe during the late nineteenth and early twentieth century. More or less similar patterns are followed in the less developed countries that are struggling to reduce the birth rate in keeping with the falling mortality rate.
2.1.3 Common Concepts and Indicators
Demography speaks in rates and ratios, and a student who cannot read them cannot read the subject. The good news is that they are all built the same way.
Most demographic concepts involve two numbers. One of these numbers is the particular statistic that has been calculated for a specific geographical-administrative unit — a country, a state, a district. The other number provides a standard for comparison, so that units of different sizes can be compared at all. It is meaningless to say that one state had 40,000 births last year and another had 90,000, unless you also know how many people live in each.
The Birth Rate and the Death Rate
The birth rate is the total number of live births in a particular area — an entire country, a state, a district or other territorial unit — during a specified period, usually a year, divided by the total population of that area in thousands. In plainer words, it is the number of live births per 1000 population.
\[\text{Birth rate} = \frac{\text{Number of live births in a year}}{\text{Total population}} \times 1000\]
The death rate is a similar statistic, expressed as the number of deaths in a given area during a given time per 1000 population.
\[\text{Death rate} = \frac{\text{Number of deaths in a year}}{\text{Total population}} \times 1000\]
Both statistics depend on something that is easy to overlook: the reporting of births and deaths by the families in which they occur. A birth that no one registers does not enter the birth rate. The quality of a demographic figure can never be better than the quality of the reporting that produced it.
Growth Rate and Replacement Level
The rate of natural increase, or the growth rate of population, refers to the difference between the birth rate and the death rate.
\[\text{Rate of natural increase} = \text{Birth rate} - \text{Death rate}\]
This single subtraction explains a great deal. A society with a very high birth rate need not be growing fast, if its death rate is equally high — which is exactly the first stage of the demographic transition.
When this difference is zero, or in practice very small, we say that the population has ‘stabilised’, or has reached the replacement level. This is the rate of growth required for new generations to replace the older ones that are dying out — no more and no less.
Sometimes societies can experience a negative growth rate, that is, their fertility levels are below the replacement rate. This is true of many countries and regions in the world today, such as Japan, Russia, Italy and Eastern Europe. Their populations are not merely growing slowly; they are shrinking.
Fertility, and the Limits of a ‘Crude’ Rate
The fertility rate refers to the number of live births per 1000 women in the child-bearing age group, usually taken to be 15 to 49 years.
Notice the change of base. The birth rate divides by the whole population — including men, children and the elderly, none of whom can give birth. The fertility rate divides only by the women who could, which makes it a sharper measure of reproductive behaviour.
Even so, the fertility rate — like the birth and death rates — is a ‘crude’ rate. It is a rough average for an entire population, and it does not take into account the differences across age groups. Differences across age groups can sometimes be very significant in affecting the meaning of an indicator. That is why demographers also calculate age-specific rates.
Infant and Maternal Mortality
The infant mortality rate is the number of deaths of babies before the age of one year per 1000 live births.
\[\text{Infant mortality rate} = \frac{\text{Deaths of babies before the age of one year}}{\text{Number of live births}} \times 1000\]
The maternal mortality rate is the number of women who die in childbirth per 1,00,000 live births. Note the different base: deaths in childbirth are rare enough that a base of 1000 would produce very small numbers, so the rate is expressed per lakh of live births.
High rates of infant and maternal mortality are an unambiguous indicator of backwardness and poverty. They tell you, more directly than an income figure does, how a society treats its most vulnerable members. Development is accompanied by sharp falls in these rates, as medical facilities and levels of education, awareness and prosperity increase.
Life Expectancy
One concept which is somewhat complicated is that of life expectancy. It refers to the estimated number of years that an average person is expected to survive.
The word ‘estimated’ matters. Life expectancy is not a prediction about any individual, and it is not read off from the ages at which people are currently dying. It is calculated on the basis of data on age-specific death rates in a given area over a period of time — that is, from the risk of dying at each age.
The Sex Ratio
The sex ratio refers to the number of females per 1000 males in a given area at a specified time period.
\[\text{Sex ratio} = \frac{\text{Number of females}}{\text{Number of males}} \times 1000\]
Historically, all over the world, it has been found that there are slightly more females than males in most countries. This is a surprising finding, because it happens despite the fact that slightly more male babies are born than female ones: nature seems to produce roughly 943 to 952 female babies for every 1000 males.
If, despite this fact, the sex ratio is somewhat in favour of females, this seems to be due to two reasons. First, girl babies appear to have an advantage over boy babies in terms of resistance to disease in infancy — fewer of them die. Second, at the other end of the life cycle, women have tended to outlive men in most societies, so that there are more older women than men.
The combination of these two factors leads to a sex ratio of roughly 1050 females per 1000 males in most contexts. That figure is worth holding on to, because it is the yardstick against which India’s own figures will be read later in this chapter.
However, it has been found that the sex ratio has been declining in some countries like China, South Korea and especially India. This is not what nature does; it is what societies do. The phenomenon has been linked to prevailing social norms that tend to value males much more than females, which leads to ‘son preference’ and the relative neglect of girl babies.
The Age Structure of the Population
The age structure of the population refers to the proportion of persons in different age groups relative to the total population.
The age structure is not fixed. It changes in response to changes in levels of development and in the average life expectancy — which means that a society’s age profile is itself a record of its history.
Initially, poor medical facilities, the prevalence of disease and other factors make for a relatively short life span. Moreover, high infant and maternal mortality rates also have an impact on the age structure, because they remove people at the very beginning of life.
With development, the quality of life improves, and with it life expectancy also improves. This changes the age structure: relatively smaller proportions of the population are found in the younger age groups, and larger proportions in the older age groups. This is also referred to as the ageing of the population.
The Dependency Ratio
Some people in a population work; others depend on those who do. The dependency ratio is a measure comparing the portion of a population which is composed of dependents — elderly people who are too old to work, and children who are too young to work — with the portion that is in the working age group, generally defined as 15 to 64 years.
\[\text{Dependency ratio} = \frac{\text{Population below 15} + \text{Population above 64}}{\text{Population in the 15–64 age group}} \times 100\]
The ratio is usually expressed as a percentage.
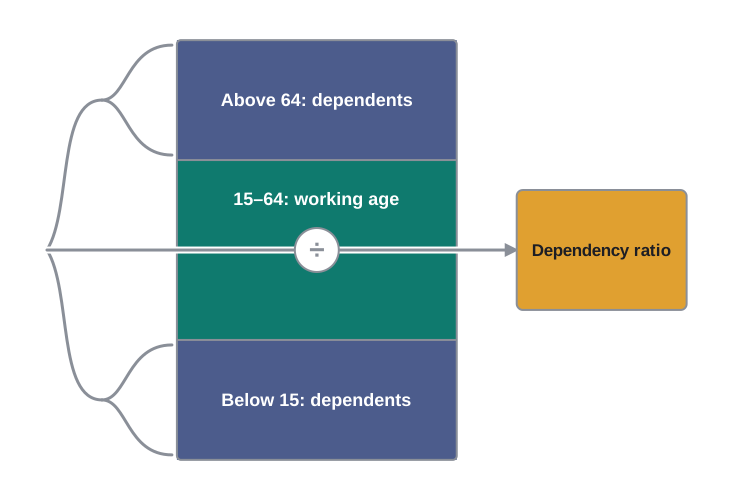
Fig. 2.4 – Age groups and the dependency ratio.
A rising dependency ratio is a cause for worry in countries that are facing an ageing population. It becomes difficult for a relatively smaller proportion of working-age people to carry the burden of providing for a relatively larger proportion of dependents.
A falling dependency ratio, on the other hand, can be a source of economic growth and prosperity, because of the larger proportion of workers relative to non-workers. This is sometimes referred to as the demographic dividend, or the benefit flowing from the changing age structure.
But the word ‘dividend’ should not mislead you. This benefit is temporary, because the larger pool of working-age people will eventually turn into non-working old people. A society that has this advantage has it only for a while — and what it does with that while is a question this chapter returns to.
2.2 Size and Growth of India’s Population
India is the second most populous country in the world after China, with a total population of 121 crores — that is, 1.21 billion — according to the Census of India 2011.
A number that large tends to be read as a permanent condition, as though India had always been growing fast and always will. The record says otherwise. As can be seen from Table 2.1, the growth rate of India’s population has not always been very high.
Source: website: http://ayush.gov.in
Reading the Growth Table
Run your eye down the third column. Between 1901 and 1951 the average annual growth rate did not exceed 1.33 per cent — a modest rate of growth. In half a century, the population rose only from 238 million to 361 million.
One decade in that first half-century is extraordinary. Between 1911 and 1921 there was a negative rate of growth of –0.03 per cent: the population actually fell, from 252 million to 251 million. India had fewer people at the end of that decade than at the beginning.
The cause was the influenza epidemic during 1918–19, which killed about 12.5 million persons, or 5 per cent of the total population of the country (Visaria and Visaria 2003: 191). A single outbreak of disease was powerful enough to erase ten years of population growth.
The picture changes after Independence. The growth rate of population substantially increased after independence from British rule, going up to 2.2 per cent during 1961–1981 — the fastest India has ever grown. Since then the annual growth rate has decreased, falling to 1.63 per cent by 2011, but it remains one of the highest in the developing world.
The Two Rates Begin to Separate
Behind those growth figures lie the two rates you met in the previous section. Fig. 2.5 shows the comparative movement of the crude birth and death rates across the twentieth century, and it is the single most important graph in this chapter.
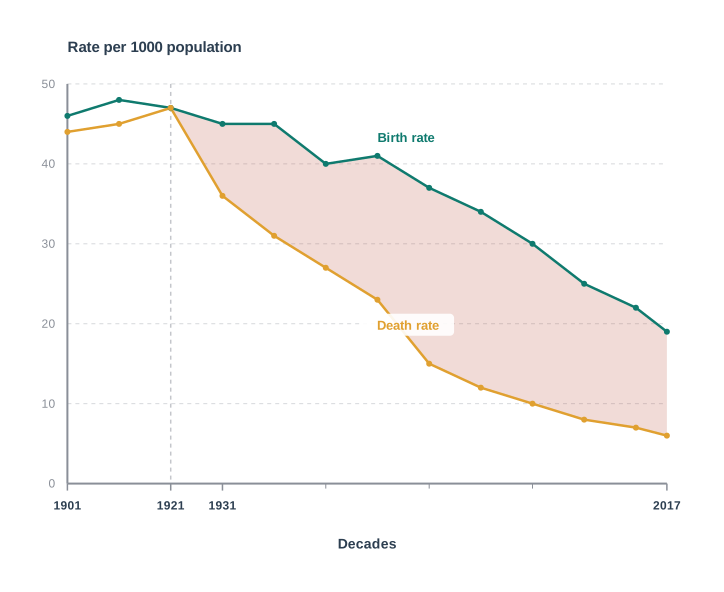
Fig. 2.5 – Birth and death rates in India, 1901–2017.
The impact of the demographic transition phase is clearly seen in the graph, where the two lines begin to diverge from each other after the decade of 1921 to 1931. Before 1931, both death rates and birth rates were high. After this transitional moment the death rates fell sharply, but the birth rate only fell slightly.
That widening gap is India’s population growth. Nothing in the graph shows Indians suddenly having more children; what it shows is Indians dying less.
Why the Death Rate Fell
The principal reasons for the decline in the death rate after 1921 were increased levels of control over famines and epidemic diseases. Of the two, the latter cause was perhaps the most important.
The major epidemic diseases in the past were fevers of various sorts, plague, smallpox and cholera. But the single biggest epidemic was the influenza epidemic of 1918–19, which killed as many as 170 lakh people, or about 5 per cent of the total population of India at that time. Estimates of deaths vary, and some are much higher.
Also known as the ‘Spanish Flu’, the influenza outbreak was not India’s alone. It was a pandemic — an epidemic that affects a very wide geographical area.
Medicine, Sanitation and What Remains
Improvements in medical cures for these diseases, programmes for mass vaccination, and efforts to improve sanitation all helped to control epidemics. This is why the death rate fell as fast as it did: the causes of mass death were being attacked directly.
The victory is real but not complete. Diseases like malaria, tuberculosis, diarrhoea and dysentery continue to kill people even today, although the numbers are nowhere as high as they used to be in the epidemics of the past. Surat witnessed a small epidemic of plague in September 1994, and dengue and chikungunya epidemics have since been reported in various parts of the country.
Why Famines Receded
Famines were also a major and recurring source of increased mortality. They were caused by high levels of continuing poverty and malnutrition in an agroclimatic environment that was very vulnerable to variations in rainfall — a failed monsoon could empty a region’s granaries. Lack of adequate means of transportation and communication, as well as inadequate efforts on the part of the state, were among the factors responsible.
That, however, is not the whole explanation, and here demography hands the question over to social science. As scholars like Amartya Sen and others have shown, famines were not necessarily due to a fall in foodgrains production. They were also caused by a ‘failure of entitlements’ — the inability of people to buy or otherwise obtain food.
The distinction is a sharp one. A famine can occur in a region where food is physically present in the market, if the people who need it have lost the wages, the work or the exchangeable assets with which food is obtained. Hunger, on this account, is a question of access, not merely of harvest.
Substantial improvements in the productivity of Indian agriculture, especially through the expansion of irrigation; improved means of communication; and more vigorous relief and preventive measures by the state have all helped to drastically reduce deaths from famine. Nevertheless, starvation deaths are still reported from some regions of the country.
Why the Birth Rate Did Not Fall as Fast
Unlike the death rate, the birth rate has not registered a sharp fall. This is because the birth rate is a sociocultural phenomenon that is relatively slow to change.
A vaccination can be given to a village in a week. The decision about how many children to have is not taken by the state at all. It is taken inside households, on the basis of what people believe about security in old age, about the survival of infants, about work, land, dowry and the standing of a family. Beliefs of this kind change over a generation, not over a season.
By and large, increased levels of prosperity exert a strong downward pull on the birth rate. Once infant mortality rates decline — so that parents can expect the children they have to survive — and once there is an overall increase in the levels of education and awareness, family size begins to fall.
Fertility Varies Sharply Across States
‘India’s birth rate’ is a national average, and a national average can hide more than it reveals. There are very wide variations in fertility rates across the States of India.
Some states — Andhra Pradesh, Himachal Pradesh, Punjab, Tamil Nadu and West Bengal — have managed to bring down their total fertility rate (TFR) to 1.7 each (2016). This means that the average woman in these states produces only 1.7 children, which is below the ‘replacement level’. Kerala’s TFR is also below the replacement level, which means that its population is going to decline in future.
But there are some states, notably Bihar, Madhya Pradesh, Rajasthan and Uttar Pradesh, which still have very high TFRs. In 2016, the TFRs of these states were 3.3, 2.8, 2.7 and 3.1 respectively.
According to the Sample Registration System, Statistical Report 2020, India’s crude birth rate was 19.5. The rural birth rate was 21.1 and the urban birth rate was 16.1 — a reminder that the rural–urban difference cuts across the state-level one. As per these statistics, Bihar with 25.5 and Uttar Pradesh with 25.1 account for the highest birth rate in India.
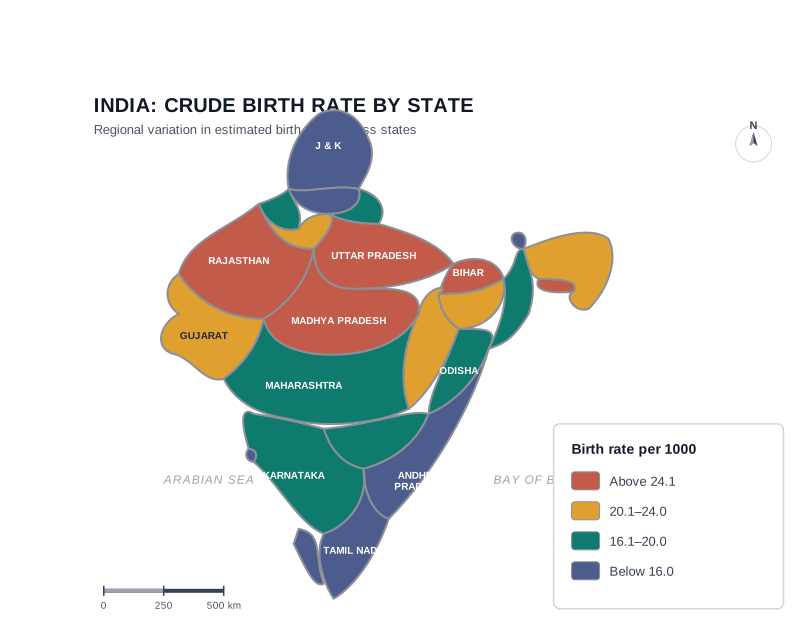
Fig. 2.6 – State-wise birth rates in India, 2020.
Where India’s Future Growth Will Come From
Because fertility differs so much between states, future population growth will not be spread evenly across the country. As per the Economic Survey 2018-19, Bihar and Uttar Pradesh will account for almost half — 50 per cent — of the additions to the Indian population up to the year 2041. Uttar Pradesh alone is expected to account for a little less than one-quarter, or 22 per cent, of this increase.
Fig. 2.7 shows the relative contribution to population growth from different regional groupings of States. Notice how large the Uttar Pradesh and Bihar slice is, at 28 per cent, and how small the Punjab, Haryana and Delhi slice is, at 5 per cent.
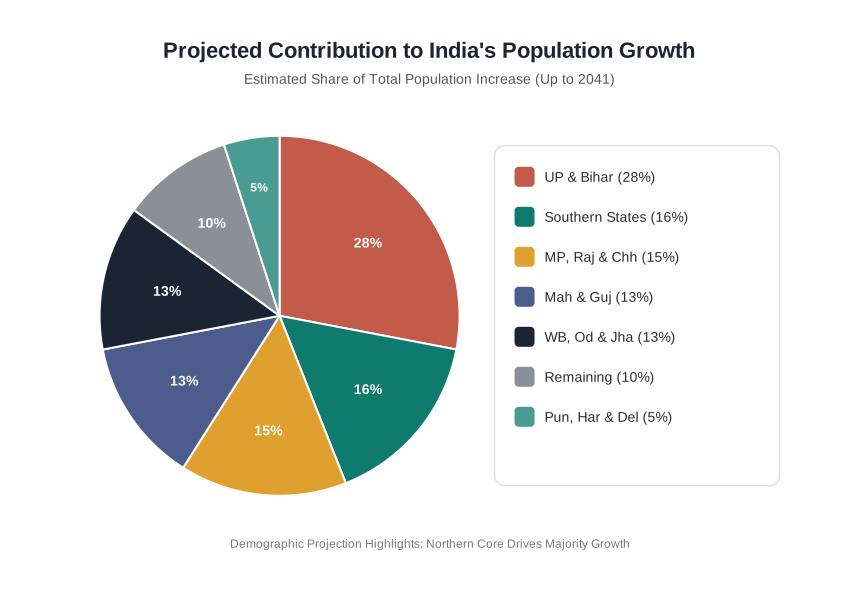
Fig. 2.7 – Regional shares of projected population growth up to 2041.
Read the chart sociologically and it says something more than arithmetic. The states that are adding the most people are, broadly, the states where fertility has fallen least — and fertility falls where infant mortality is low, where education, especially of women, has spread, and where prosperity has risen. India’s demographic future is therefore not one future but several, unfolding at different speeds in different parts of the same country.
2.3 Age Structure of the Indian Population
India has a very young population. That is, the majority of Indians tend to be young, and the average age is also less than that for most other countries. Walk through any Indian bus stand or market and the impression is confirmed; the census puts a figure on it.
What the Age Table Shows
Table 2.2 sets out the age composition of the Indian population from 1961 onwards, with a projection for 2026. Each row divides the whole population into three age groups, and shows what percentage of the total each group holds.
Age group columns show percentage shares; rows may not add up to 100 because of rounding. Source: Based on data from the Technical Group on Population Projections (1996 and 2006) of the National Commission on Population.
Read the first column downwards. The share of the under-15 age group in the total population has come down from its highest level of 42 per cent in 1971 to 29 per cent in 2011. Four Indians in ten were children in 1971; by 2011 fewer than three in ten were.
The middle column moves the other way. The share of the 15–59 age group has increased slightly, from 53 per cent to 63 per cent over the same period. The share of the 60-plus age group is very small, but it has begun to increase, from 5 per cent to 7 per cent.
The most important line in the table, however, is the last one — because it has not happened yet. The age composition of the Indian population is expected to change significantly in the next two decades, and most of this change will be at the two ends of the age spectrum.
As Table 2.2 shows, the 0–14 age group will reduce its share by about 11 per cent, from 34 per cent in 2001 to 23 per cent in 2026. Over the same years the 60-plus age group will increase its share by about 5 per cent, from 7 per cent in 2001 to about 12 per cent in 2026. India is losing children at one end and gaining old people at the other, while the middle swells.
Reading a Population Pyramid
The same information can be drawn rather than tabulated, and drawing it makes the change visible at a glance. Fig. 2.8 shows a graphical picture of the population pyramid from 1961 to its projected shape in 2026.
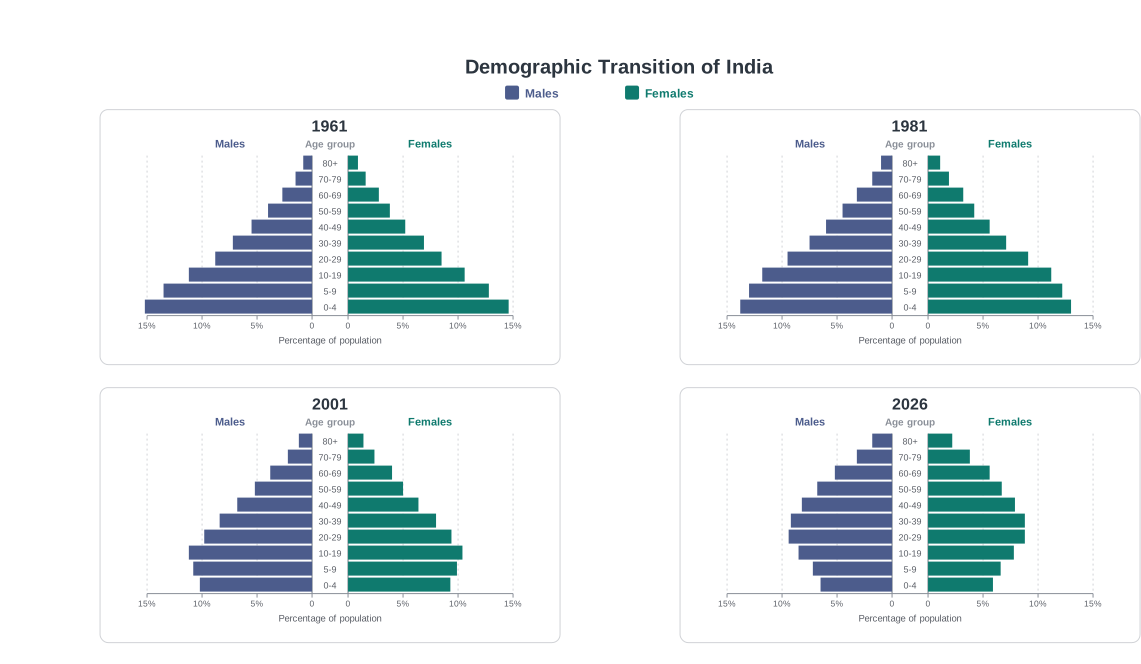
Fig. 2.8 – India’s changing population pyramid, 1961–2026.
The pyramid gives a much more detailed version of the kind of age-grouped data presented in Table 2.2. Data are shown separately for males, on the left side, and females, on the right side, with the relevant five-year age group in the middle. Looking at the horizontal bars — which include both males and females in a particular age group — gives you a visual sense of the age structure of the population. The age groups begin from the 0–4 years group at the bottom of the pyramid and go on to the 80 years and above age group at the top.
There are four different pyramids here: for the decennial census years of 1961, 1981 and 2001, and the estimates for 2026. The pyramid for 2026 shows the estimated future size of the relevant age groups, based on data on the past rates of growth of each age group. Such estimates are also called projections.
What the Changing Shape Means
These pyramids show you the effect of two things happening together: a gradual fall in the birth rate, and a rise in life expectancy.
As more and more people begin to live to an older age, the top of the pyramid grows wider. As relatively fewer new births take place, the bottom of the pyramid grows narrower. But the birth rate is slow to fall — a point established earlier in this chapter — so the bottom does not change much between 1961 and 1981.
Meanwhile the middle of the pyramid grows wider and wider as its share of the total population increases. This creates a ‘bulge’ in the middle age groups that is clearly visible in the pyramid for 2026. That bulge has a name, and it is the subject of the rest of this section: the demographic dividend.
The Same Country, Different Age Structures
As with fertility rates, there are wide regional variations in the age structure as well.
A state like Kerala is beginning to acquire an age structure like that of the developed countries — a narrower base, a heavier top. Uttar Pradesh presents a very different picture, with high proportions in the younger age groups and relatively low proportions among the aged.
India as a whole is somewhere in the middle, because it includes states like Uttar Pradesh as well as states that are more like Kerala. The national age structure is an average of two very different demographic worlds inside one country.
Fig. 2.9 shows the estimated population pyramids for Uttar Pradesh and Kerala in the year 2026. Note the difference in the location of the widest parts of the pyramid for the two states.
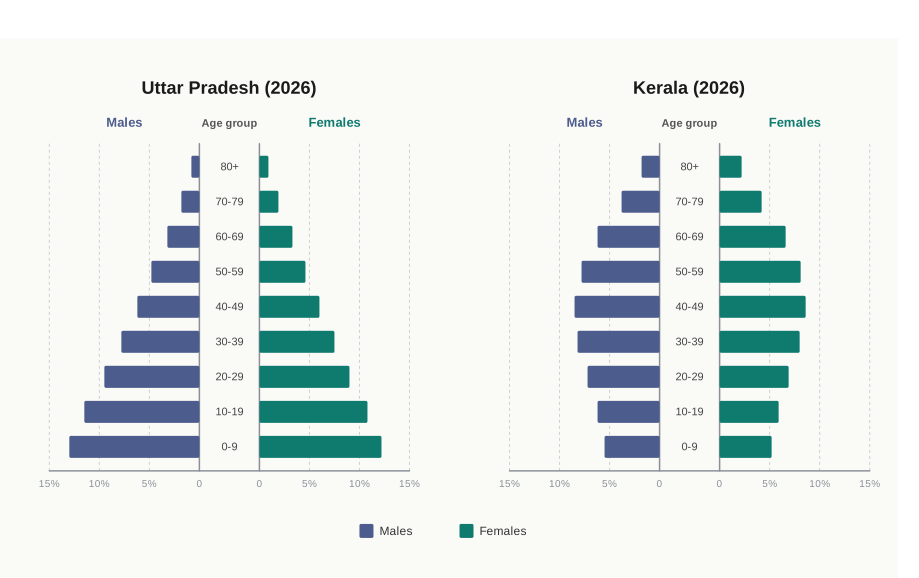
Fig. 2.9 – Projected population pyramids for Uttar Pradesh and Kerala, 2026.
The practical consequences differ accordingly. A state whose pyramid is widest at the bottom must build schools and create jobs for entrants to the labour force. A state whose pyramid is widest in the middle and thickening at the top must think instead about pensions, health care and the care of the elderly. The same national policy will not fit both.
The Demographic Dividend
The bias towards younger age groups in the age structure is believed to be an advantage for India. Like the East Asian economies in the past decade, and like Ireland today, India is supposed to be benefitting from a ‘demographic dividend’.
The reasoning is the one set out earlier through the dependency ratio. This dividend arises from the fact that the current generation of working-age people is a relatively large one, and it has only a relatively small preceding generation of old people to support. More earners, fewer dependents to feed — and therefore more that a society can save, invest and grow with.
But there is nothing automatic about this advantage. It needs to be consciously exploited through appropriate policies.
The Difference Between Being of Working Age and Working
That last point in the box deserves to be pulled into the open, because it is the hinge of the whole argument.
The dependency ratio counts ages, not jobs. A person of 22 who has never found work is counted, by the ratio, as part of the productive population. In the household where she actually lives, she is a dependent. The ratio therefore records a promise; it does not record whether the promise was kept.
What decides whether the promise is kept is employment — and here the evidence is uncomfortable.
2.4 The Declining Sex-ratio in India
The sex ratio is an important indicator of gender balance in the population. It is one of those rare figures that can be read almost as a moral statement about a society: it tells you, without any commentary, whether a country is losing its women.
As you saw in the section on concepts, historically the sex ratio has been slightly in favour of females — that is, the number of females per 1000 males has generally been somewhat higher than 1000. That is what biology, left to itself, produces.
India has moved the other way. It has had a declining sex ratio for more than a century, as is clear from Table 2.3.
Note: The sex ratio is defined as the number of females per 1000 males; data on age-specific sex ratios is not available before 1961. Source: Census of India 2011, Government of India.
A Century of Decline
From 972 females per 1000 males at the turn of the twentieth century, the sex ratio declined to 933 at the turn of the twenty-first century. Over a hundred years, and across every kind of political and economic change, the figure moved steadily in one direction.
The trends of the last four decades have been particularly worrying. From 941 in 1961 the sex ratio fell to an all-time low of 927 in 1991, before posting a modest increase in 2001. According to the Census of India 2011, the sex ratio has increased, and now stands at 943 females per 1000 males.
Compare that with the figure of roughly 1050 females per 1000 males found in most contexts, which you met earlier in this chapter. India’s women are not merely fewer than its men; they are far fewer than they would be if girls and women lived out the ordinary biological advantages they are born with.
The Child Sex Ratio: The Real Alarm
But what has really alarmed demographers, policy makers, social activists and concerned citizens is the drastic fall in the child sex ratio.
Age-specific sex ratios began to be computed in 1961. As Table 2.3 shows, the sex ratio for the 0–6 years age group — known as the juvenile or child sex ratio — has generally been substantially higher than the overall sex ratio for all age groups. In 1961 it stood at 976, well above the overall figure of 941. This is what one would expect, because girls are born in almost equal numbers to boys and survive infancy rather better.
Yet it has been falling very sharply. Look at the last column: –12, –2, –17, –18, –8. Decade after decade, the very youngest Indians have become more male.
The decade 1991–2001 represents an anomaly, and it is worth pausing on. The overall sex ratio posted its highest ever increase of 6 points, rising from the all-time low of 927 to 933. Over the same ten years, the child sex ratio dropped from 945 to 927 — a plunge of 18 points, taking it below the overall sex ratio for the first time.
The two figures moved in opposite directions. Adult women were surviving better; girl children were not. And in the 2011 Census the child sex ratio fell again, to 919.
The Regional Picture
The state-level child sex ratios offer even greater cause for worry. As many as nine States and Union Territories have a child sex ratio of under 900 females per 1000 males.
Haryana is the worst state, with an incredibly low child sex ratio of 793 — the only state below 800 — followed by Punjab, Jammu & Kashmir, Delhi, Chandigarh, Uttarakhand and Himachal Pradesh.
As Fig. 2.10 shows, Uttar Pradesh, Daman & Diu, Himachal Pradesh, Lakshadweep and Madhya Pradesh are all under 925, while large states such as West Bengal, Assam, Bihar, Tamil Nadu, Andhra Pradesh and Karnataka are above the national average of 919 but below the 970-mark. Even Kerala, the state with the better overall sex ratio, does not do too well at 964, while the highest child sex ratio, of 972, is found in Arunachal Pradesh.
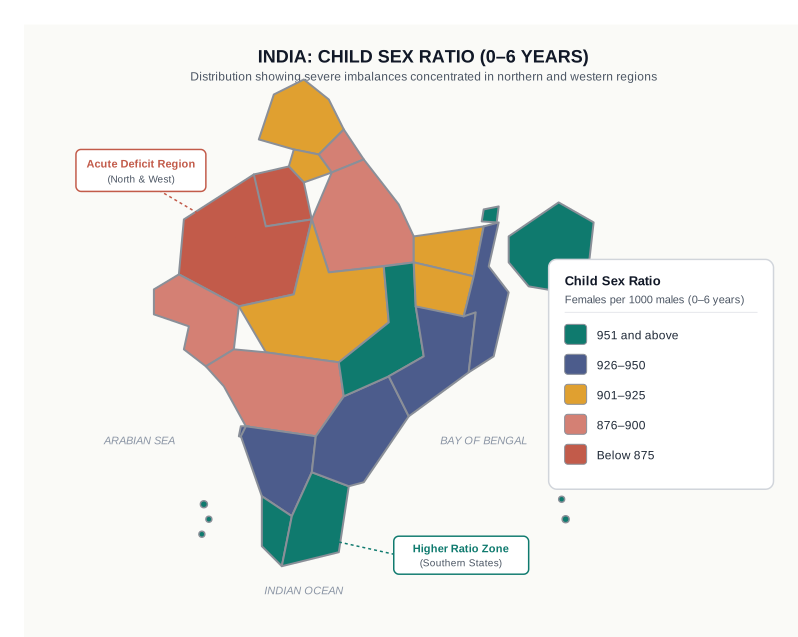
Fig. 2.10 – Child sex ratio across Indian states, 2011.
Looking for the Cause
Demographers and sociologists have offered several reasons for the decline in the sex ratio in India. Before accepting any of them, it is worth watching how an explanation is tested and then set aside — this is sociological reasoning at work.
The main health factor that affects women differently from men is childbearing. It is therefore relevant to ask whether the fall in the sex ratio may be partly due to the increased risk of death in childbirth that only women face.
The answer turns out to be no, and for a clear reason. Maternal mortality is supposed to decline with development, as levels of nutrition, general education and awareness improve, along with the availability of medical and communication facilities. Indeed, maternal mortality rates have been coming down in India, even though they remain high by international standards.
So the argument does not fit the facts. If maternal mortality is falling, it cannot explain a sex ratio that is worsening over time. Combined with the fact that the decline in the child sex ratio has been much steeper than the overall figure — and children under six do not die in childbirth — social scientists believe that the cause has to be sought in the differential treatment of girl babies.
Three Mechanisms
Several factors may be held responsible for the decline in the child sex ratio, and there is some evidence that all of them have been at work in India.
The first is the severe neglect of girl babies in infancy — less food, less medical attention, less care — leading to higher death rates among them.
The second is sex-specific abortions, which prevent girl babies from being born at all.
The third is female infanticide, or the killing of girl babies due to religious or cultural beliefs. Practices of female infanticide have been known to exist in many regions.
Each of these points to a serious social problem. But it is the second that has grown, because technology has made it easy. Increasing importance is being attached to modern medical techniques by which the sex of the baby can be determined in the very early stages of pregnancy. The sonogram — an x-ray-like diagnostic device based on ultra-sound technology — was originally developed to identify genetic or other disorders in the foetus. It is misused to identify and selectively abort female foetuses.
The Puzzle of Prosperity
The regional pattern of low child sex ratios seems to support this argument, and it produces the most uncomfortable finding in the chapter.
It is striking that the lowest child sex ratios are found in the most prosperous regions of India. According to the Economic Survey for a recent year, Maharashtra, Punjab, Haryana, Chandigarh and Delhi have high per capita income — and the child sex ratio of these states is still low.
So the problem of selective abortions is not due to poverty, or ignorance, or lack of resources. It cannot be explained away as something that will disappear when incomes rise, because incomes have risen in exactly the places where girls are most missing.
Why should this be? Sometimes economically prosperous families decide to have fewer children — often only one or two now. A family that has decided on two children, and that wants at least one son, has far less room to leave the matter to chance than a family that expects to have six. Having decided how many children to have, such families may also wish to choose the sex of their child. This becomes possible with the availability of ultra-sound technology.
Prosperity, in other words, has not weakened son preference. It has supplied the means of acting on it, and a smaller family size has supplied the motive.
What the Law Has Done
The government has passed strict laws banning this practice, imposing heavy fines and imprisonment as punishment.
But the limits of law are part of the lesson. Sex determination happens inside a clinic, between a doctor and a family, both of whom have an interest in silence; a prohibition is only as strong as the willingness of people to report its breach. In the long run, the solution to problems like bias against girl children depends more on how social attitudes evolve — even though laws and rules can also help.
This is why the issue has never been left to the state alone. Women’s organisations and citizens’ groups have campaigned publicly against sex selection and the neglect of girls, arguing that a law can close a clinic but only a change in what families want can bring the daughters back.
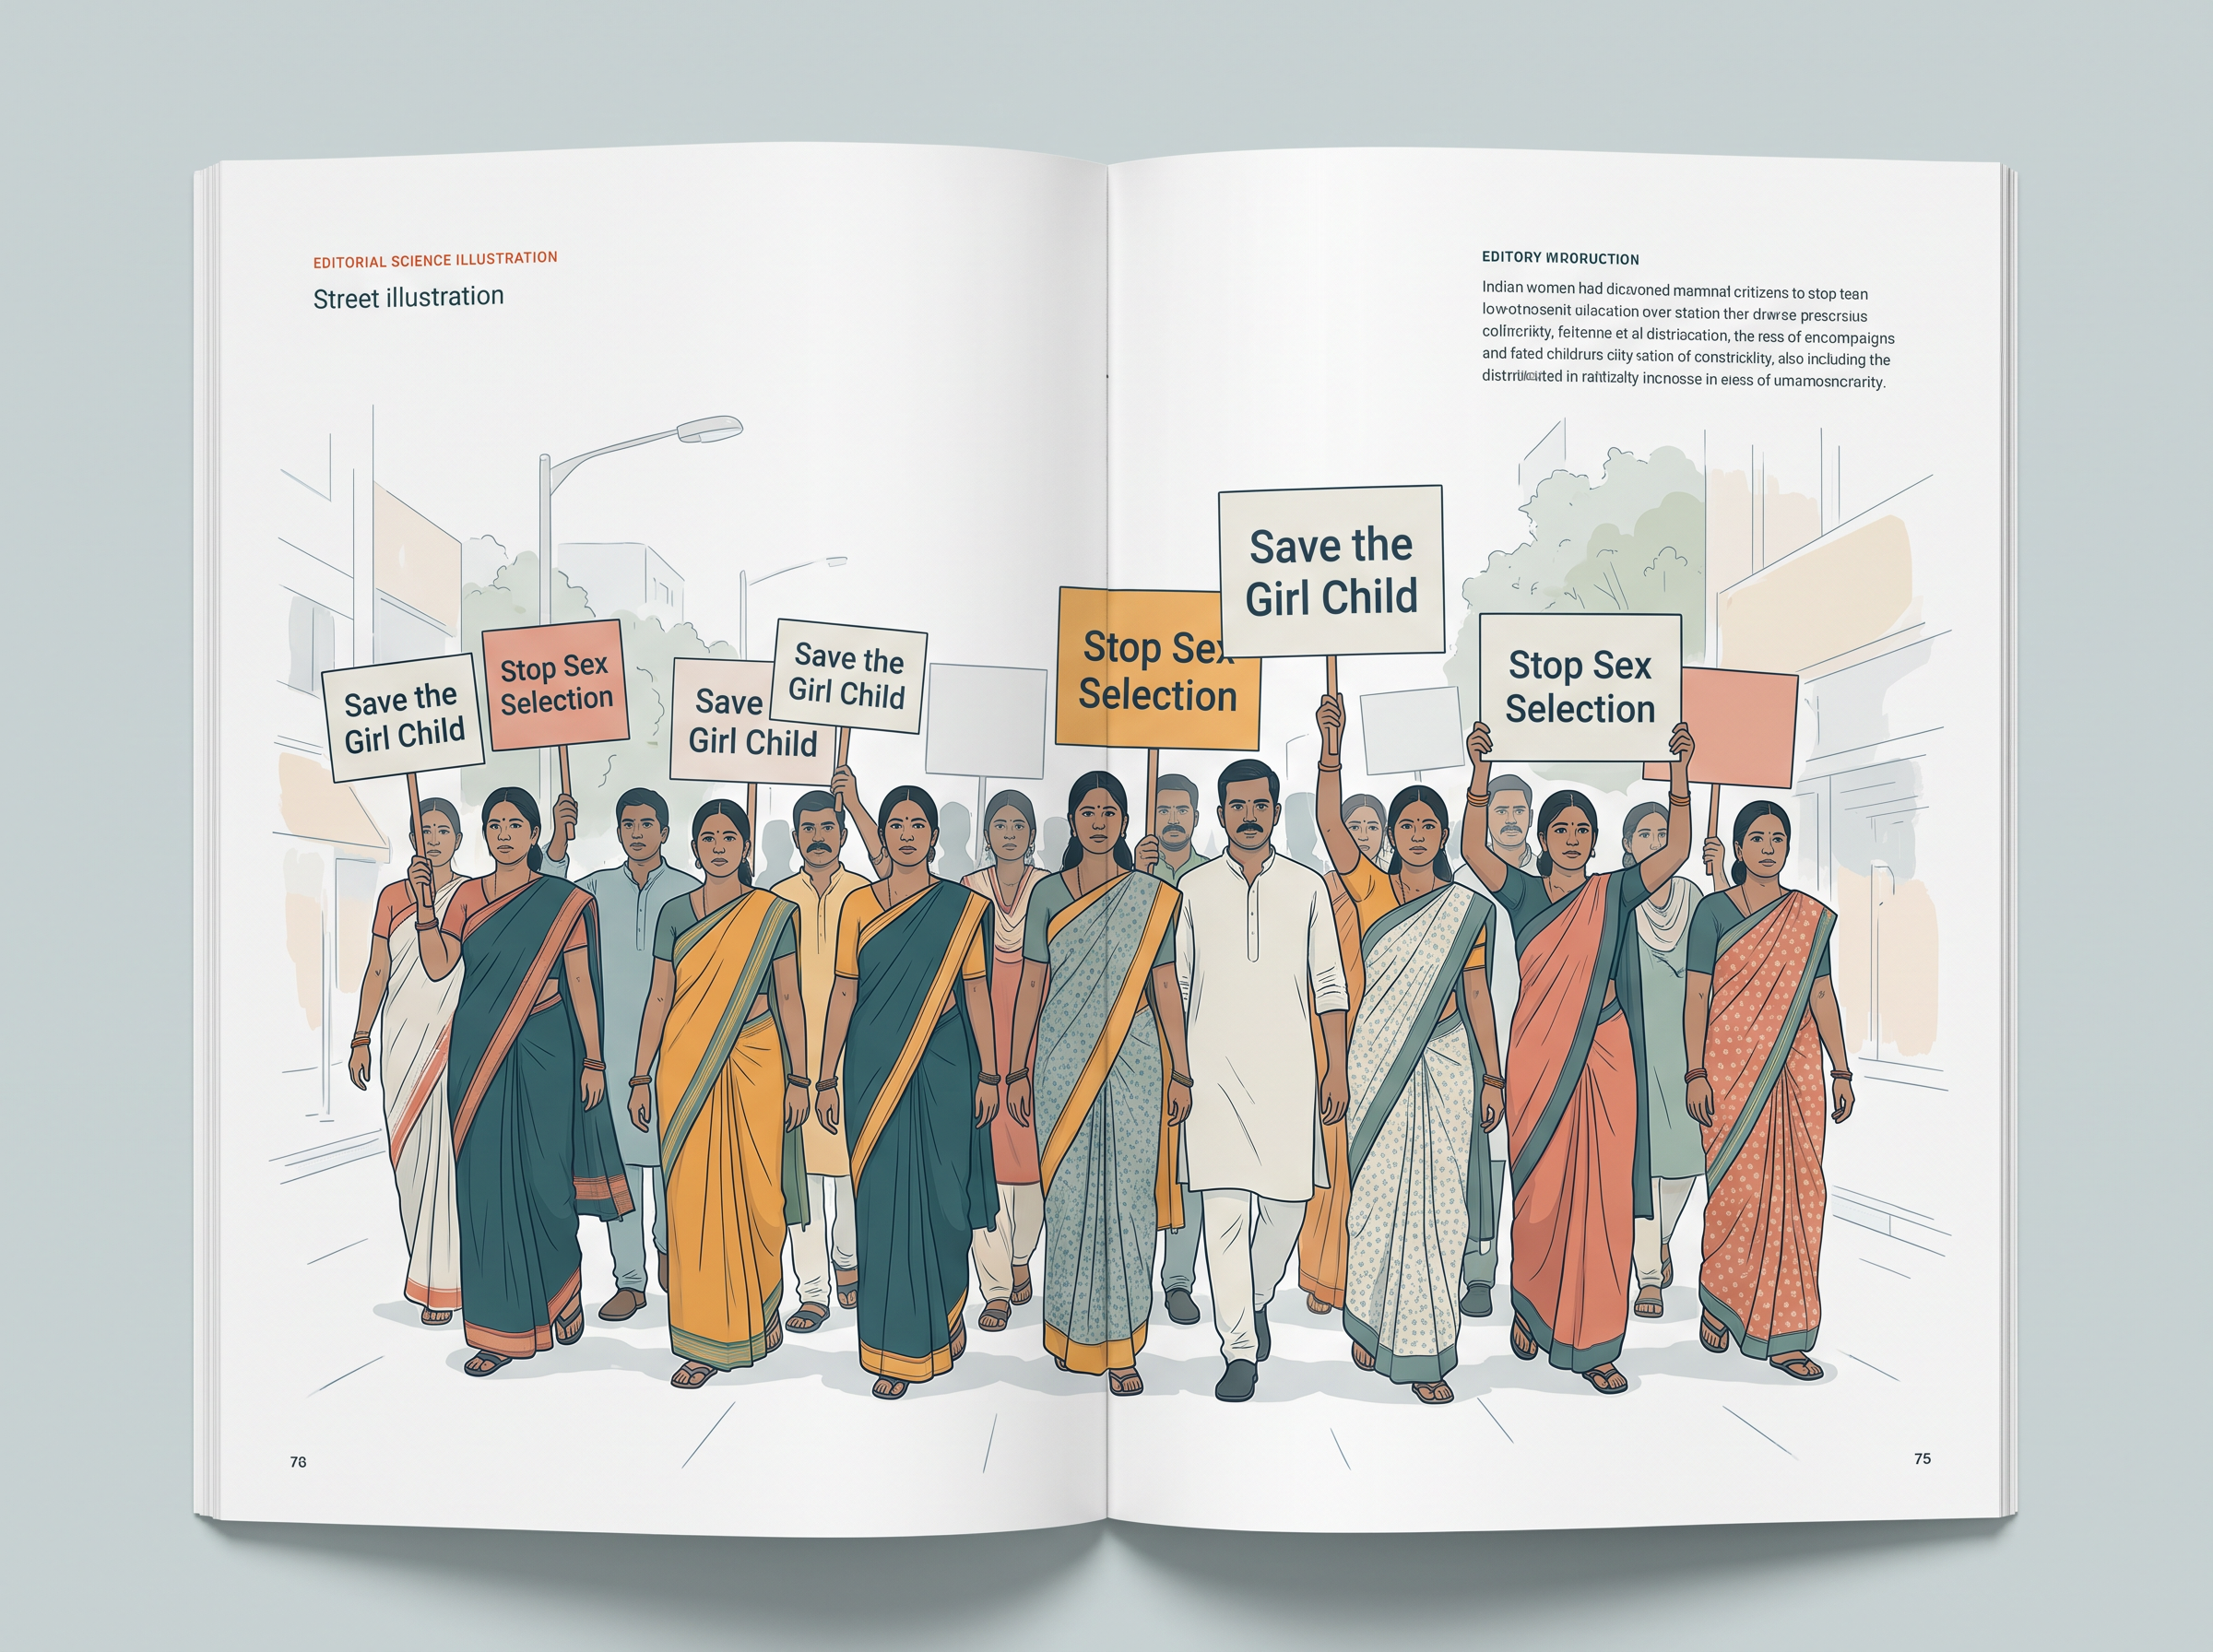
Fig. 2.11 – Public campaign against sex-selective practices.
2.5 Literacy
Literacy, as a prerequisite to education, is an instrument of empowerment. It is the door through which everything else has to pass.
The more literate the population, the greater the consciousness of career options, as well as participation in the knowledge economy. A person who can read can find out that a job exists, understand what it requires, and apply for it. Further, literacy can lead to health awareness — reading a prescription, a warning, a notice at a health centre — and to fuller participation in the cultural and economic well-being of the community.
The literacy rate in India is measured as the percentage of the population aged seven years and above that can read and write.
\[\text{Literacy rate} = \frac{\text{Number of literate persons aged 7 and above}}{\text{Total population aged 7 and above}} \times 100\]
Literacy levels have improved considerably after Independence, and almost two-thirds of our population is now literate. But improvements in the literacy rate have to struggle to keep up with the rate of growth of the Indian population, which is still quite high. The schools do not merely have to teach the illiterate; they have to teach a growing number of new children at the same time.
Three Kinds of Inequality
Literacy varies considerably across gender, across regions, and across social groups. A single national figure conceals all three.
Source: Bose (2001:22); Census of India 2011.
As can be seen from Table 2.4, the literacy rate for women is 16.3 per cent less than the literacy rate for men. Read the last column downwards, however, and something more hopeful appears: the gap widened until 1981, and has been closing since.
Female literacy has been rising faster than male literacy, partly because it started from relatively low levels — in 1951 fewer than nine women in a hundred could read and write. Female literacy rose by about 10.4 per cent between 2001 and 2011, compared to a rise in male literacy of 7.6 per cent in the same period. Literacy increased approximately 8 per cent in total; male literacy rose about 5 per cent, whereas female literacy rose about 10 per cent.
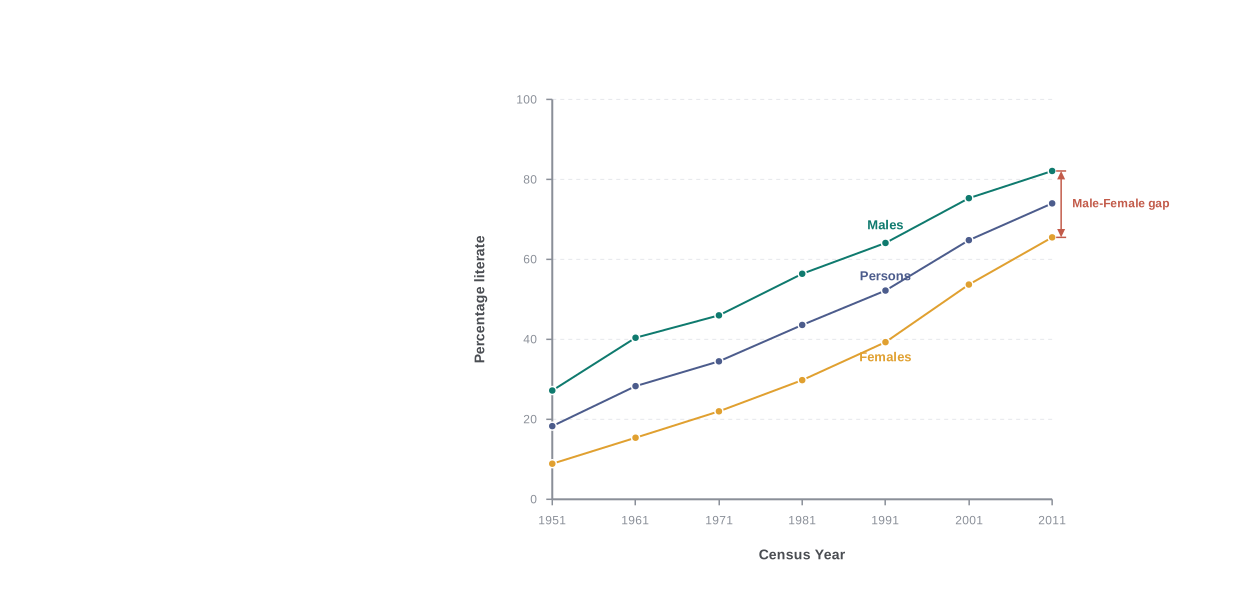
Fig. 2.12 – Male and female literacy rates in India, 1951–2011.
Literacy rates also vary by social group. Historically disadvantaged communities like the Scheduled Castes and the Scheduled Tribes have lower rates of literacy, and rates of female literacy within these groups are even lower. A woman who belongs to such a community is thus disadvantaged twice over, once by gender and once by social group — the two inequalities do not simply sit side by side; they compound each other.
Regional variations are still very wide, with states like Kerala approaching universal literacy, while states like Bihar are lagging far behind.
Why Literacy Inequality Lasts
The inequalities in the literacy rate are specially important because they tend to reproduce inequality across generations.
Illiterate parents are at a severe disadvantage in ensuring that their children are well educated. They cannot read a school notice, help with homework, judge whether a school is teaching anything, or navigate the paperwork that admission and scholarships require. Their disadvantage becomes their children’s disadvantage.
This is what sociologists mean when they say that inequality is reproduced rather than merely repeated. It is not that each generation independently fails; it is that the failure of one generation becomes a structural condition for the next.
2.6 Rural-Urban Differences
The vast majority of the population of India has always lived in the rural areas, and that continues to be true. According to the Census of India 2011, more people are still living in rural areas, but the population of urban areas has increased. Now 68.8 per cent of the population lives in rural areas, while 31.2 per cent live in urban areas.
Source: http://ayush.gov.in
As Table 2.5 shows, the urban population has been increasing its share steadily — from about 11 per cent at the beginning of the twentieth century to about 28 per cent at the beginning of the twenty-first century, an increase of about two-and-a-half times. Notice that the rural population has not shrunk in absolute numbers; it has grown, from 213 million to 833 million. What has fallen is its share. India is not emptying its villages so much as filling its cities faster.
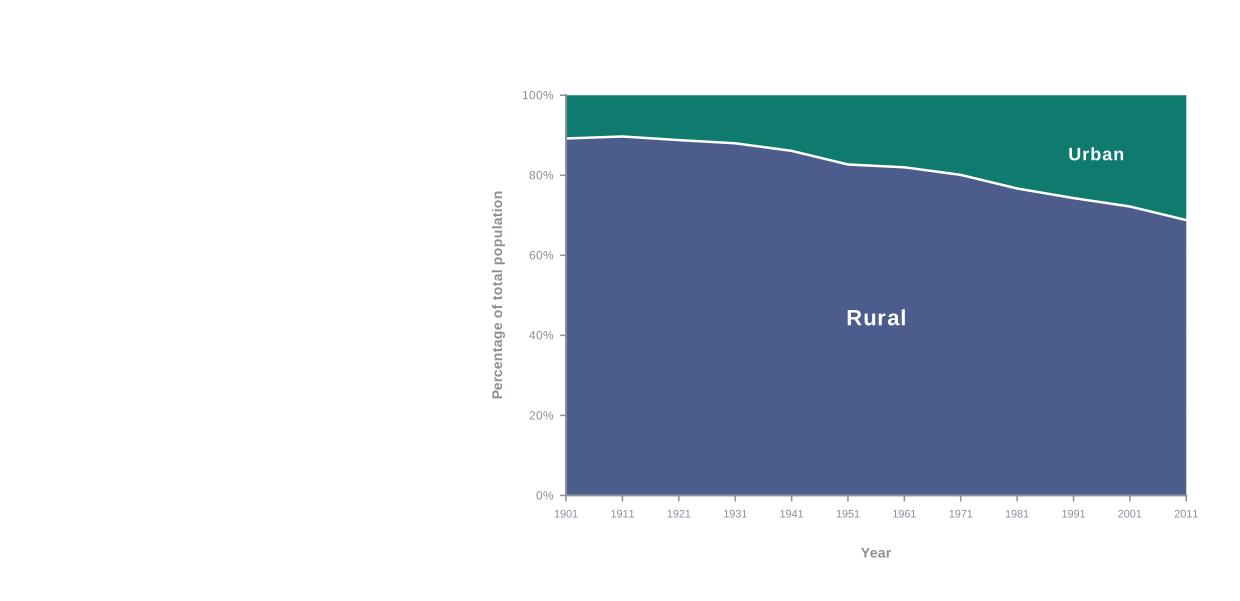
Fig. 2.13 – Rural and urban population shares, 1901–2011.
But it is not a question of numbers alone. Processes of modern development ensure that the economic and social significance of the agrarian-rural way of life declines relative to the significance of the industrial-urban way of life. This has been broadly true all over the world, and it is true in India as well.
The Shrinking Economic Weight of Agriculture
Agriculture used to be by far the largest contributor to the country, but today it only contributes about one-sixth of the gross domestic product.
Hold those two facts together, because their combination is the heart of the matter. The majority of our people live in the rural areas and make their living out of agriculture — yet the relative economic value of what they produce has fallen drastically. The same work supports the same people, but it now counts for far less in the national economy than it once did.
Moreover, more and more people who live in villages may no longer work in agriculture, or even in the village at all. Rural people are increasingly engaged in non-farm rural occupations like transport services, business enterprises or craft manufacturing. If they are close enough to a town, they may travel daily to the nearest urban centre to work while continuing to live in the village. The line between ‘rural’ and ‘urban’ is being crossed twice a day by such workers.
The Village Is Not Sealed Off
Mass media and communication channels are now bringing images of urban lifestyles and patterns of consumption into the rural areas. Consequently, urban norms and standards are becoming well known even in the remote villages, creating new desires and aspirations for consumption.
Mass transit and mass communication are together bridging the gap between the rural and the urban areas. A bus service and a mobile phone do the same work from different directions: one moves the person to the city, the other brings the city to the person.
It would be a mistake to imagine that villages were ever self-contained. Even in the past, the rural areas were never really beyond the reach of market forces. What is new is the depth of the connection: today they are being more closely integrated into the consumer market. (The social role of markets is discussed in Chapter 4.)
The City as a Magnet
Considered from an urban point of view, the rapid growth in urbanisation shows that the town or city has been acting as a magnet for the rural population. Those who cannot find work — or sufficient work — in the rural areas go to the city in search of it.
This flow of rural-to-urban migration has also been accelerated by something less visible: the continuous decline of common property resources like ponds, forests and grazing lands.
These common resources enabled poor people to survive in the villages although they owned little or no land. A landless household could graze an animal on common land, gather fuel from a forest, catch fish in a pond. None of this required owning anything.
Now these resources have been turned into private property, or they are exhausted. Ponds may run dry or no longer provide enough fish; forests may have been cut down and vanished. If people no longer have access to these resources, but on the other hand have to buy many things in the market that they used to get free — like fuel, fodder or supplementary food items — then their hardship increases. This hardship is worsened by the fact that opportunities for earning cash income are limited in the villages.
Follow the logic and the migration becomes intelligible. A household that once needed little cash now needs cash for what it once gathered free — and cash is precisely what the village cannot supply. The city is not simply attractive; for such a household it has become necessary.
The Anonymity of the City
Sometimes the city may also be preferred for social reasons, especially the relative anonymity it offers. Urban life involves interaction with strangers, and being a stranger can be an advantage.
For socially oppressed groups like the Scheduled Castes and the Scheduled Tribes, this may offer some partial protection from the daily humiliation they may suffer in the village, where everyone knows their caste identity. In a city queue or a city bus, no one need know where a person’s family lives or what work it was once assigned.
The anonymity of the city works in the other direction too. It allows the poorer sections of the socially dominant rural groups to engage in low-status work that they would not be able to do in the village, where their neighbours would know and judge them.
Both cases make the same sociological point. In the village, a person carries a known identity into every transaction; in the city, a person can be, for many purposes, simply a person. All these reasons make the city an attractive destination for the villagers, and the swelling cities bear testimony to this flow of population. It is evident from the rapid rate of urbanisation in the post-Independence period.
The Cities Are Growing Unevenly
While urbanisation has been occurring at a rapid pace, it is the biggest cities — the metropolises — that have been growing the fastest. These metros attract migrants from the rural areas as well as from the small towns, so the flow is not simply village-to-city but also small-town-to-metro.
There are now 5,161 towns and cities in India, where 286 million people live. What is striking, however, is that more than two-thirds of the urban population lives in 27 big cities with million-plus populations. Urban India is not spread evenly across five thousand towns; it is concentrated in a few dozen very large ones.
Clearly the larger cities in India are growing at such a rapid rate that the urban infrastructure can hardly keep pace — which is why housing, water, transport and sanitation in the metros are permanently under strain.
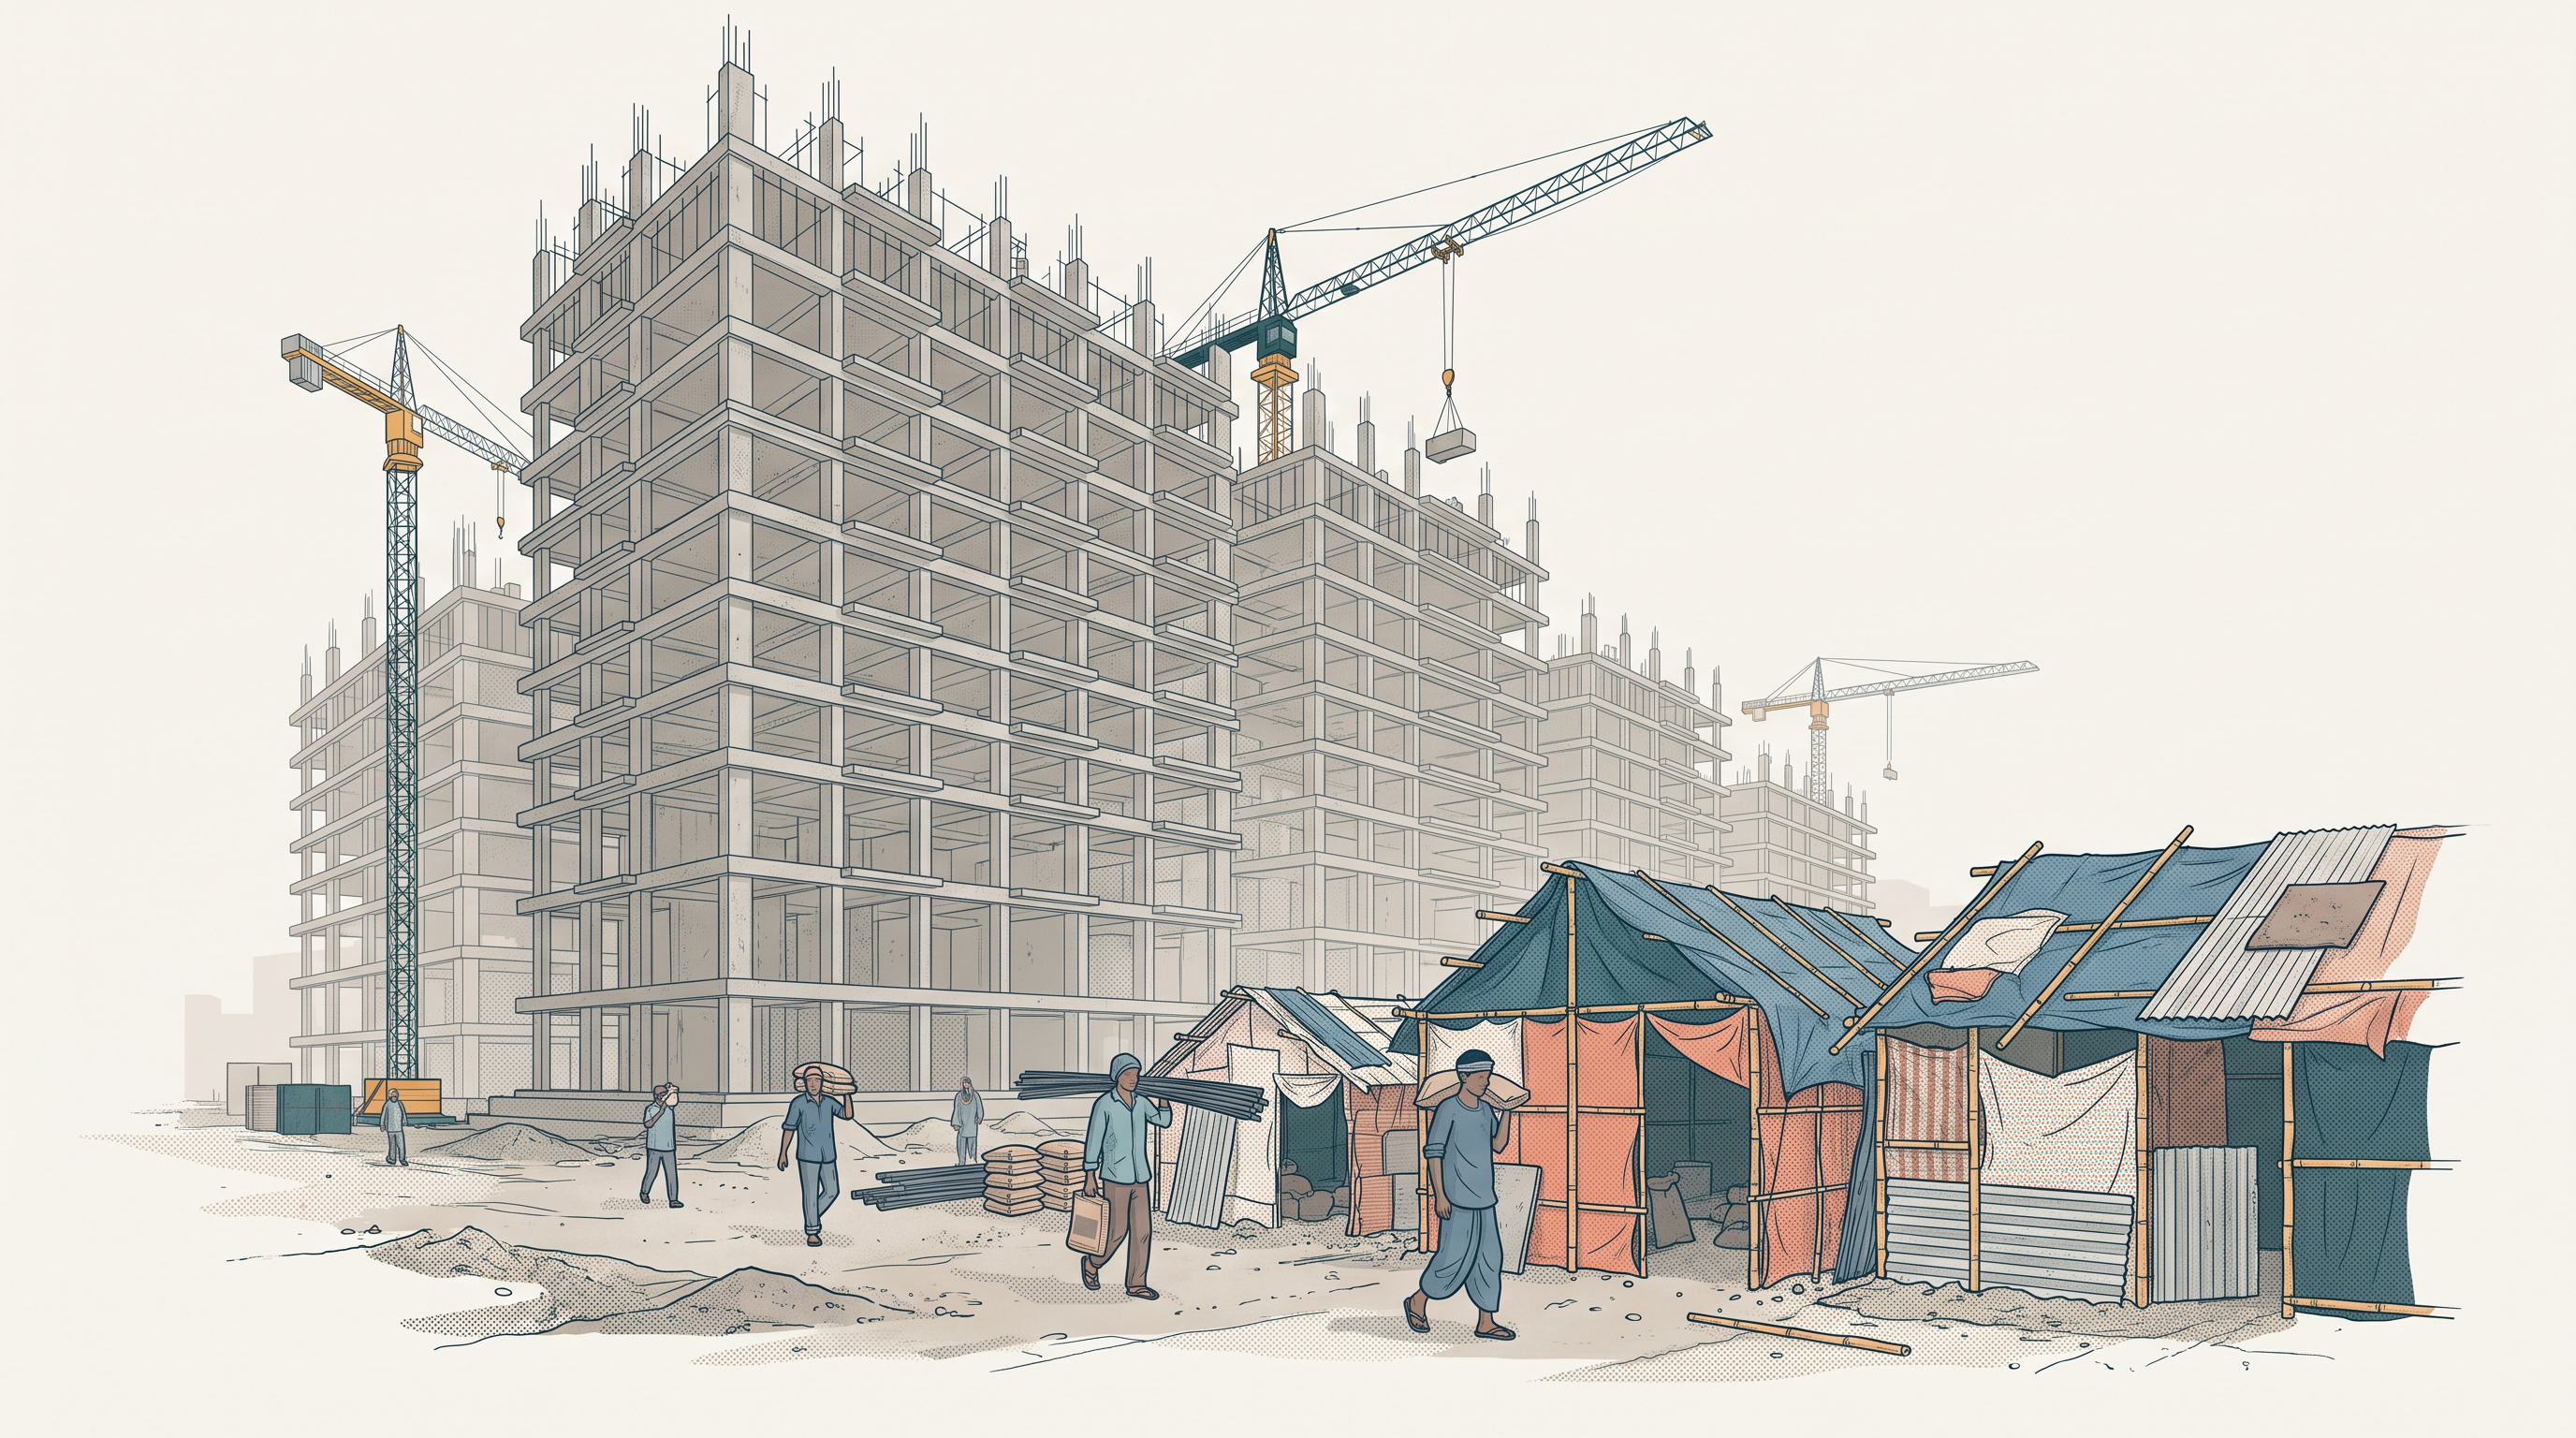
Fig. 2.14 – Rural-to-urban migration and metropolis construction.
There is a final twist, and it is worth ending on. With the mass media’s primary focus on these cities, the public face of India is becoming more and more urban rather than rural — the India that appears on a screen is a city. Yet in terms of the political power dynamics in the country, the rural areas remain a decisive force, because that is still where more than two-thirds of Indians live and vote.
2.7 Population Policy in India
It will be clear from the discussion in this chapter that population dynamics is an important matter, and that it crucially affects the developmental prospects of a nation as well as the health and well-being of its people. Birth rates, age structures, sex ratios and literacy are not merely things that happen to a country; they decide what a country can do next.
This is particularly true of developing countries, which have to face special challenges in this regard. A society that is trying to educate, employ and provide health care for a population that is still growing rapidly is running a race in which the finishing line keeps moving.
It is hardly surprising, therefore, that India has had an official population policy for more than half a century. In fact, India was perhaps the first country in the world to explicitly announce such a policy, in 1952 — barely five years after Independence.
The National Family Planning Programme
The population policy took the concrete form of the National Family Planning Programme.
Notice what such a programme is actually attempting. It is trying to shift a decision — how many children to have — that is taken inside a household, in private, on the basis of long-settled beliefs about security, work and family. The state can supply contraceptives, clinics, information and persuasion. It cannot supply the motive.
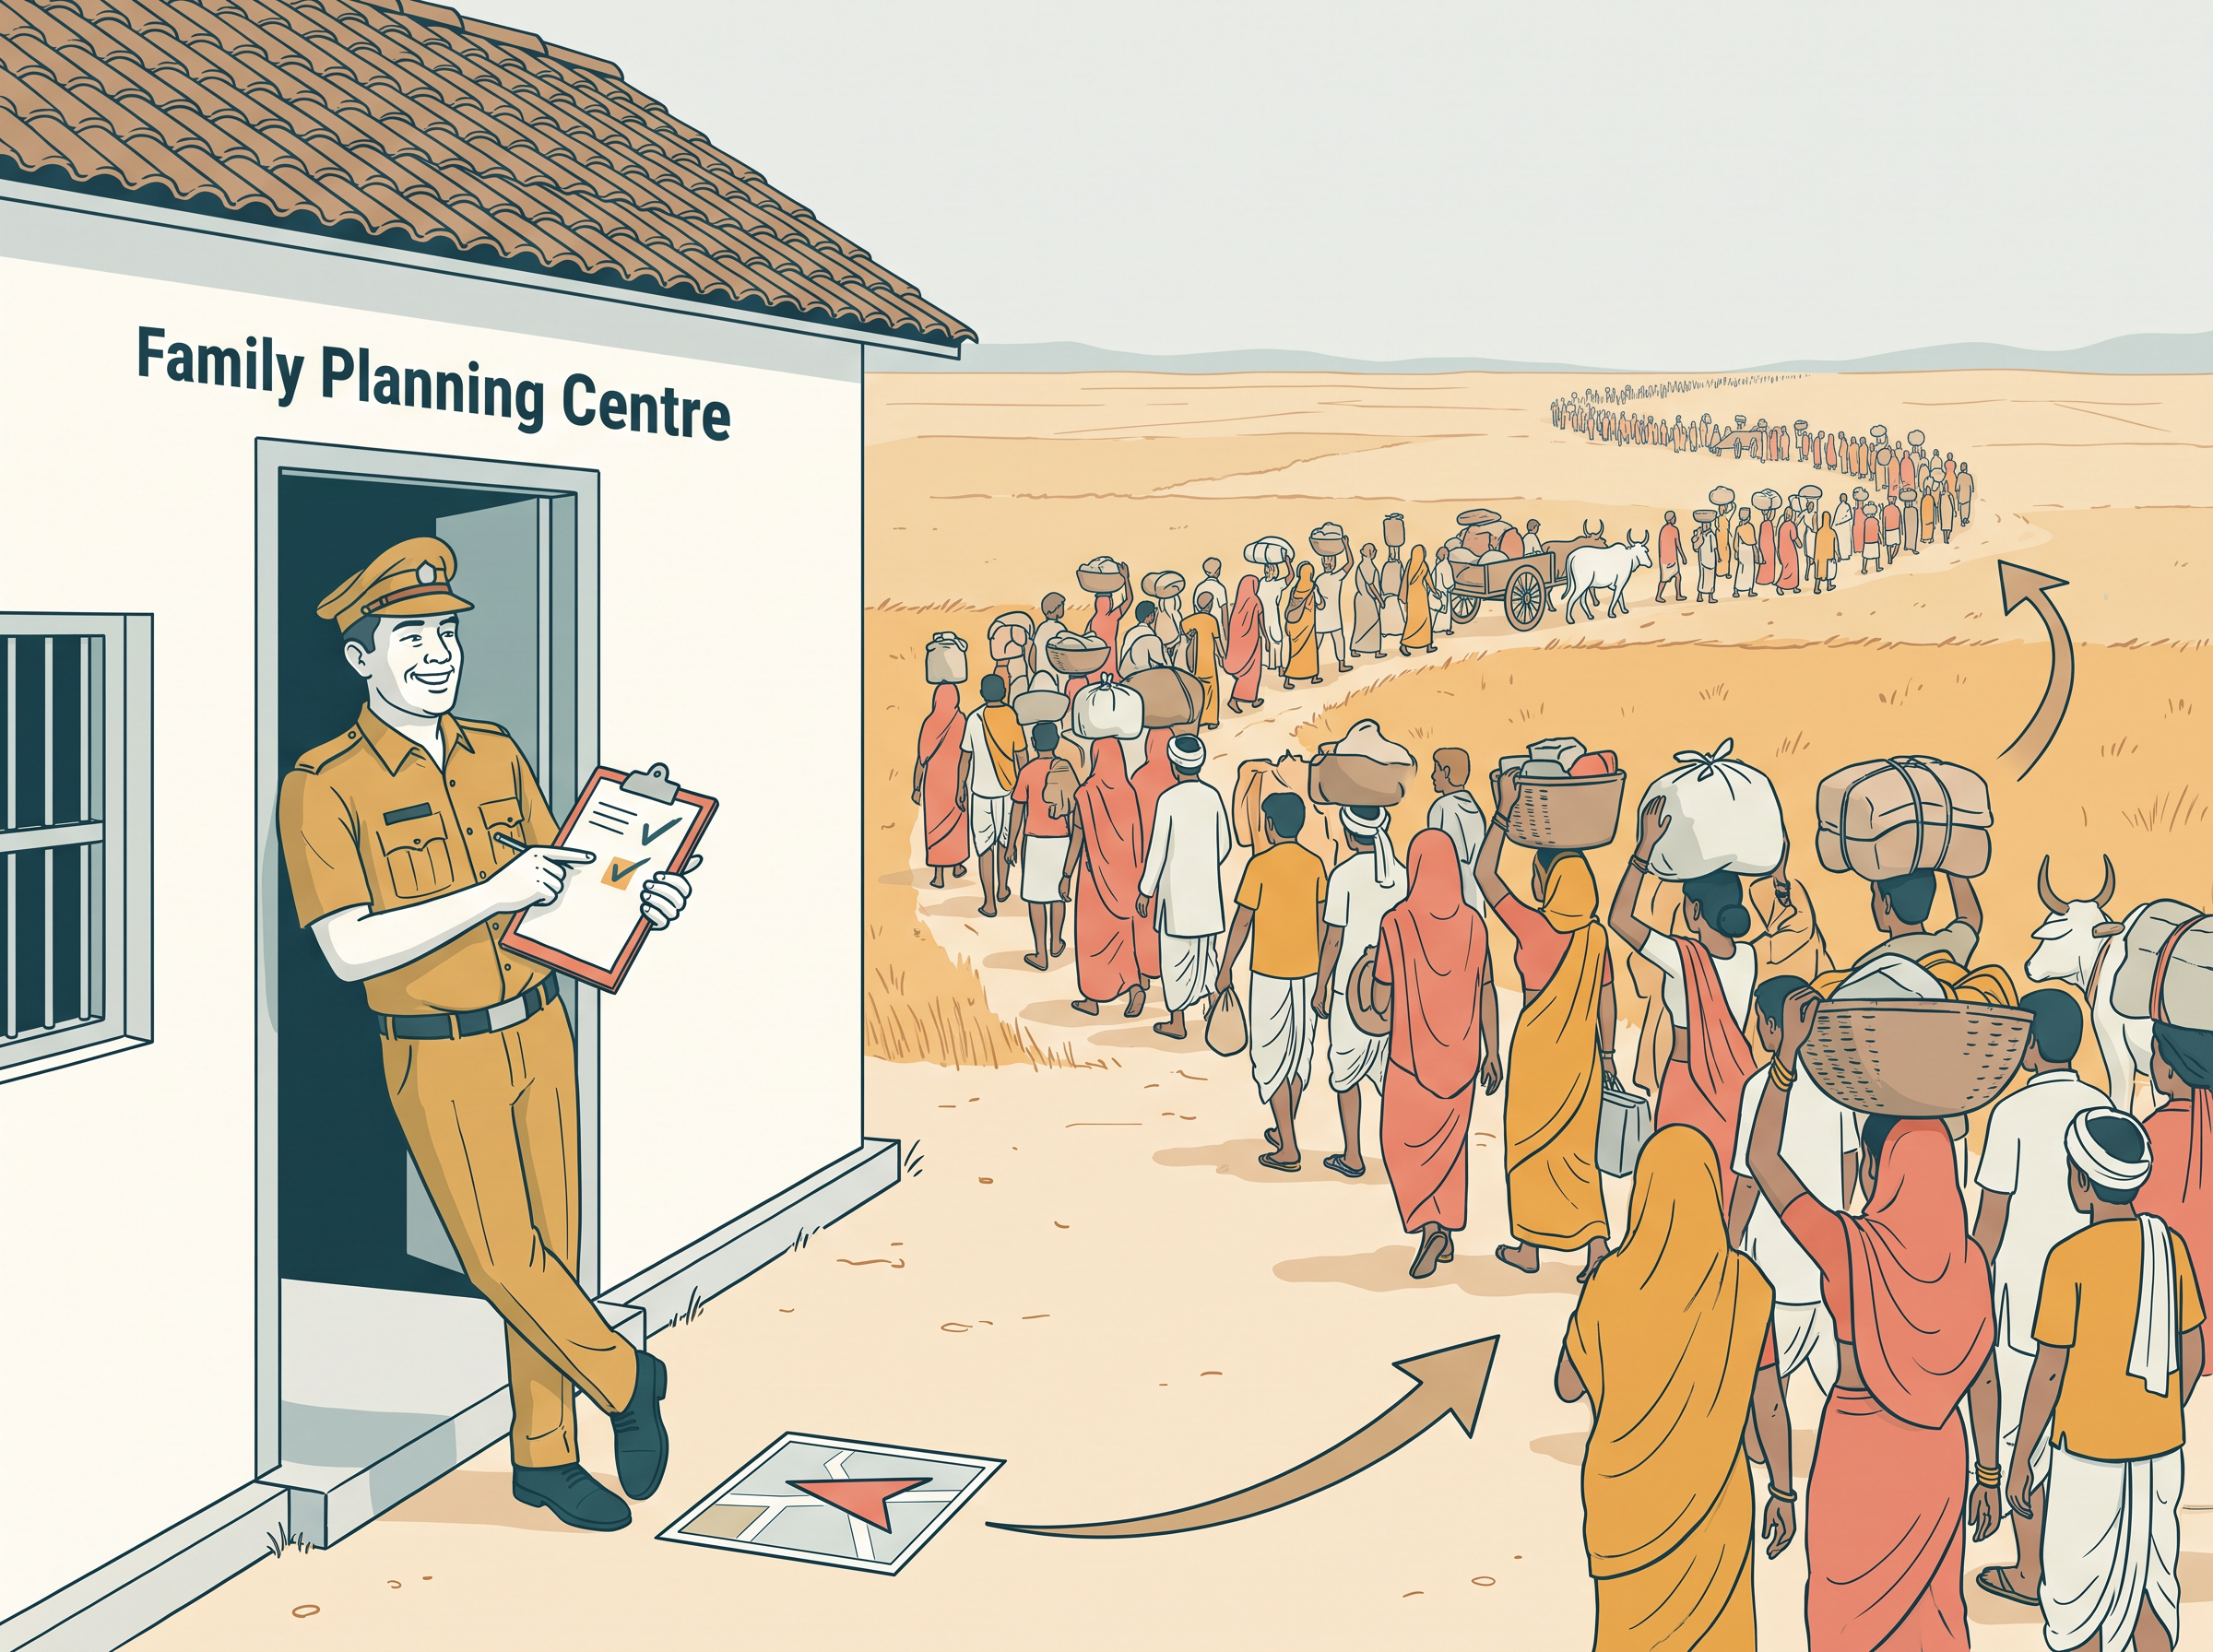
Fig. 2.15 – The limits of administrative targets in family planning.
The Emergency and the Sterilisation Programme
The Family Planning Programme suffered a serious setback during the years of the National Emergency (1975–76).
During this period, normal parliamentary and legal procedures were suspended. Special laws and ordinances were issued directly by the government, without being passed by Parliament. The ordinary checks that a legislature places on executive action were, for the time being, not in operation.
In these conditions the government tried to intensify the effort to bring down the growth rate of population by introducing a coercive programme of mass sterilisation. Sterilisation here refers to medical procedures like vasectomy, for men, and tubectomy, for women, which prevent conception and childbirth.
Vast numbers of mostly poor and powerless people were forcibly sterilised. There was massive pressure on lower-level government officials — school teachers, office workers — to bring people for sterilisation in the camps that were organised for this purpose. A teacher whose promotion depended on meeting a target was, in effect, being made an instrument of the programme.
There was widespread popular opposition to this programme, and the new government elected after the Emergency abandoned it. The episode is remembered less for what it achieved demographically than for what it demonstrated politically: that a population policy carried out against the will of the people cannot be sustained in a democracy, and does lasting damage to the credibility of the programme it was meant to advance.
The Programme After the Emergency
The National Family Planning Programme was renamed as the National Family Welfare Programme after the Emergency, and coercive methods were no longer used. The change of name marked a change of approach: from targets and numbers towards welfare and choice.
The programme now has a broad-based set of socio-demographic objectives — not simply fewer births, but better maternal and child health, wider awareness, and greater access to services. A new set of guidelines was formulated as part of the National Population Policy of the year 2000.
In 2017, the Government of India came out with the National Health Policy 2017, in which most of these socio-demographic goals were incorporated with new targets.
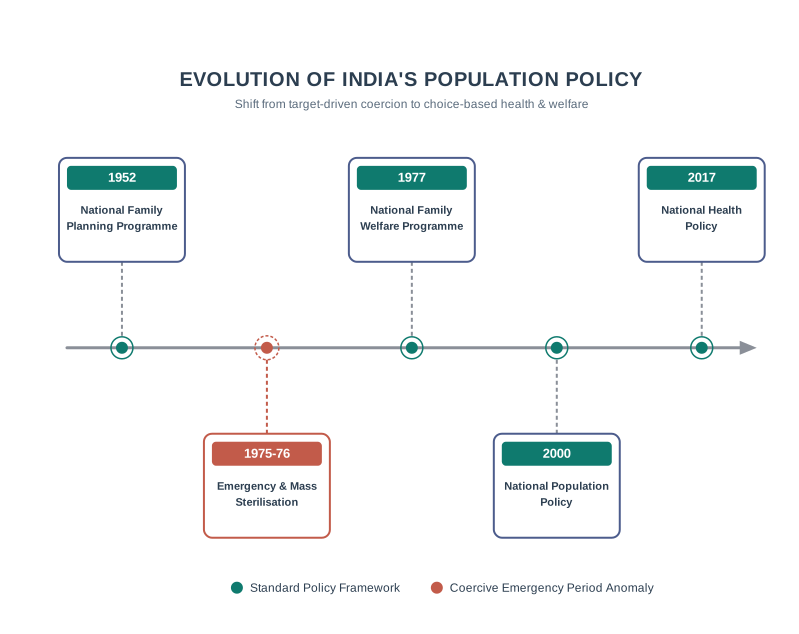
Fig. 2.16 – Timeline of India’s population policy.
What the Policy Can and Cannot Do
The history of India’s National Family Welfare Programme teaches us something that the whole chapter has been building towards.
While the state can do a lot to try and create the conditions for demographic change, most demographic variables — specially those related to human fertility — are ultimately matters of economic, social and cultural change.
Recall the evidence. Death rates fell fast because the state could deliver vaccination, sanitation and famine relief directly. Birth rates fell slowly, because they depend on what families believe about children. Fertility is lowest in the states where infant mortality is low and where women are educated. Girls go missing not where people are poor and ignorant, but where prosperity meets an unchanged preference for sons.
In every one of these cases, the numbers move when the society moves. A population policy is therefore not really a policy about numbers at all. It is a policy about schooling, health, employment and the standing of women — and the numbers follow.
2.8 Summary
Demography and Sociology
- Demography is the systematic study of population — of its size, of the patterns of births, deaths and migration, and of its composition, such as the relative proportions of women, men and different age groups. The word comes from the Greek demos (people) and graphein (describe).
- Formal demography is largely quantitative and concentrates on measuring the components of population change; social demography, or population studies, asks about the wider social causes and consequences of population structures and change.
- All demographic study rests on enumeration — the census or the survey. The modern state began collecting social statistics in the late eighteenth century because its new tasks, from public health to the governance of cities, required them. The American census of 1790 was probably the first modern census; in India, censuses were conducted by the British Indian government between 1867–72, decennially since 1881, and seven decennial censuses have been held since 1951.
- Aggregate statistics helped justify sociology as a discipline: the death rate is made up of individual deaths, yet the rate itself is a social phenomenon. Durkheim’s study of suicide showed that a rate can be patterned and must be explained socially, even when each individual case has private causes.
Two Theories of Population
- Malthus argued that population grows in geometric progression while agricultural production grows only in arithmetic progression, so population always outstrips subsistence and humanity is condemned to poverty. Preventive checks (postponing marriage, abstinence, celibacy) are weak; positive checks (famines and diseases) are therefore inevitable.
- Malthus was refuted by the historical experience of Europe: birth rates declined, epidemics were controlled, and food production and living standards rose despite rapid population growth. Liberal and Marxist critics added that poverty is caused by the unequal distribution of economic resources, not by numbers.
- The theory of demographic transition links population growth to levels of development, in three stages: low growth with both birth and death rates high; a transitional stage of very high growth as death rates fall quickly through disease control, public health and nutrition while birth rates stay high; and low growth again once both rates are low. The gap in the middle stage is the ‘population explosion’.
- Birth rates fall slowly because reproductive behaviour is sociocultural and slow to change. India’s transition is incomplete: mortality has fallen, but the birth rate has not fallen to the same extent.
Concepts and Indicators
- Birth rate: live births per 1000 population. Death rate: deaths per 1000 population. Rate of natural increase (growth rate): birth rate minus death rate; when it is near zero the population is at the replacement level. Below-replacement fertility gives a negative growth rate, as in Japan, Russia, Italy and Eastern Europe.
- Fertility rate: live births per 1000 women in the child-bearing age group of 15–49. Infant mortality rate: deaths of babies under one year per 1000 live births. Maternal mortality rate: women dying in childbirth per 1,00,000 live births. Life expectancy: the estimated number of years an average person is expected to survive.
- Sex ratio: females per 1000 males. Nature produces roughly 943 to 952 female babies for every 1000 males, but girls resist disease better in infancy and women outlive men, giving a sex ratio of roughly 1050 in most contexts.
- Age structure: the proportion of persons in different age groups. Development and rising life expectancy shift the structure towards older ages — the ageing of the population. The dependency ratio is the population below 15 or above 64 divided by the population aged 15–64, expressed as a percentage; a falling ratio yields the ‘demographic dividend’, which is temporary.
Size and Growth of India’s Population
- India is the second most populous country after China, with 121 crores (1.21 billion) in the Census of India 2011.
- Growth was modest between 1901 and 1951, with an average annual growth rate never exceeding 1.33 per cent; between 1911 and 1921 growth was negative at –0.03 per cent, because the influenza epidemic of 1918–19 killed about 12.5 million persons, or 5 per cent of the population.
- Growth accelerated after Independence, reaching 2.2 per cent during 1961–1981, and has since fallen to 1.63 per cent — still among the highest in the developing world.
- Birth and death rates began to diverge after the decade of 1921–1931. The death rate fell sharply because of greater control over famines and epidemic diseases, mass vaccination and sanitation; the birth rate fell only slightly, because it is a sociocultural phenomenon.
- Famines were caused not only by poverty, rainfall and weak state effort but, as scholars like Amartya Sen have shown, by a ‘failure of entitlements’ — the inability of people to buy or obtain food. Irrigation, communication and state relief have drastically reduced famine deaths; MGNREGA is the latest initiative against rural hunger.
- Fertility varies sharply across states. Andhra Pradesh, Himachal Pradesh, Punjab, Tamil Nadu and West Bengal had a TFR of 1.7 each (2016), and Kerala is also below replacement; Bihar, Madhya Pradesh, Rajasthan and Uttar Pradesh had TFRs of 3.3, 2.8, 2.7 and 3.1. Bihar and Uttar Pradesh will account for about half the additions to India’s population up to 2041.
Age Structure
- India has a very young population. The 0–14 share fell from 42 per cent in 1971 to 29 per cent in 2011, while the 15–59 share rose from 53 to 63 per cent and the 60-plus share rose from 5 to 7 per cent. By 2026 the 0–14 group is projected to fall to 23 per cent and the 60-plus group to rise to about 12 per cent.
- Population pyramids show the base narrowing as births fall, the top widening as life expectancy rises, and a bulge developing in the middle age groups.
- Age structures vary regionally: Kerala is beginning to resemble a developed country, while Uttar Pradesh has a much younger profile.
- The demographic dividend arises because a large working-age generation supports a relatively small preceding generation. It is not automatic: it must be exploited through education and employment, and the dependency ratio counts ages, not workers. Employment growth for young men fell sharply between 1987–94 and 1994–2004.
The Declining Sex Ratio
- India’s sex ratio has declined for over a century — from 972 in 1901 to 933 in 2001 — rising to 943 in the Census of India 2011.
- The child sex ratio (0–6 years) has fallen much more steeply: from 976 in 1961 to 945 in 1991, 927 in 2001 and 919 in 2011. In 1991–2001 the overall ratio rose by 6 points while the child ratio fell by 18, dropping below the overall ratio for the first time.
- Nine States and Union Territories have a child sex ratio under 900; Haryana is the lowest at 793, and the highest child sex ratio, 972, is in Arunachal Pradesh.
- Maternal mortality cannot explain the decline, since it is falling. The cause lies in the differential treatment of girl babies: severe neglect in infancy, sex-specific abortions, and female infanticide. The sonogram, developed to detect foetal disorders, is misused to abort female foetuses.
- The lowest child sex ratios are found in prosperous states such as Maharashtra, Punjab, Haryana, Chandigarh and Delhi, so the problem is not poverty, ignorance or lack of resources but son preference, combined with smaller families and access to technology.
- The Pre-natal Diagnostic Techniques (Regulation and Prevention of Misuse) Act has been in force since 1996 and was strengthened in 2003; Beti-Bachao, Beti-Padhao is a more recent programme. In the long run, change depends on social attitudes.
Literacy
- Literacy is a prerequisite to education and an instrument of empowerment, raising awareness of career options, participation in the knowledge economy, and health awareness. Almost two-thirds of the population is now literate.
- Literacy varies by gender, region and social group. In 2011 the female literacy rate was 16.3 per cent below the male rate, but female literacy is rising faster, having risen by about 10.4 per cent between 2001 and 2011 against 7.6 per cent for males.
- Scheduled Castes and Scheduled Tribes have lower literacy, and female literacy within these groups is lower still. Kerala approaches universal literacy while Bihar lags far behind.
- Literacy inequality reproduces inequality across generations, because illiterate parents are at a severe disadvantage in getting their children educated.
Rural–Urban Differences
- In 2011, 68.8 per cent of Indians lived in rural areas and 31.2 per cent in urban areas. The urban share has risen about two-and-a-half times over the century, from about 11 per cent to about 28 per cent at the start of the twenty-first century.
- Agriculture now contributes only about one-sixth of GDP, though most people still depend on it. Villagers increasingly work in non-farm rural occupations or commute to towns; mass media and mass transit are bridging the rural–urban gap.
- Rural-to-urban migration is driven by the shortage of work and by the decline of common property resources — ponds, forests, grazing lands — which once allowed those with little or no land to survive.
- The city also attracts because of its anonymity, which gives socially oppressed groups partial protection from daily humiliation, and allows poorer members of dominant rural groups to take up low-status work.
- The metropolises grow fastest. India has 5,161 towns and cities where 286 million people live, and more than two-thirds of the urban population lives in 27 million-plus cities. The public face of India is increasingly urban, yet rural areas remain politically decisive.
Population Policy
- India was perhaps the first country to announce an explicit population policy, in 1952, which took the form of the National Family Planning Programme, aiming to slow population growth, improve public health and raise awareness.
- The programme suffered a setback during the National Emergency (1975–76), when a coercive mass sterilisation drive — vasectomy and tubectomy — was carried out, largely on poor and powerless people. It met widespread opposition and was abandoned by the government elected afterwards.
- It was renamed the National Family Welfare Programme, coercive methods were dropped, and new guidelines followed under the National Population Policy of 2000 and the National Health Policy of 2017.
- Population momentum means India’s population will keep growing to an estimated 1.6 billion by 2050, even though fertility has fallen from 3.8 children per woman in 1990 to 2.7.
- The central lesson: the state can create the conditions for demographic change, but most demographic variables, especially fertility, are ultimately matters of economic, social and cultural change.
2.9 Key Terms
Age structure of the population — The proportion of persons in different age groups relative to the total population.
Ageing of the population — The shift in the age structure, with development and rising life expectancy, towards smaller proportions in the younger age groups and larger proportions in the older ones.
Aggregate statistics — Numerical characteristics that refer to a large collectivity of millions of people, and that reveal social patterns no individual case can explain.
Arithmetic progression — Growth by the addition of the same quantity each time (2, 4, 6, 8, 10); the rate at which Malthus believed agricultural production could grow.
Birth rate — The number of live births per 1000 population in a given area during a given period, usually a year.
Census — The systematic counting and collection of data on all the people residing within a specified territory; conducted in India every ten years.
Child sex ratio — The number of females per 1000 males in the 0–6 years age group; also called the juvenile sex ratio.
Common property resources — Resources such as ponds, forests and grazing lands that are not privately owned but are available for the use of the community, and on which the landless poor have traditionally depended.
Composition of a population — The make-up of a population in terms of the relative proportions of women, men and different age groups, as distinct from its size.
Death rate — The number of deaths per 1000 population in a given area during a given period, usually a year.
Decennial — Occurring once every ten years; the interval at which regular censuses have been conducted in India since 1881.
Demographic dividend — The benefit flowing from a changing age structure, in which a falling dependency ratio gives a society a larger proportion of workers relative to non-workers; a temporary advantage.
Demographic transition — The theory that societies pass through three stages of population growth — low growth with high birth and death rates, a transitional stage of very high growth as death rates fall first, and low growth with both rates low.
Demography — The systematic study of population; from the Greek demos (people) and graphein (describe).
Dependency ratio — The population below 15 or above 64, divided by the population in the 15–64 age group, usually expressed as a percentage.
Epidemic — An outbreak of disease that spreads rapidly through a population, causing a sharp rise in deaths.
Female infanticide — The killing of girl babies, due to religious or cultural beliefs; one of the causes of India’s falling child sex ratio.
Fertility rate — The number of live births per 1000 women in the child-bearing age group, usually taken to be 15 to 49 years.
Formal demography — The largely quantitative branch of demography, concerned with the measurement and analysis of the components of population change and with forecasting.
Geometric progression — Growth by multiplication (2, 4, 8, 16, 32); the rate at which Malthus believed population grows.
Infant mortality rate — The number of deaths of babies before the age of one year per 1000 live births.
Life expectancy — The estimated number of years that an average person is expected to survive, calculated from age-specific death rates over a period of time.
Literacy rate — The percentage of the population aged seven years and above that is able to read and write.
Maternal mortality rate — The number of women who die in childbirth per 1,00,000 live births.
Pandemic — An epidemic that affects a very wide geographical area, spreading across countries and continents.
Population momentum — The continued growth of a population even after fertility has fallen, because a large cohort of women of reproductive age is still to have its children.
Population pyramid — A graphical picture of the age structure, showing five-year age groups as horizontal bars, with males on one side and females on the other.
Population studies — The broader field, also called social demography, which enquires into the wider causes and consequences of population structures and change.
Positive checks — In Malthus’s theory, the famines and diseases that raise the death rate when population outstrips subsistence; he believed them inevitable.
Preventive checks — In Malthus’s theory, the voluntary means of limiting births, such as postponing marriage or practising abstinence or celibacy.
Projections — Estimates of the future size of age groups or populations, based on data on past rates of growth.
Rate of natural increase (growth rate) — The difference between the birth rate and the death rate of a population.
Replacement level — The rate of growth required for new generations to replace the older ones that are dying out; reached when the growth rate is zero or very small.
Rural-to-urban migration — The movement of people from villages to towns and cities, driven both by the shortage of work and resources in the village and by the attractions of the city.
Sex ratio — The number of females per 1000 males in a given area at a specified time period.
Social demography — The branch of demography that studies the social, economic and political aspects of populations, and the social processes that regulate demographic change.
Social statistics — Quantitative data on various aspects of the population and the economy, collected systematically by the modern state.
Sterilisation — Medical procedures such as vasectomy (for men) and tubectomy (for women) which prevent conception and childbirth.
Total fertility rate (TFR) — The average number of children a woman is expected to bear in her lifetime; a TFR of about 2.1 corresponds to the replacement level.
Urbanisation — The process by which a growing share of a population comes to live in towns and cities, and by which the industrial-urban way of life grows in significance.
2.10 Points to Ponder
Every suicide has its own private reasons, and every death has its own medical cause. Yet Durkheim insisted that the rate of suicide, and the death rate, must be explained socially. What exactly is added to our understanding when we move from the individual case to the rate — and what is lost?
Malthus blamed poverty on numbers; his critics blamed it on distribution. Two hundred years later, when a country reports both rising food production and continuing hunger, which of the two explanations does the evidence favour — and what would count as evidence against your answer?
The chapter shows that the death rate can be brought down by the state within a generation, while the birth rate takes far longer to fall. What does this tell us about the limits of what law, policy and technology can achieve when the behaviour they aim at is rooted in family life?
India’s lowest child sex ratios are found in some of its most prosperous regions. If economic development does not by itself dissolve son preference, what does that suggest about the relationship between economic change and cultural change more generally?
A young person who is of working age but cannot find work is counted as part of India’s ‘demographic dividend’. Is a demographic dividend then a fact about a population, or a promise about a policy?
Villagers are said to be drawn to the city partly by its anonymity — by the freedom of not being known. What does it say about a society that some of its members must become strangers in order to be treated as equals?
If most demographic variables are ‘ultimately matters of economic, social and cultural change’, what is left for a population policy to do — and how would you judge whether such a policy had succeeded?
2.11 NCERT Questions
Explain the basic argument of the theory of demographic transition. Why is the transition period associated with a ‘population explosion’?
Why did Malthus believe that catastrophic events like famines and epidemics, which cause mass deaths, were inevitable?
What is meant by ‘birth rate’ and ‘death rate’? Explain why the birth rate is relatively slow to fall while the death rate declines much faster.
Which states in India have reached, or are very near, the ‘replacement levels’ of population growth? Which ones still have very high rates of population growth? In your opinion, what could be some of the reasons for these regional differences?
What is meant by the ‘age structure’ of the population? Why is it relevant for economic development and growth?
What is meant by the ‘sex ratio’? What are some of the implications of a declining sex ratio? Do you feel that parents still prefer to have sons rather than daughters? What, in your opinion, could be some of the reasons for this preference?
2.12 Objective Questions
- The term ‘demography’ is derived from two Greek words meaning:
- society and study
- people and describe
- numbers and record
- birth and death [1 mark]
- Which of the following was probably the first modern census?
- The Indian census of 1881
- The British census of 1801
- The American census of 1790
- The French census of 1791 [1 mark]
- Between 1911 and 1921, India recorded a negative population growth rate of –0.03 per cent. The main reason was:
- large-scale emigration
- the influenza epidemic of 1918–19
- a fall in the birth rate below the replacement level
- the partition of Bengal [1 mark]
- According to the Census of India 2011, the child sex ratio (0–6 years) for the country was:
- 943
- 933
- 927
- 919 [1 mark]
- The state with the lowest child sex ratio, at 793, is:
- Punjab
- Haryana
- Delhi
- Uttar Pradesh [1 mark]
- In 2016, the total fertility rate (TFR) of Bihar was:
- 2.7
- 2.8
- 3.1
- 3.3 [1 mark]
- According to the Census of India 2011, the percentage of India’s population living in urban areas was:
- 11.2
- 27.8
- 31.2
- 68.8 [1 mark]
- Malthus’s ‘preventive checks’ on population growth included:
- famines and epidemics
- postponing marriage and practising celibacy
- mass sterilisation
- improvements in agricultural productivity [1 mark]
- Assertion (A): The birth rate falls much more slowly than the death rate. Reason (R): The birth rate is a sociocultural phenomenon that is relatively slow to change.
- Both A and R are true, and R is the correct explanation of A.
- Both A and R are true, but R is not the correct explanation of A.
- A is true, but R is false.
- A is false, but R is true. [1 mark]
- Assertion (A): A falling dependency ratio can be a source of economic growth and prosperity. Reason (R): A falling dependency ratio means a larger proportion of workers relative to non-workers.
- Both A and R are true, and R is the correct explanation of A.
- Both A and R are true, but R is not the correct explanation of A.
- A is true, but R is false.
- A is false, but R is true. [1 mark]
- Assertion (A): The decline in India’s child sex ratio can be explained by poverty and lack of resources. Reason (R): Some of the lowest child sex ratios are found in states with high per capita income, such as Punjab, Haryana and Delhi.
- Both A and R are true, and R is the correct explanation of A.
- Both A and R are true, but R is not the correct explanation of A.
- A is true, but R is false.
- A is false, but R is true. [1 mark]
- Match the thinker in Column A with the idea in Column B.
| Column A | Column B |
|---|---|
| a. Thomas Robert Malthus | i. Failure of entitlements as a cause of famine |
| b. Emile Durkheim | ii. Positive and preventive checks on population |
| c. Amartya Sen | iii. Suicide rates must be explained by social causes |
[1 mark]
- Match the policy or law in Column A with the year in Column B.
| Column A | Column B |
|---|---|
| a. India’s first official population policy / National Family Planning Programme | i. 1996 |
| b. Pre-natal Diagnostic Techniques (Regulation and Prevention of Misuse) Act comes into force | ii. 2000 |
| c. National Population Policy | iii. 2017 |
| d. National Health Policy | iv. 1952 |
[1 mark]
Fill in the blank: The dependency ratio is calculated as the population below 15 or above ______, divided by the population in the 15–64 age group. [1 mark]
Fill in the blank: Nature seems to produce roughly ______ to ______ female babies for every 1000 males. [1 mark]
True or False: Formal demography is primarily concerned with the wider social causes and consequences of population change, while social demography concentrates on measurement and forecasting. [1 mark]
True or False: In the decade 1991–2001, India’s overall sex ratio rose while its child sex ratio fell. [1 mark]
2.13 Check Your Concepts
Define demography, and state the difference in focus between formal demography and social demography. [2 marks]
What is meant by the ‘replacement level’ of population growth? Name any two states that have reached or crossed it. [2 marks]
What is population momentum? Give one reason why India’s population is projected to keep growing even though fertility has fallen. [2 marks]
State the two reasons why, in most societies, the sex ratio is naturally somewhat in favour of females. [2 marks]
What are common property resources? Give two examples from the chapter. [2 marks]
The birth rate of a state is 26 per 1000 and its death rate is 8 per 1000. Calculate the rate of natural increase, and state what it means. [2 marks]
A district has 5,20,000 males and 4,68,000 females. Calculate its sex ratio, and compare it with India’s sex ratio in the Census of India 2011. [2 marks]
Differentiate between preventive checks and positive checks in Malthus’s theory, with one example of each. [4 marks]
Distinguish between the overall sex ratio and the child sex ratio. Why do sociologists treat the child sex ratio as the sharper warning signal? [4 marks]
Why did the death rate in India fall sharply after 1921 while the birth rate fell only slightly? Give reasons for each. [4 marks]
Explain, with an Indian example, what Amartya Sen and others meant by a ‘failure of entitlements’ as a cause of famine. How does this change the way a state should respond to hunger? [4 marks]
Study Table 2.2 (age composition of the population of India, 1961–2026). Describe what happens to the shares of the 0–14 and 60-plus age groups between 2001 and 2026, and explain what this change means for the shape of India’s population pyramid. [4 marks]
Why is the demographic dividend described as a benefit that is not automatic? Explain the difference between being of working age and actually working. [4 marks]
Explain how inequalities in literacy tend to reproduce inequality across generations. Refer to gender and social group in your answer. [4 marks]
“Rural-to-urban migration is caused as much by what the village has lost as by what the city offers.” Explain this statement with reference to the decline of common property resources and the anonymity of the city. [4 marks]
Explain the Malthusian theory of population growth in full. What evidence did Malthus rely on, and on what grounds was his theory rejected, both by history and by his critics? [6 marks]
Describe the three stages of the theory of demographic transition. Why does the middle stage produce a ‘population explosion’, and where does India stand in this transition today? [6 marks]
Discuss the causes of the declining child sex ratio in India. Why is the argument from maternal mortality rejected, and why has prosperity failed to reverse the trend? What has the law attempted, and what are its limits? [6 marks]
“India’s young population is an opportunity, not an achievement.” How far do you agree? Evaluate the claim using the age structure data and the evidence on employment given in the chapter. [6 marks]
Trace the history of India’s population policy from 1952 to the National Health Policy 2017. What does this history teach us about what the state can and cannot do to bring about demographic change? [6 marks]
Fertility rates differ sharply across Indian states. Compare the states that have reached below-replacement fertility with those that still have high total fertility rates, and discuss the social reasons for these regional differences. [6 marks]
2.14 Passage-Based Questions
Read the following table and answer the questions that follow.
Year Birth rate (per 1000) Death rate (per 1000) 1911–20 48 47 1951–60 42 23 2011 22 7 (Figures are illustrative and rounded, in the pattern of the chapter’s discussion of India.)
- Calculate the rate of natural increase for each of the three periods.
- In which of the three periods was population growth fastest, and why — even though the birth rate in that period was lower than in 1911–20?
- Which stage of the demographic transition does each row represent? Give a reason for each. [6 marks]
Read the passage and answer the questions that follow.
In a village in a dry district, families that own no land once kept a few goats on the common grazing ground, gathered firewood from a nearby patch of forest, and caught fish in a village pond during the monsoon. Over two decades the grazing ground was fenced and sold, the forest patch was cleared, and the pond silted up. Fuel and fodder that were once collected must now be bought. Work in the fields is available for only a few months in the year, and there is little other paid work in the village. Over the last five years, most young men from these households have left for construction work in a large city, returning only for festivals.
- Identify the sociological process at work in this passage, and name the specific resources whose decline set it in motion.
- Explain why the loss of these resources hurts landless households more than landowning ones.
- The men in the passage move to the city although the work there is hard and insecure. What does this tell you about the relationship between what pushes people out of a village and what pulls them to a city? [6 marks]
Read the passage and answer the questions that follow.
A district in a prosperous state records one of the highest per capita incomes in the country. Almost every household has electricity, most children are enrolled in school, and the average family now has two children rather than five. The district also has a large number of well-equipped private clinics with ultrasound machines. Yet the district’s child sex ratio, at 850 girls per 1000 boys, is far below the national figure, and it has fallen in each of the last three censuses.
- Identify the demographic indicator described here, and explain how it differs from the overall sex ratio.
- The district is prosperous, literate and well served by clinics. Explain why these facts do not, by themselves, explain the low figure — and what does.
- Name the law that addresses the practice implied in the passage, and state one reason why a law alone is unlikely to correct such a figure. [6 marks]
Read the passage and answer the questions that follow.
In a government school, a teacher finds that in one section, most children are the first in their families to attend school. Their parents cannot read the notices sent home, cannot check whether homework has been done, and rely on neighbours to fill in scholarship forms. In another section, most children have parents who completed schooling themselves. By Class 9, the second group is well ahead in results, and several children from the first group have stopped coming to school. Both groups sat in the same classrooms and were taught by the same teachers.
- The two groups received identical schooling. Explain why their outcomes differ, using a concept from this chapter.
- What does the passage suggest about the relationship between literacy and inequality across generations?
- Suggest two things a school or a state might do to interrupt this pattern, and explain the reasoning behind each suggestion. [6 marks]