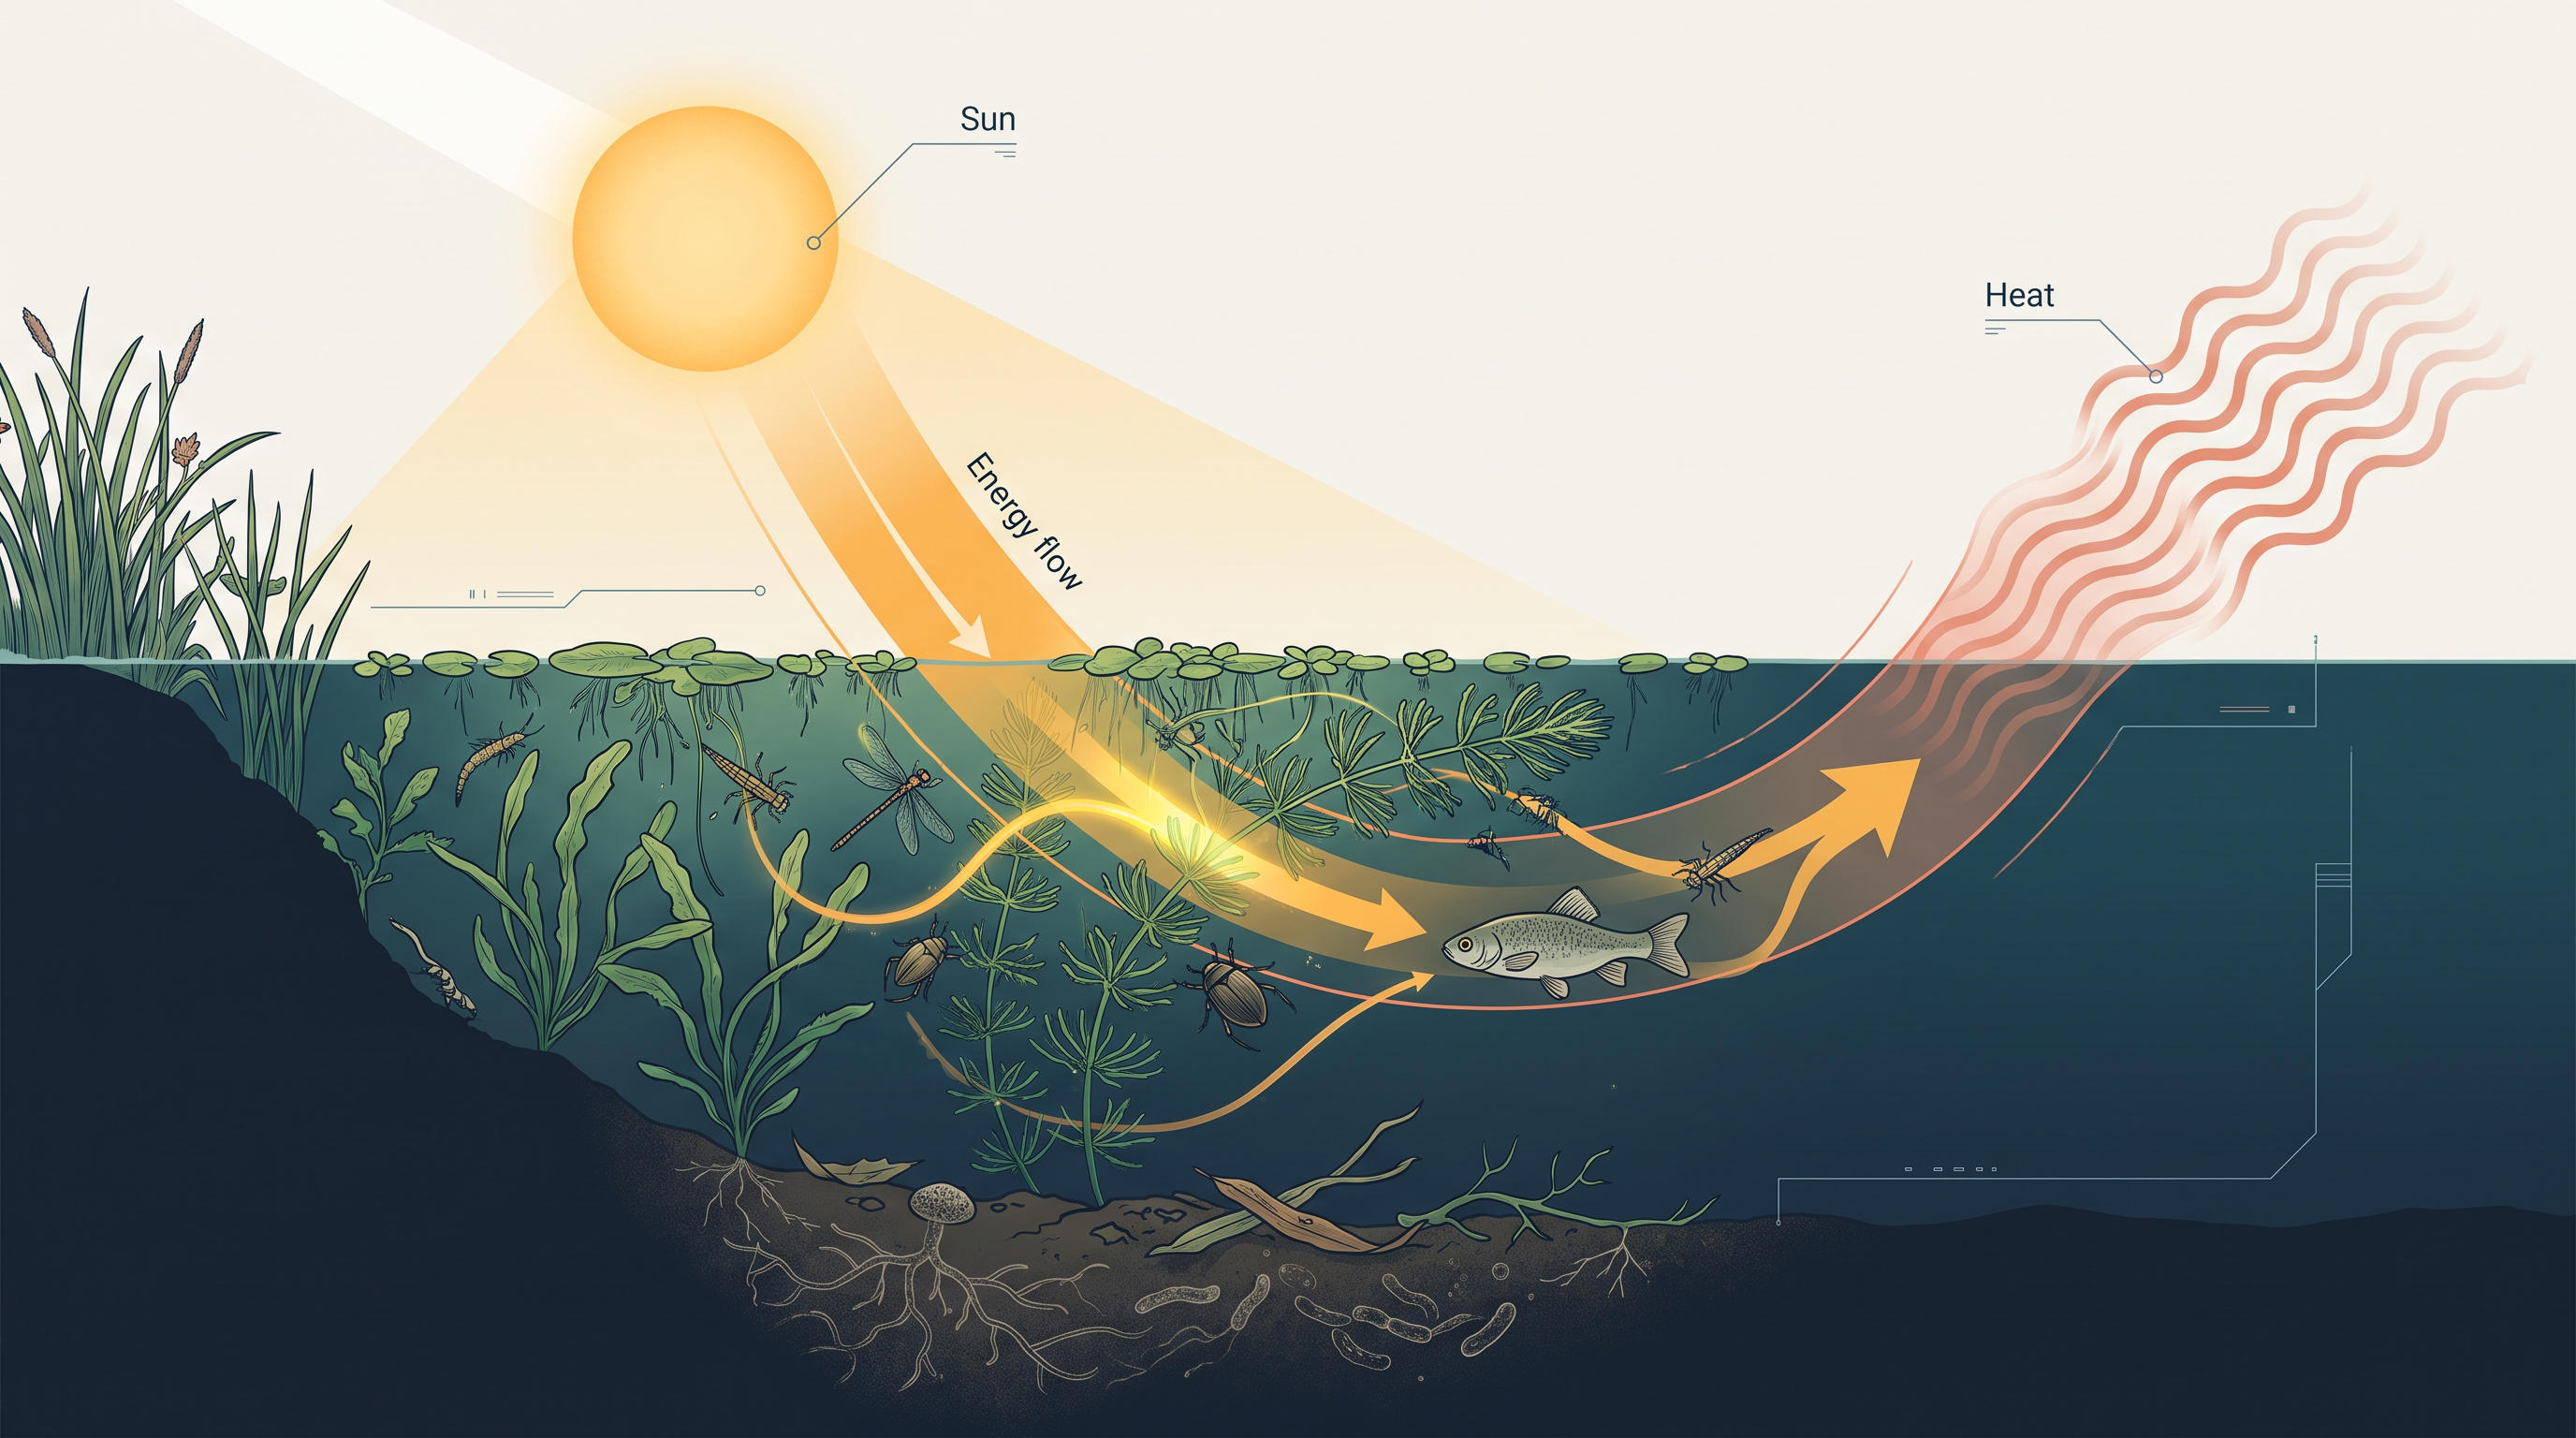
In the late 1930s, a young ecologist named Raymond Lindeman spent his days wading through the muddy waters of Cedar Bog Lake in Minnesota. Most people saw only a shallow, weed-choked pond. Lindeman saw something else — a working machine. He began to measure everything: how much sunlight the tiny floating plants captured, how much of that energy the small animals gained by eating those plants, how much the fish gained by eating those animals, and how much simply vanished as the mud swallowed the dead remains.
When he added up his numbers, a striking pattern appeared. At every step up the ladder of who-eats-whom, most of the energy was lost. Only a small fraction reached the next level. The lake was not a random jumble of living things; it was an orderly system through which energy flowed in one direction — from the sun, into plants, then to animals, and finally out as heat, never to return.
Lindeman’s idea, published in the early 1940s, changed how we look at nature. A pond, a forest, a grassland, even a crop field — each could now be understood as a single functional unit where living organisms and their non-living surroundings work together. We call such a unit an ecosystem. In this chapter, you will learn to read an ecosystem the way Lindeman read his lake.
Q1. What exactly makes a pond or a forest count as one “ecosystem,” and what are the parts that keep it running? Q2. Why can a food chain rarely have more than four or five links — why not ten or twenty? Q3. Why is the sea, which covers most of the Earth, far less productive per unit area than land? Q4. Why does the earthworm deserve to be called the “farmer’s friend”? Q5. Can a pyramid of living matter ever stand upside down, with fewer producers at the bottom than consumers above?
By the end of this chapter, you will be able to answer each of these questions with confidence.
12.1 Ecosystem – Structure and Function
In your earlier classes you met the two great halves of any environment: the abiotic (non-living) part and the biotic (living) part. The abiotic part includes things like air, water, soil, sunlight and temperature. The biotic part is every living organism — plants, animals, fungi and microbes. You also studied how these living and non-living factors act on one another. Now we look at them not as separate items but as one working whole, and we watch how energy moves through that whole.
An ecosystem is the name we give to that working whole. It is a unit of nature in which living organisms interact among themselves and with their physical surroundings.
An ecosystem is a functional unit of nature where living (biotic) organisms interact with one another and with their non-living (abiotic) environment, exchanging energy and materials.
where an ecosystem sits (Zoom out: many ecosystems together make up the biosphere — the entire living skin of the Earth. Zoom in: an ecosystem contains communities of organisms, each community made of populations, each population made of individual organisms.)
Structure of an ecosystem
When biotic and abiotic components interact, they produce a physical structure that is typical for each kind of ecosystem — a forest looks and is built differently from a desert or a pond. Two features describe this structure.
The first is species composition. If you identify and count all the plant and animal species living in an ecosystem, the list you get is that ecosystem’s species composition. It tells you who lives there.
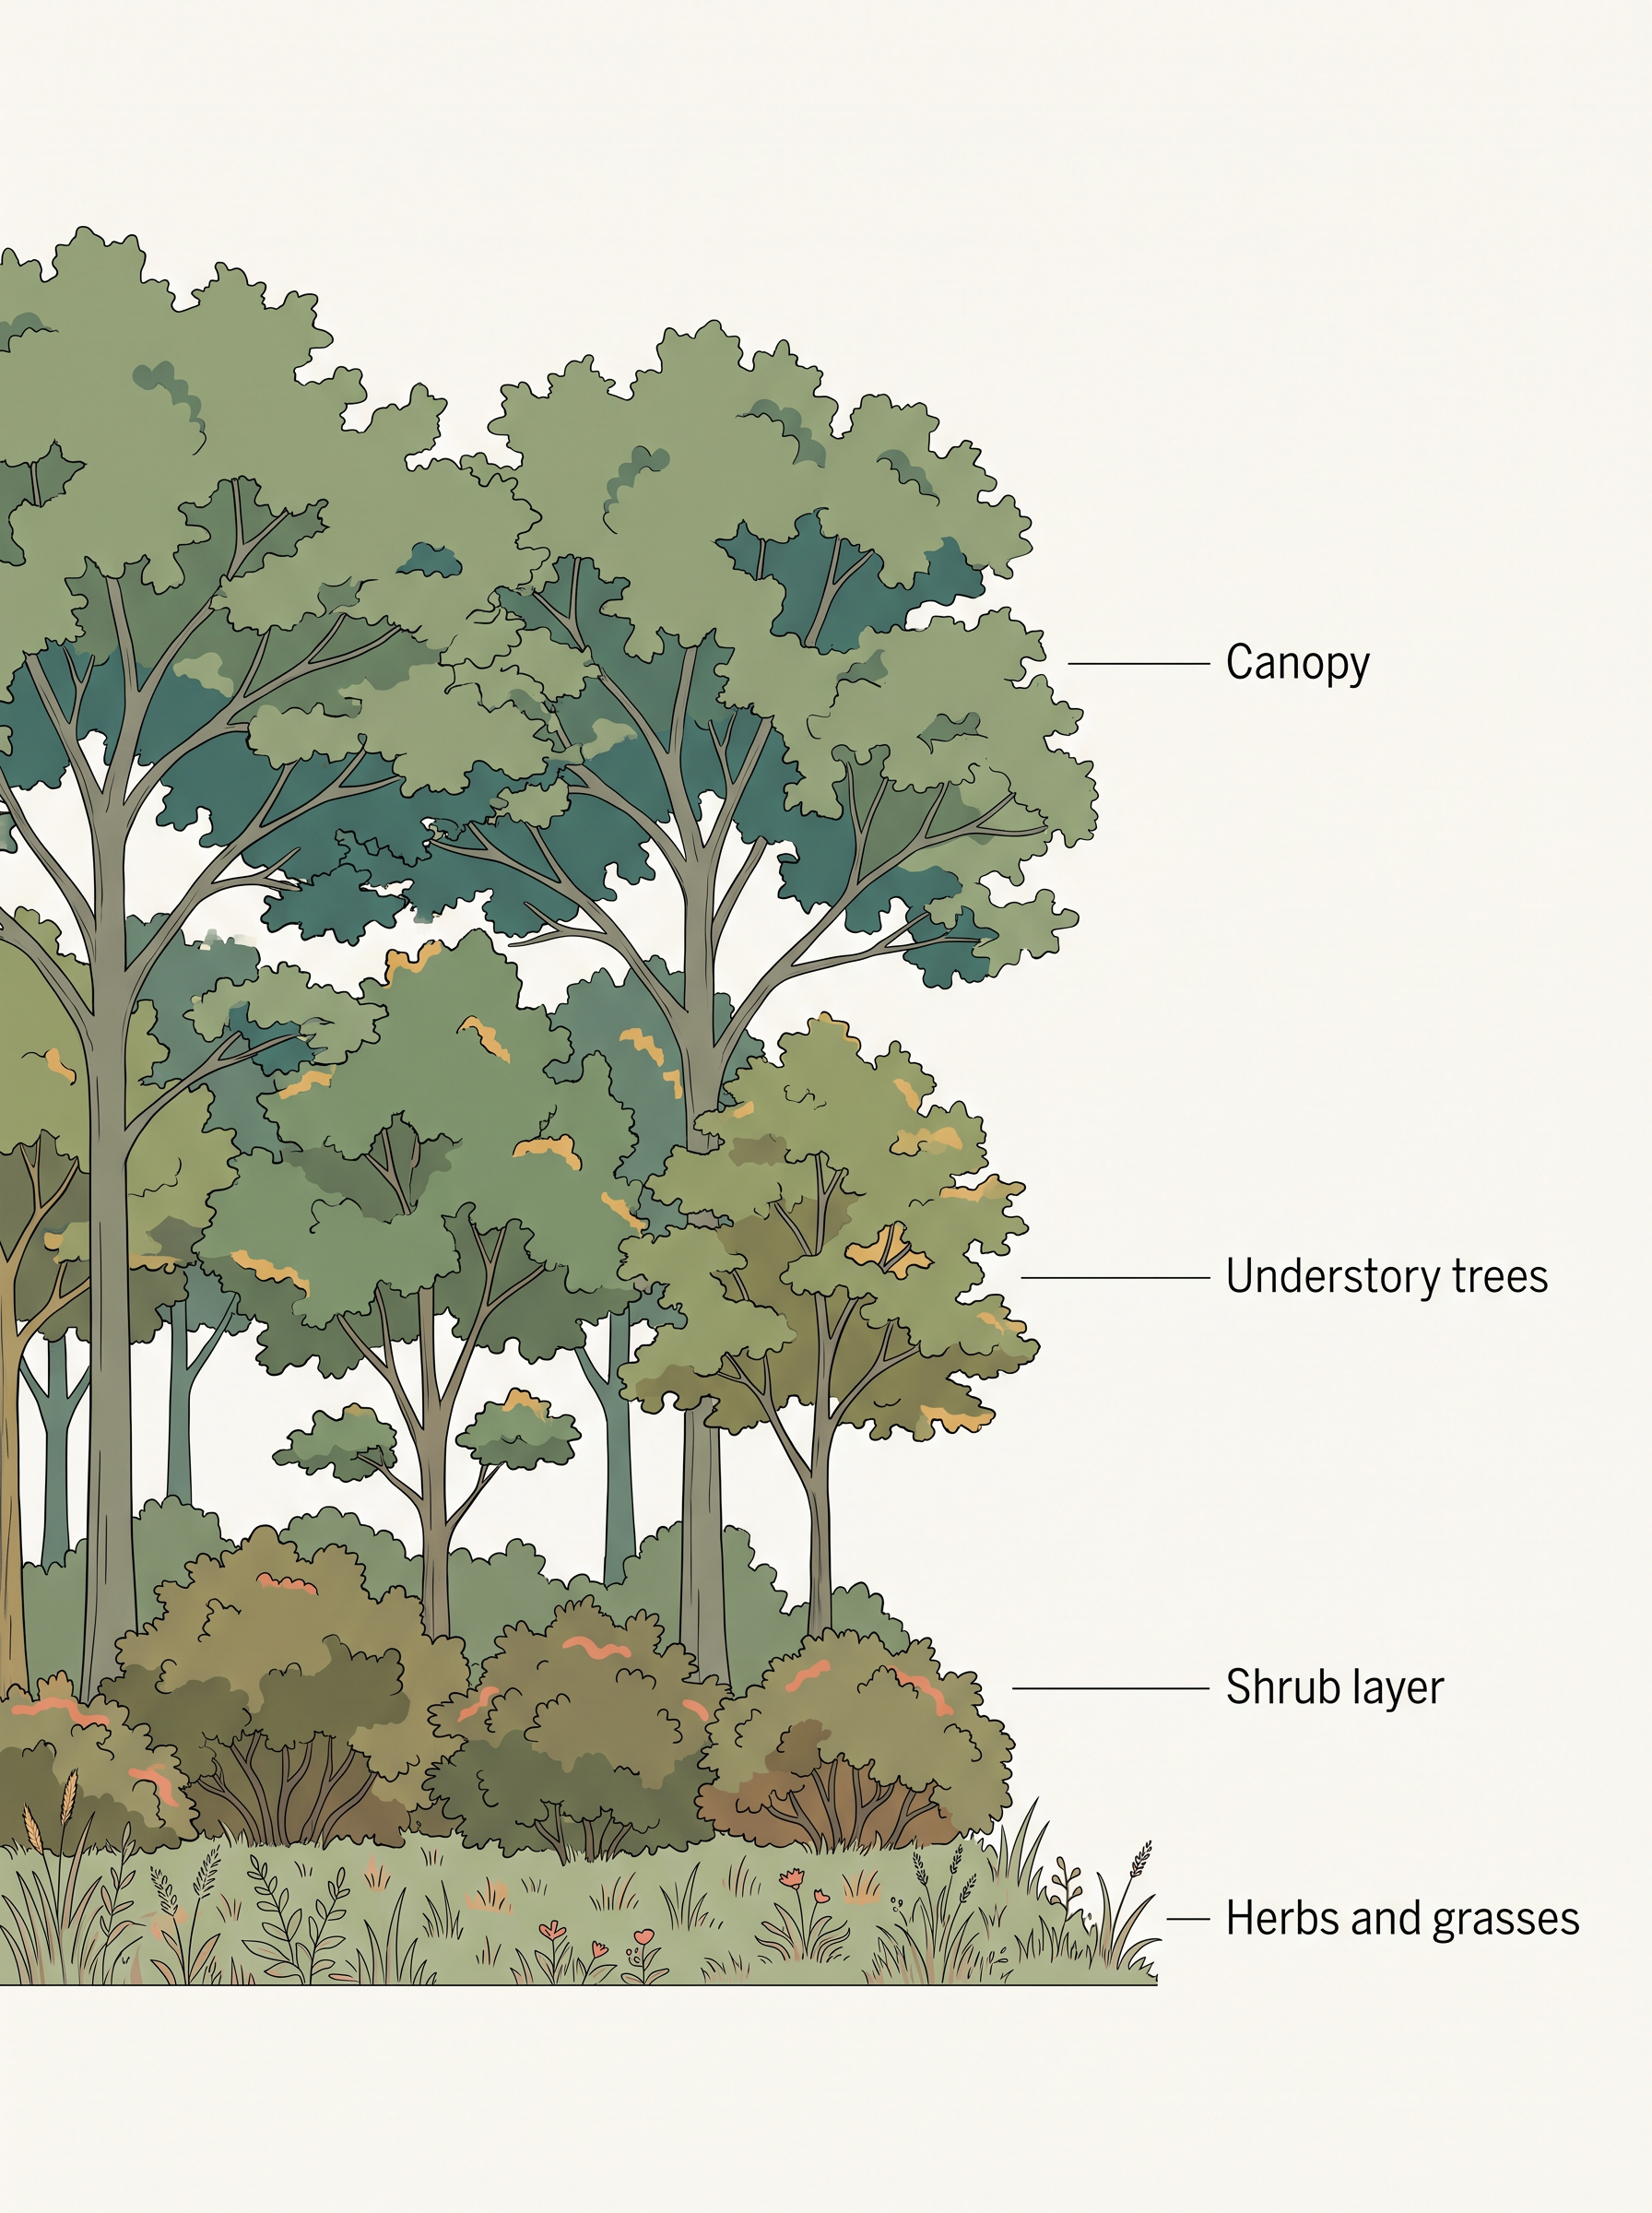
The second is stratification — the vertical arrangement of organisms in layers. In a forest, tall trees occupy the top layer, shrubs form a middle layer, and herbs and grasses cover the bottom. Each layer is a different “storey” of the same living building.
Stratification is the vertical distribution of different species occupying different levels (layers) within an ecosystem.
forest stratification (different heights of vegetation → each layer intercepts a different share of sunlight → many species share the same patch of ground without all competing for light in the same place → richer species composition.)
The four functions that make it a unit
Structure alone is not enough. An ecosystem is called a functional unit because its parts work together to carry out four processes. Whenever these four are running, a collection of organisms and their surroundings is behaving as one ecosystem. The four functional aspects are productivity, decomposition, energy flow and nutrient cycling.
Each of these has its own section ahead: productivity in 12.2, decomposition in 12.3, and energy flow in 12.4, with the pyramids that summarise them in 12.5.
Q1. What exactly makes a pond or a forest count as one “ecosystem,” and what are the parts that keep it running?
A. It counts as one ecosystem because its living organisms and non-living surroundings interact as a single functional unit. The parts that keep it running are its structure (species composition and stratification) and its four functions — productivity, decomposition, energy flow and nutrient cycling.
A pond as a model ecosystem
To feel how an ecosystem actually works, take a small pond. A pond is one of the simplest self-sustaining systems in nature, yet even in this small, shallow water body all four basic components of an ecosystem are clearly on display. Studying it is like studying a scale model of the whole biosphere.
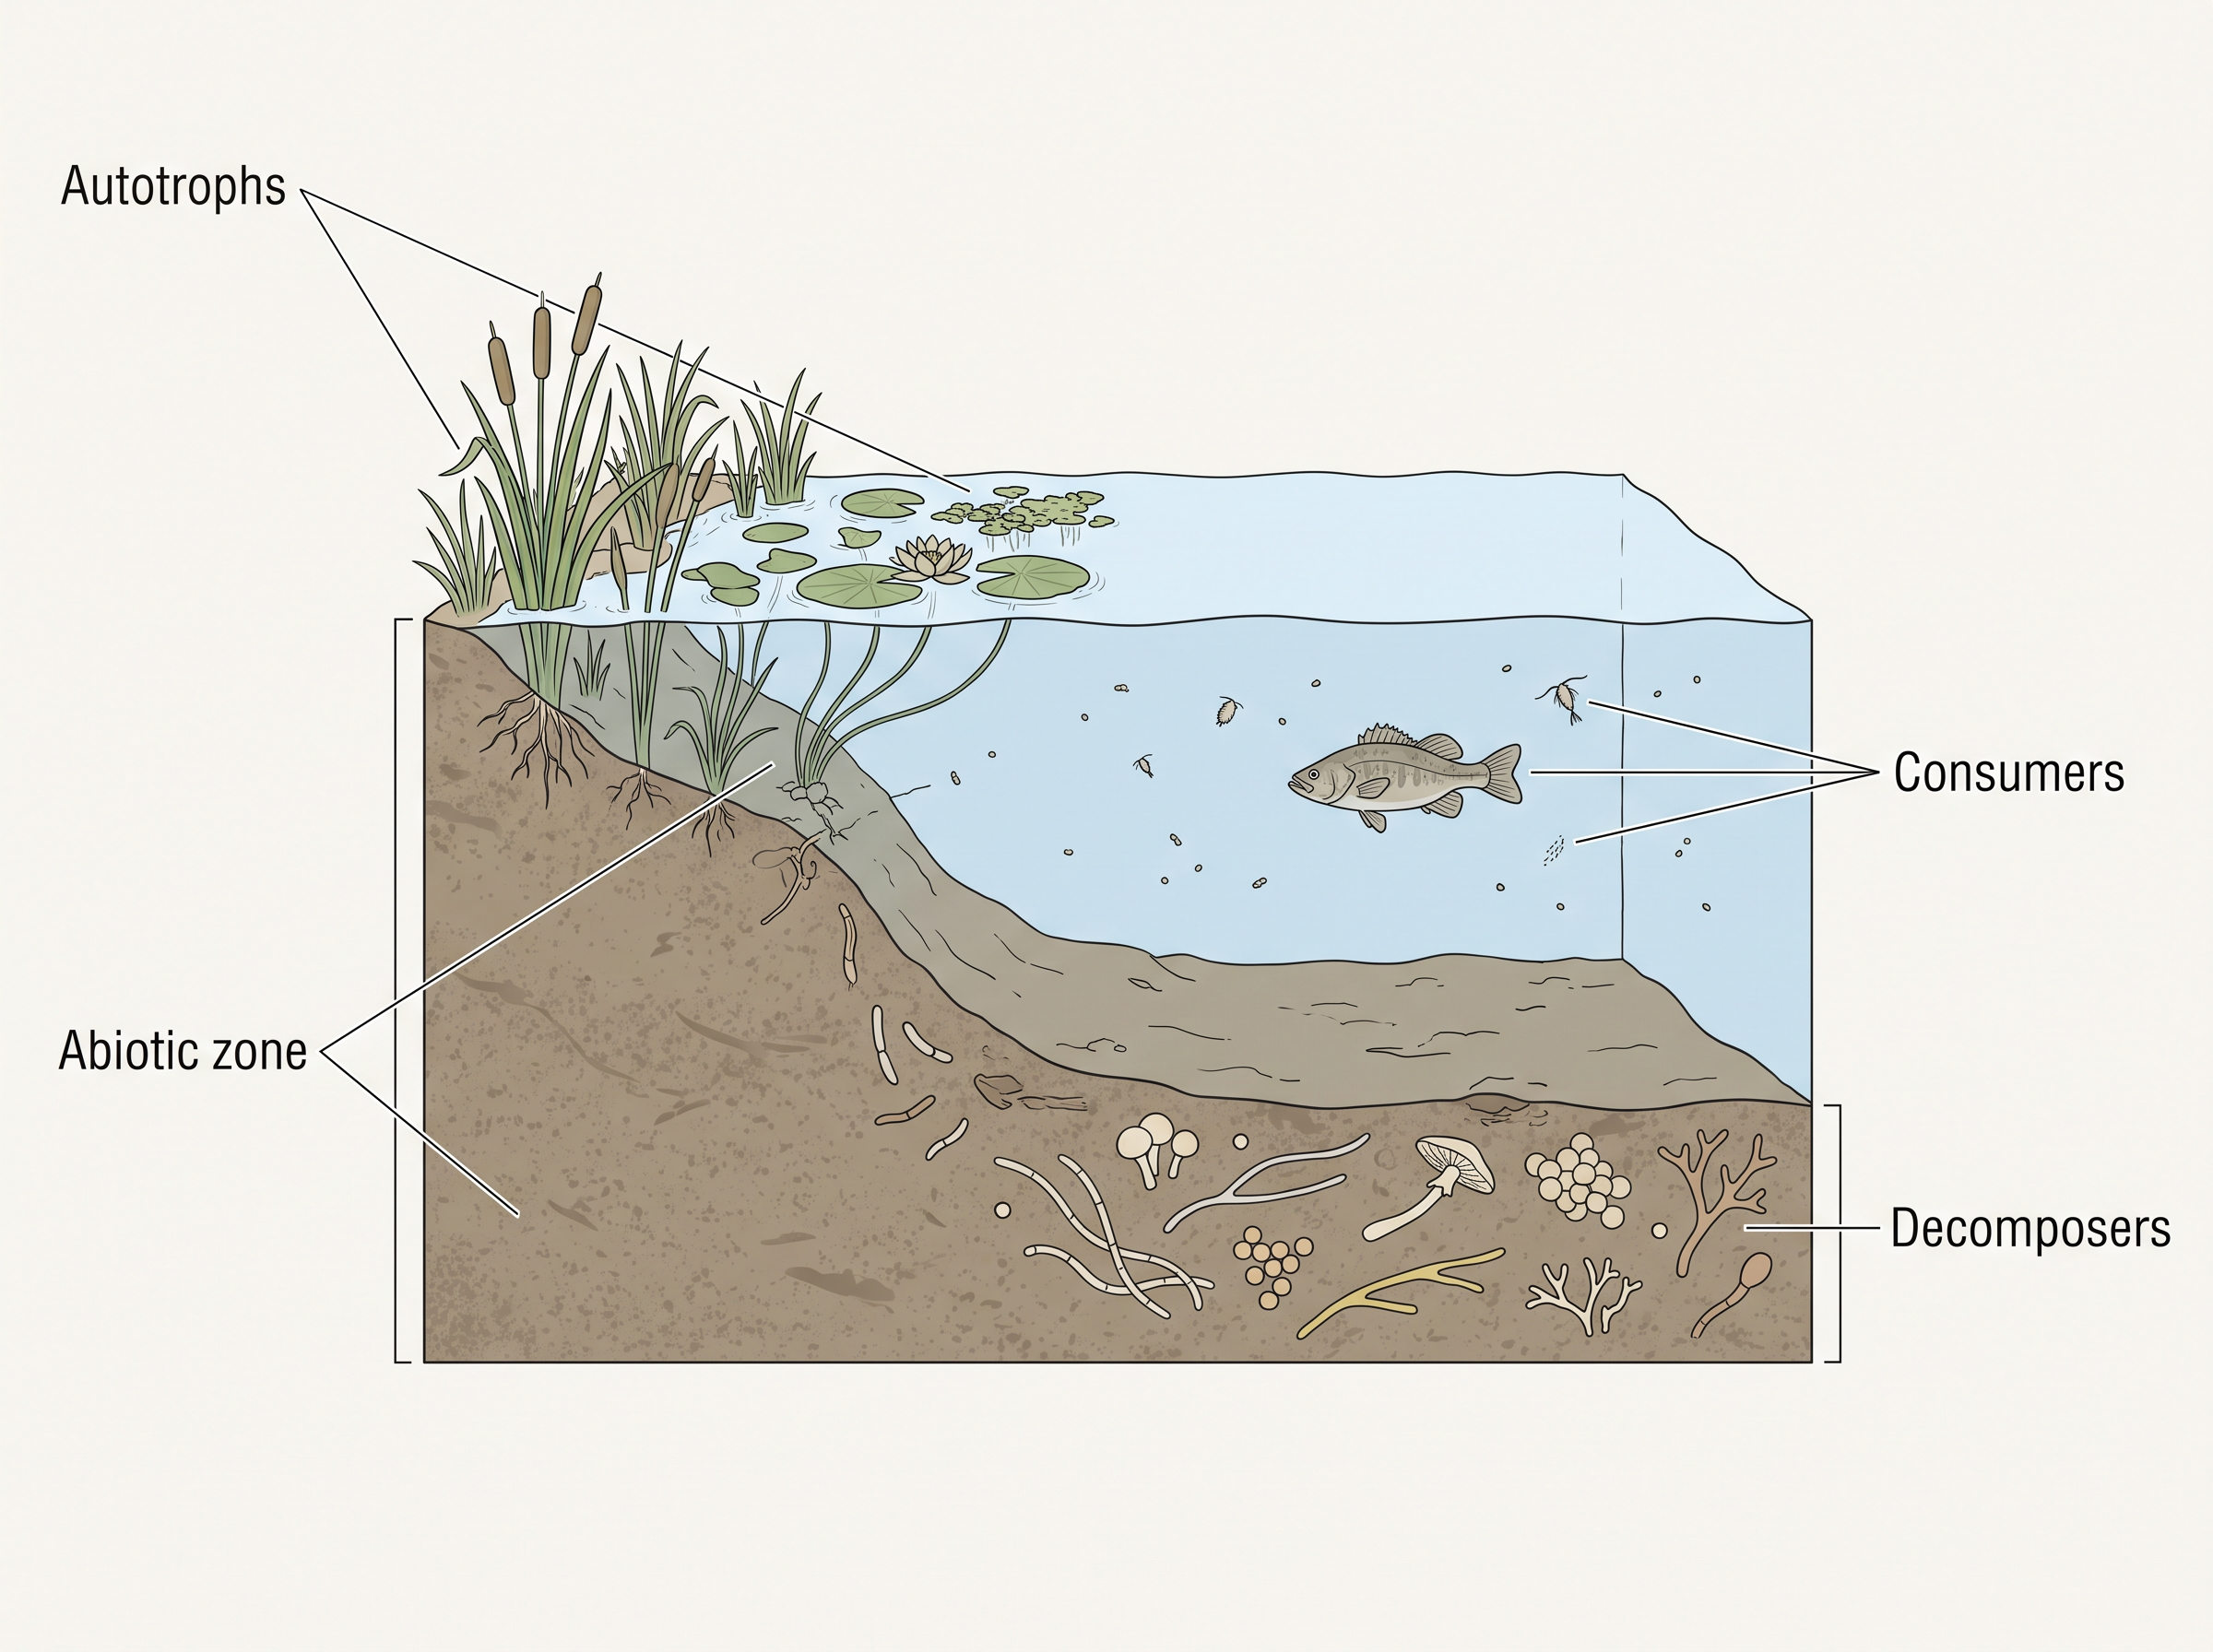
The abiotic component of the pond is the water itself, together with all the inorganic and organic substances dissolved in it and the rich soil deposited at the bottom. The physical conditions — the amount of solar energy entering, the cycle of temperature, the length of the day and the local climate — regulate how fast the whole pond functions.
The living organisms of the pond fall into three groups by the role they play. The autotrophs (“self-feeders”) are the producers: the phytoplankton, some algae, and the floating, submerged and marginal plants at the edges. These are the only members that can capture the sun’s energy and build food.
The consumers, or heterotrophs (“other-feeders”), are represented by the zooplankton and by the free-swimming and bottom-dwelling animals that feed on the producers or on one another.
The decomposers are the fungi, bacteria and flagellates, especially abundant in the mud at the bottom, which break down dead matter.
What the pond tells us about every ecosystem
This little system performs every function that any ecosystem — and the biosphere as a whole — performs. Autotrophs use the radiant energy of the sun to convert inorganic material into organic material. Heterotrophs consume those autotrophs. Decomposers break down and mineralise the dead matter, releasing simple substances back into the water and soil so the autotrophs can use them again. This loop of events is repeated over and over.
There is one crucial difference between matter and energy in this loop. Nutrients travel in a circle — used, released and reused. Energy does not. It moves in one direction only: from the sun to the producers, then to consumers at higher trophic levels, and finally it is dissipated and lost as heat to the environment. This one-way street of energy is a theme we will return to again and again.
nutrient cycling vs energy flow (Nutrients are recycled — the same phosphorus or carbon atom can be reused endlessly. Energy is not recycled — it flows through once and leaves the system as heat.)
A home aquarium is a man-made pond ecosystem. It survives only when the same three biotic roles are present: plants or algae as producers, fish as consumers, and beneficial bacteria in the filter and gravel as decomposers. If the “cleanup crew” of bacteria is missing, wastes build up and the water turns toxic — a direct lesson in why decomposition is one of the four essential functions.
12.2 Productivity
Every ecosystem runs on borrowed energy from the sun. A constant input of solar energy is the basic requirement for any ecosystem to function and to keep going. The plants capture this energy and turn it into food, and the total amount of food they build is what we measure as productivity.
Primary production and productivity
Primary production is the amount of biomass, or organic matter, produced per unit area over a period of time by plants during photosynthesis. Here biomass simply means the total mass of living material.
Primary production can be measured in two ways: by weight, as grams per square metre (\(\\text{g m}^{-2}\)), or by the energy it holds, as kilocalories per square metre (\(\\text{kcal m}^{-2}\)).
Primary production is the amount of biomass or organic matter produced per unit area over a time period by plants during photosynthesis.
The rate at which this biomass is produced is called productivity. Because it is a rate, it always carries a “per year” in its units — \(\\text{g m}^{-2},\\text{yr}^{-1}\) or \((\\text{kcal m}^{-2}),\\text{yr}^{-1}\) — which lets us compare one ecosystem’s output with another’s on a fair, common footing.
production vs productivity (Production is the amount of biomass made — measured in \(\\text{g m}^{-2}\). Productivity is the rate of making it — measured in \(\\text{g m}^{-2},\\text{yr}^{-1}\). The “per year” is what turns production into productivity.)
Gross and net primary productivity
Primary productivity is divided into two types. Gross primary productivity (GPP) is the rate at which producers make organic matter during photosynthesis — the grand total they capture.
But plants do not keep all of it. They are living organisms that respire, and a considerable amount of the GPP is spent in respiration (R) to run their own life processes. What is left after this respiratory loss is the net primary productivity (NPP):
\[\\text{GPP} - \\text{R} = \\text{NPP}\]
Here GPP is the total organic matter produced, R is the amount used up in respiration, and NPP is the amount that actually remains as new plant biomass. It is this net amount that is available as food for the heterotrophs — the herbivores that eat plants and the decomposers that break them down.
Gross primary productivity (GPP) is the rate of production of organic matter by producers during photosynthesis. Net primary productivity (NPP) is the GPP left after subtracting respiratory losses (R), and is the biomass available to heterotrophs.
GPP vs NPP
| Meaning |
Total organic matter made in photosynthesis |
Organic matter left after respiration |
| Relation |
The starting total |
\(\\text{GPP} - \\text{R}\) |
| Includes respiration loss? |
Yes, it is the full amount before loss |
No, respiration already removed |
| Available to consumers? |
Not directly |
Yes — this is the food supply for heterotrophs |
In a grassland, the gross primary productivity of the vegetation is \(2400\\ \\text{g m}^{-2},\\text{yr}^{-1}\) and the plants use \(1000\\ \\text{g m}^{-2},\\text{yr}^{-1}\) in respiration. Calculate the net primary productivity.
Productivity of consumers
Just as producers build primary biomass, consumers build their own new tissue when they grow. Secondary productivity is the rate of formation of new organic matter by the consumers.
Secondary productivity is the rate of formation of new organic matter by consumers (heterotrophs).
What decides how productive an ecosystem is
Primary productivity is not the same everywhere. It depends first on the plant species that inhabit a particular area, because different plants photosynthesise at different rates. It also depends on a range of environmental factors, on the availability of nutrients in the soil or water, and on the photosynthetic capacity of the plants themselves. Because all of these differ from place to place, primary productivity varies widely from one type of ecosystem to another.
Adding it all up, the annual net primary productivity of the whole biosphere is approximately 170 billion tons (dry weight) of organic matter. Of this enormous total, the oceans contribute only about 55 billion tons — even though they cover roughly 70 per cent of the Earth’s surface. The rest is produced on land.
The oceans occupy about 70 per cent of the Earth’s surface yet produce far less biomass per unit area than land. Discuss the main reason for this low productivity of the ocean with your teacher.
Q3. Why is the sea, which covers most of the Earth, far less productive per unit area than land?
A. Productivity depends on light, nutrients and photosynthetic plants. Sunlight reaches only the top few metres of water, so producers can grow only in a thin surface layer, while the vast deep ocean is dark. The open ocean is also poor in dissolved nutrients such as nitrogen. With light and nutrients both limited over most of its area, the ocean produces less biomass per unit area than nutrient-rich, well-lit land — which is why it yields only 55 of the biosphere’s 170 billion tons despite covering 70 per cent of the surface.
The idea of NPP is not just theory — it decides how much food an ecosystem can hand up the chain to us. A well-managed crop field, a highly productive man-made ecosystem, is essentially an attempt to push NPP as high as possible through irrigation, fertilisers and high-yielding varieties, so that more biomass is available for human use.
12.3 Decomposition
You may have heard the earthworm called the farmer’s “friend.” The reason is that earthworms break down complex organic matter and, at the same time, loosen the soil as they burrow. In much the same way, a whole army of decomposers breaks down complex organic matter into simple inorganic substances such as carbon dioxide, water and mineral nutrients. This breakdown process is called decomposition.
Decomposition is the process by which decomposers break down complex organic matter (detritus) into simpler inorganic substances such as carbon dioxide, water and nutrients.
The raw material: detritus
Decomposition needs something to work on. That raw material is detritus — the dead remains of organisms. It includes fallen leaves, bark and flowers, along with the dead bodies of animals and their faecal (waste) matter.
Detritus is the dead plant and animal matter — such as leaves, bark, flowers, dead animal remains and faecal matter — that serves as the raw material for decomposition.
Charles Darwin, best known for his theory of evolution, spent the last years of his life studying earthworms. In the early 1880s he published an entire book on how worms, by dragging leaves underground and passing soil through their bodies, slowly build up fertile topsoil. He estimated that worms could turn over many tonnes of earth per acre each year — quiet, patient proof of why the earthworm earns its title.
The steps of decomposition
Decomposition is not a single action but a set of processes: fragmentation, leaching, catabolism, humification and mineralisation. The order is shown in FC 12.3.
In fragmentation, detritivores — animals such as the earthworm that feed on detritus — break the detritus into smaller particles. This increases the surface area available for microbes to act on.
In leaching, water-soluble inorganic nutrients seep down into the soil horizon (the layers of the soil) and there get precipitated as salts that plants cannot easily take up.
In catabolism, enzymes released by bacteria and fungi degrade the detritus into simpler inorganic substances.
It is important to note that these steps do not happen one strictly after another. Fragmentation, leaching and catabolism all operate simultaneously on the same detritus, as summarised in Fig. 12.3.
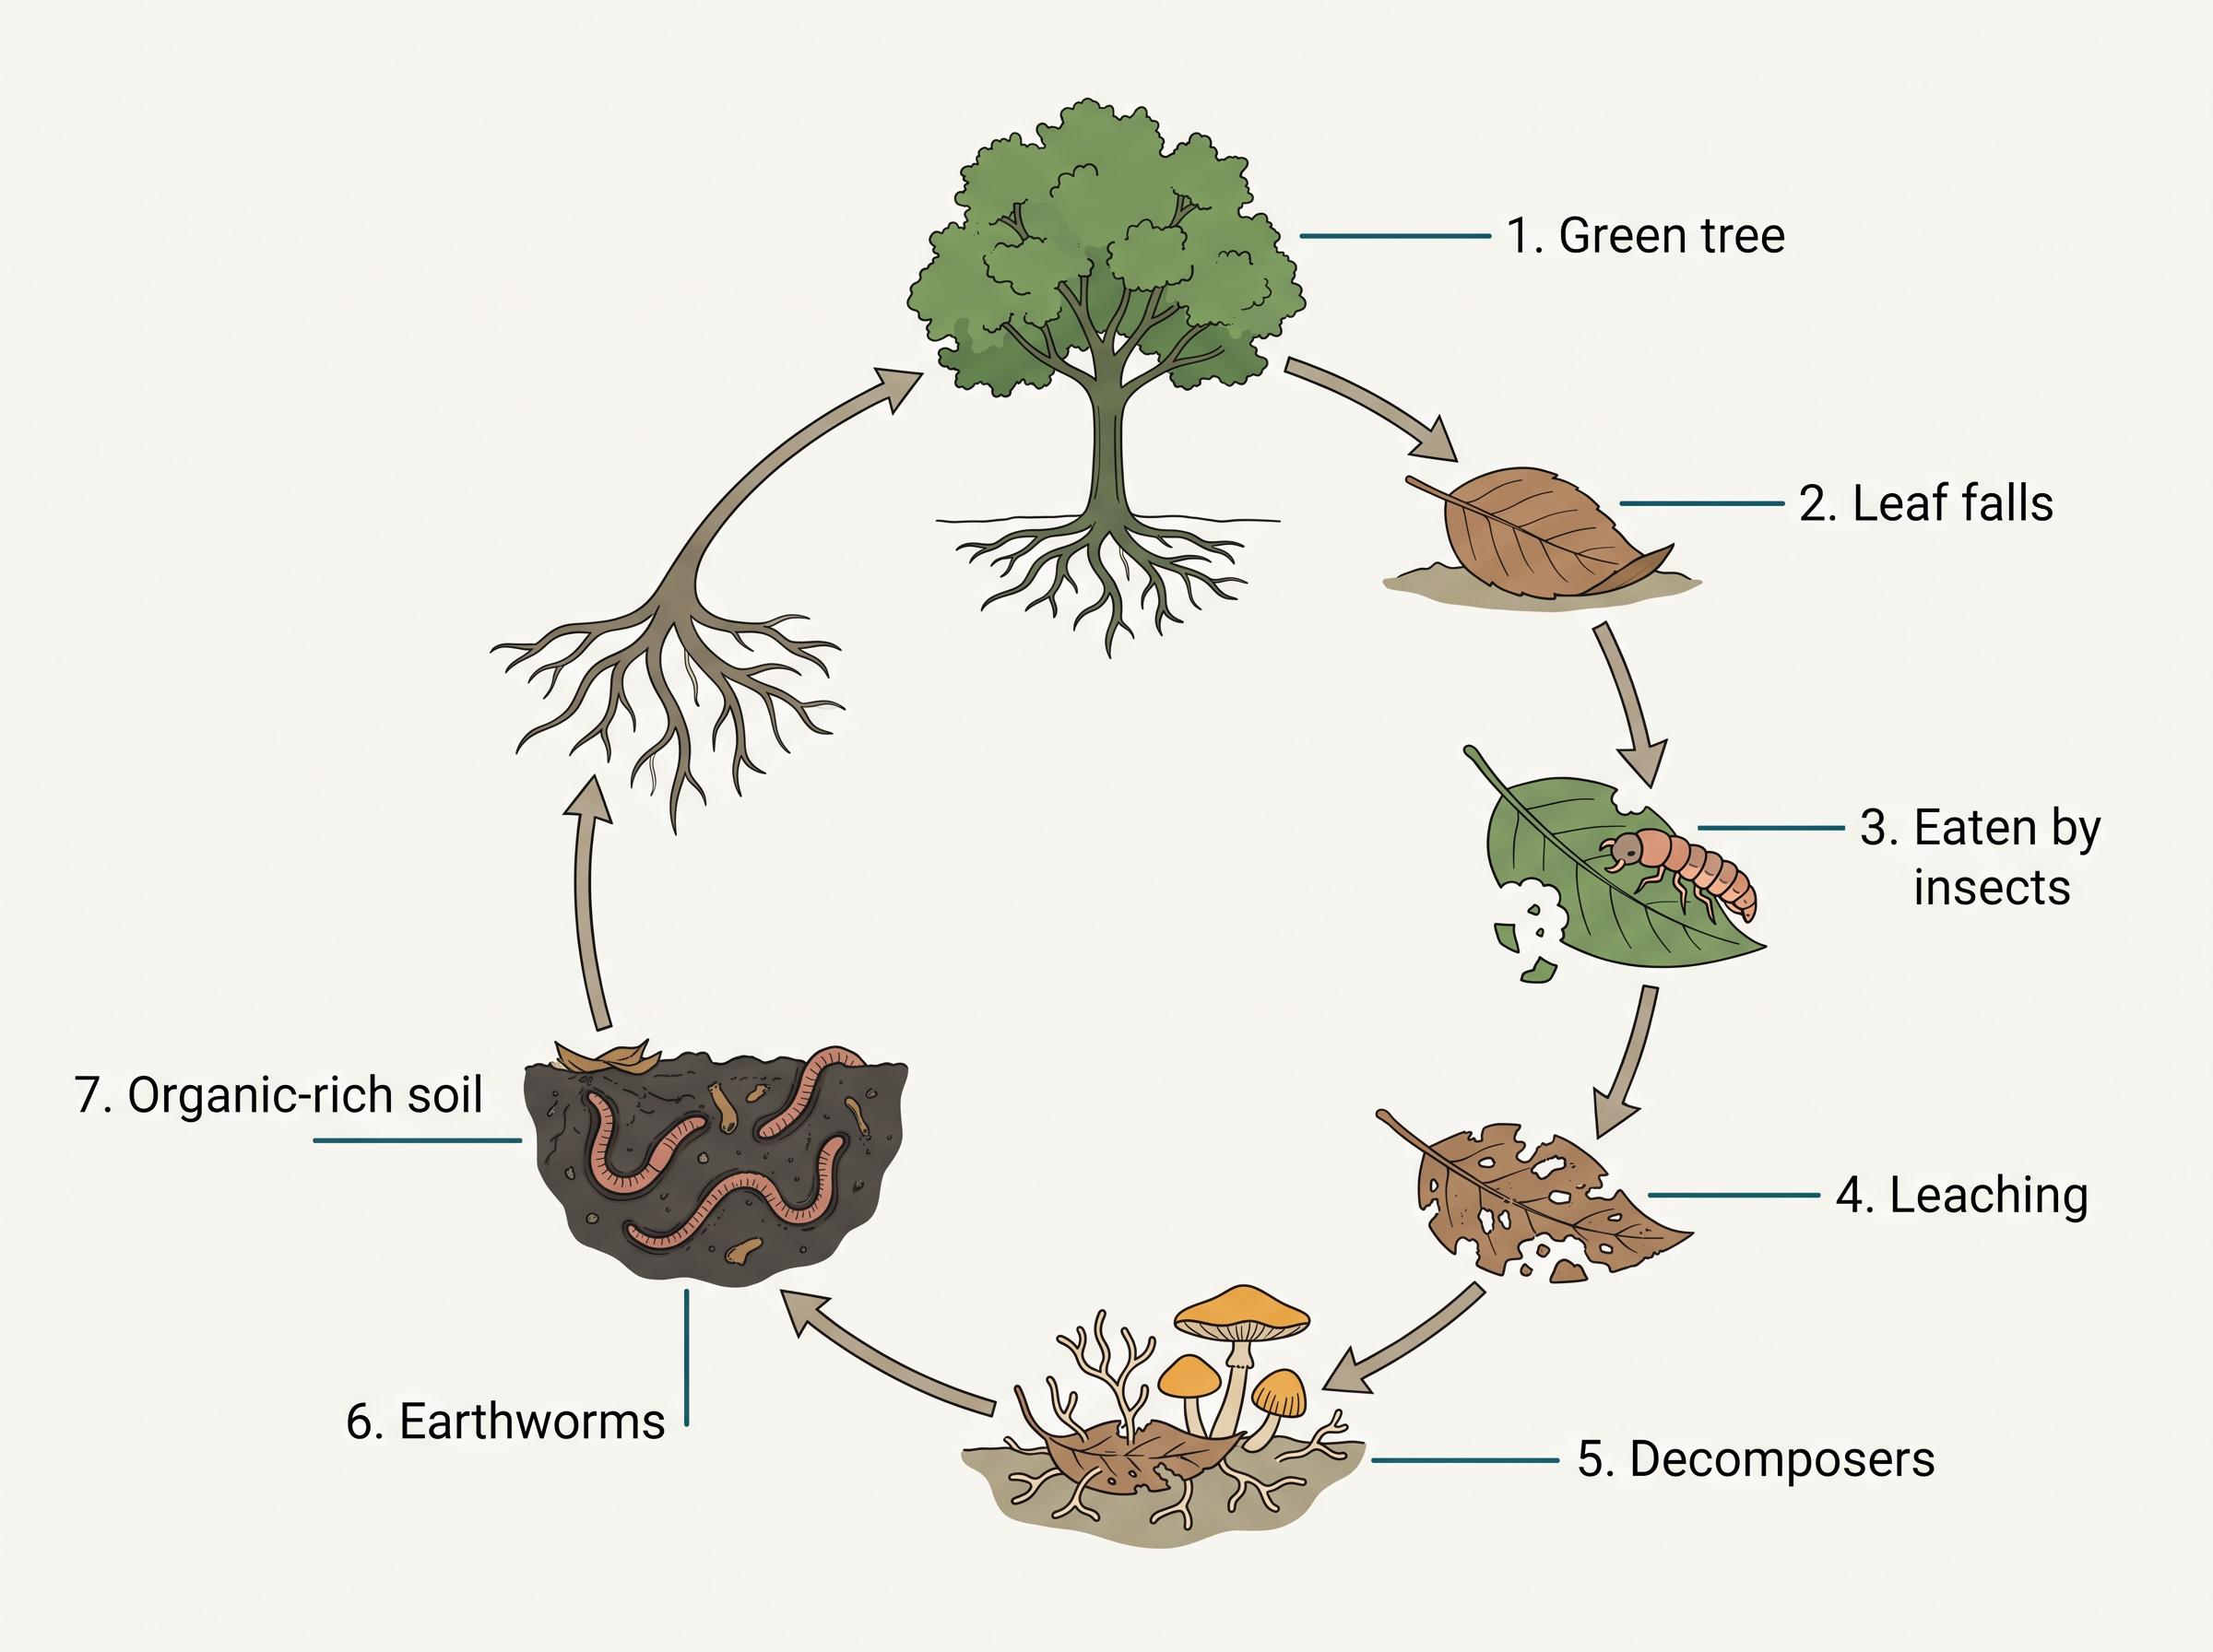
order of the five decomposition steps (“Friendly Little Creatures Help Minerals” — Fragmentation, Leaching, Catabolism, Humification, Mineralisation.)
Humification and mineralisation
The last two steps, humification and mineralisation, occur within the soil.
Humification leads to the build-up of a dark-coloured, amorphous (shapeless) substance called humus. Humus is highly resistant to the action of microbes, so it decomposes only at an extremely slow rate. Because it is colloidal in nature, it acts as a reservoir of nutrients, holding them in the soil.
Humus is a dark, amorphous, colloidal substance formed during decomposition; it resists microbial breakdown, decomposes very slowly, and serves as a nutrient reservoir in the soil.
Eventually, some microbes degrade even the humus, and the inorganic nutrients locked inside it are released. This final release of inorganic nutrients is called mineralisation. The freed nutrients return to the soil, ready to be taken up again by plants — completing the loop.
Q4. Why does the earthworm deserve to be called the “farmer’s friend”?
A. The earthworm is a detritivore that carries out fragmentation — it breaks dead organic matter into small pieces, greatly speeding up decomposition. As it burrows, it also loosens and aerates the soil and mixes organic matter through it, building fertile topsoil. By turning dead remains back into plant-usable nutrients and improving soil structure, it directly boosts the fertility a farmer depends on.
What controls the rate of decomposition
Decomposition is largely an oxygen-requiring (aerobic) process. How fast it goes is controlled by two things: the chemical composition of the detritus and the climatic conditions.
The chemistry of the detritus matters because different substances resist breakdown differently. In a given climate, decomposition is slower if the detritus is rich in tough materials like lignin and chitin, and quicker if it is rich in nitrogen and in water-soluble substances such as sugars.
Among the climatic factors, temperature and soil moisture are the most important, because they control the activity of the soil microbes that do the work. A warm and moist environment favours rapid decomposition. In contrast, low temperature and anaerobiosis (lack of oxygen) inhibit decomposition — which is why, in cold or waterlogged places, organic material tends to build up instead of breaking down.
This is exactly why a compost pit is kept warm, moist and turned over for air: those conditions push decomposition to its fastest. It is also why peat bogs — cold, waterlogged and oxygen-poor — accumulate thick layers of undecomposed plant matter over thousands of years, the very opposite of a compost pit.
how detritus chemistry changes decomposition speed (If you compared two litter samples in the same warm, moist site — one rich in sugars and nitrogen, the other rich in lignin and chitin — the sugar-and-nitrogen sample would break down far faster. The trend shows that “easy” carbon and nitrogen are used quickly by microbes, while structural compounds slow them down; so litter quality, not just climate, sets the pace.)
12.4 Energy Flow
With one striking exception — the deep-sea hydro-thermal vent ecosystems that run on chemical energy from the Earth’s interior — the sun is the only source of energy for all ecosystems on Earth. Understanding an ecosystem, then, largely means understanding how the sun’s energy is captured and how it moves from one organism to the next.
How little of the sunlight is actually used
Not all sunlight is usable by life. Of the total solar radiation that reaches the Earth, less than 50 per cent is photosynthetically active radiation (PAR) — the portion of light with wavelengths that plants can actually use for photosynthesis.
Photosynthetically active radiation (PAR) is the fraction of incident solar radiation (less than 50 per cent) that autotrophs can use to carry out photosynthesis.
Plants and photosynthetic bacteria are autotrophs: they fix the sun’s radiant energy to build food from simple inorganic materials. Yet even of the PAR available to them, plants capture only about 2 to 10 per cent. It is astonishing that this small sliver of the sun’s energy is enough to sustain the entire living world.
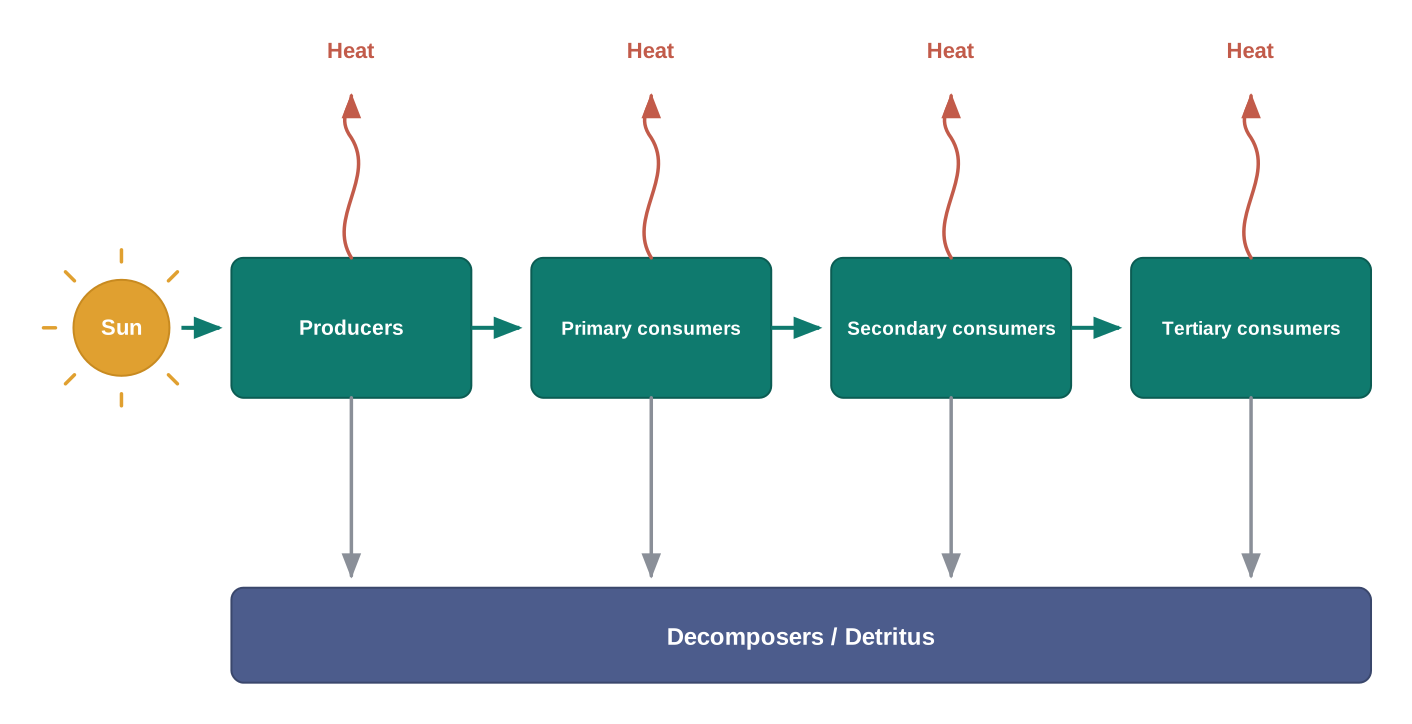
Because everything else depends on this captured energy, it becomes very important to trace how it flows through the different organisms of an ecosystem. Every organism depends for its food on producers, either directly or indirectly. So we see a unidirectional (one-way) flow of energy: from the sun, to the producers, and then to the consumers.
Ecosystems are also not exempt from the second law of thermodynamics. That law describes a universal tendency toward increasing disorder. To build and maintain their complex, ordered molecules, living things must constantly spend energy to push back against this drift toward disorder — which is why an ecosystem needs a continuous supply of energy from the sun, not a one-time dose.
Producers: where energy enters
The green plants of an ecosystem are called producers, because they produce the food on which everything else feeds. In a terrestrial ecosystem, the major producers are herbaceous and woody plants. In an aquatic ecosystem, the producers are various species such as phytoplankton, algae and higher plants.
Producers are autotrophic green plants that capture solar energy and manufacture food, forming the base of every food chain.
Food chains and food webs
You have already read about food chains and webs. Starting from the plants (the producers), chains — or, more realistically, webs — are formed in which an animal feeds on a plant or on another animal and, in turn, becomes food for yet another. This mutual “who-eats-whom” dependency is what links organisms into a chain or web.
No energy that is trapped inside an organism stays there forever. The energy captured by a producer is either passed on to a consumer that eats it, or the organism dies. And the death of an organism is not an end — it is the beginning of the detritus food chain.
Consumers and their categories
All animals depend on plants, directly or indirectly, for their food. They are therefore called consumers, and also heterotrophs (organisms that cannot make their own food).
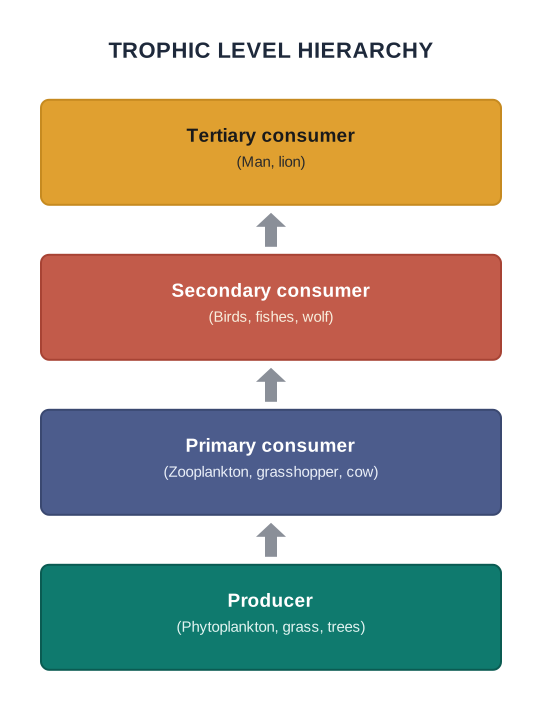
Consumers are ranked by what they eat. Those that feed directly on producers are primary consumers; those that eat animals which themselves ate plants are secondary consumers; and you can go further to tertiary consumers.
The primary consumers are, of course, herbivores (plant-eaters). Common herbivores are insects, birds and mammals on land, and molluscs in water.
Consumers that feed on these herbivores are carnivores — more precisely, primary carnivores (though, in the consumer ranking, they are secondary consumers). Animals that depend on the primary carnivores for food are the secondary carnivores.
“consumer” ranking vs “carnivore” ranking (The two ladders count from different starting points. A primary carnivore is a secondary consumer — the first meat-eater is still the second link that eats. Read carefully which ladder a question is using; this is a common NEET trap.)
A simple grazing food chain (GFC) shows the idea directly:
The detritus food chain
The detritus food chain (DFC) begins not with living plants but with dead organic matter. It is made up of decomposers — heterotrophic organisms, mainly fungi and bacteria — which meet their energy and nutrient needs by degrading dead organic matter, or detritus.
These decomposers are also known as saprotrophs (from sapro, meaning “to decompose”). They secrete digestive enzymes that break down dead and waste materials into simple inorganic substances, which they then absorb.
The two chains carry different shares of energy in different ecosystems. In an aquatic ecosystem, the grazing food chain is the major conduit for energy flow. In a terrestrial ecosystem, by contrast, a much larger fraction of energy flows through the detritus food chain than through the GFC.
Grazing food chain vs Detritus food chain
| Starts with |
Living producers (green plants) |
Dead organic matter (detritus) |
| Key organisms |
Herbivores and carnivores |
Decomposers/saprotrophs (fungi, bacteria) |
| Energy source |
Sun, via photosynthesis |
Detritus (dead and waste matter) |
| Dominant in |
Aquatic ecosystems |
Terrestrial ecosystems |
The two are not sealed off from each other. A detritus food chain may connect with a grazing food chain at several points: some DFC organisms are prey to GFC animals, and in a natural ecosystem some animals — cockroaches, crows and the like — are omnivores that eat both plant and animal matter. These natural interconnections turn simple chains into a food web.
food chain vs food web (A food chain is a single straight-line sequence of who-eats-whom. A food web is many food chains interconnected — a more realistic picture, since almost no organism eats only one kind of food.)
Given that humans eat both plants and animals, how would you classify human beings in these feeding categories?
Trophic levels
Every organism occupies a place in its community according to its feeding relationship with others. Based on where it sits in the food chain — that is, on the source of its nutrition — an organism is assigned a trophic level.
A trophic level is the feeding position an organism occupies in a food chain, based on the source of its nutrition.
Producers belong to the first trophic level, herbivores (primary consumers) to the second, and carnivores (secondary consumers) to the third, as shown in Fig. 12.4.
Energy decreases at every level
The most important point about energy flow is that the amount of energy decreases at each successive trophic level. Organisms at every level depend on those at the level below for their energy. And when any organism dies, it becomes detritus — dead biomass that serves as an energy source for the decomposers.
Each trophic level holds a certain mass of living material at any given time, called the standing crop. The standing crop is measured either as the mass of living organisms (their biomass) or as the number of organisms in a unit area. Biomass can be given as fresh weight or dry weight.
Standing crop is the amount of living material (biomass or number of organisms) present at a trophic level at a given time, per unit area.
The 10 per cent law and why chains are short
Why can’t a food chain go on for a dozen links? The answer lies in how little energy survives each transfer. The number of trophic levels in a grazing food chain is restricted because energy transfer follows the 10 per cent law — only about 10 per cent of the energy at one trophic level is passed on to the next.
10 per cent law: only about 10 per cent of the energy present at one trophic level is transferred to the next higher trophic level; the remaining 90 per cent is lost, largely as heat.
Because so much is lost at every step, the energy left after four or five transfers is too small to support another full trophic level. This is exactly why, in nature, a grazing food chain typically runs only through producer, herbivore, primary carnivore and secondary carnivore, as illustrated in Fig. 12.5.
Q2. Why can a food chain rarely have more than four or five links — why not ten or twenty?
A. Because energy flow obeys the 10 per cent law: only about a tenth of the energy at each trophic level passes to the next, and the rest is lost as heat. After just four or five steps, so little of the original energy remains that it can no longer support another level of consumers — so the chain simply runs out of usable energy.
a unit of the sun’s energy through a grazing food chain
- Sunlight falls on grass; the grass captures only about 2–10 per cent of the PAR and stores it as chemical energy (first trophic level).
- A goat eats the grass and gains only about 10 per cent of the grass’s energy; the other 90 per cent is spent or lost as heat (second trophic level).
- A person eats the goat and again receives only about 10 per cent of the goat’s energy (third trophic level).
- At each hand-off the surviving energy shrinks tenfold, and heat leaves the system, so the chain cannot stretch much further.
A grazing food chain receives \(10{,}000\\ \\text{J}\) of energy at the producer level. Using the 10 per cent law, calculate the energy available at the third trophic level (the secondary consumer).
In a grazing food chain the number of trophic levels is limited by the 10 per cent law. Do you think there is any such limitation in a detritus food chain? Discuss why or why not.
12.5 Ecological Pyramids
You are familiar with the shape of a pyramid: a broad base that narrows to a point at the apex. When we express the feeding or energy relationship between organisms at different trophic levels, we often get exactly this shape — which is why such a diagram is called an ecological pyramid.
An ecological pyramid is a graphical representation of the relationship between organisms at successive trophic levels, expressed in terms of number, biomass or energy.
In every ecological pyramid, the base represents the producers (the first trophic level), and the apex represents the top-level consumer (the tertiary or top carnivore). The relationship can be measured in three different currencies, giving three types of pyramid: the pyramid of number, the pyramid of biomass, and the pyramid of energy.
the three types of ecological pyramid
| Pyramid of number |
Number of individuals at each trophic level |
Usually upright; can be inverted or spindle-shaped |
| Pyramid of biomass |
Mass of living material (biomass) at each level |
Usually upright; inverted in a sea/pond |
| Pyramid of energy |
Amount of energy at each level per unit area per time |
Always upright, never inverted |
Pyramid of number
The pyramid of number counts the individuals at each level. In a grassland, for example, nearly 6 million plants at the base support fewer and fewer organisms as you climb, until only three top-carnivores remain at the apex, as shown in Fig. 12.6.
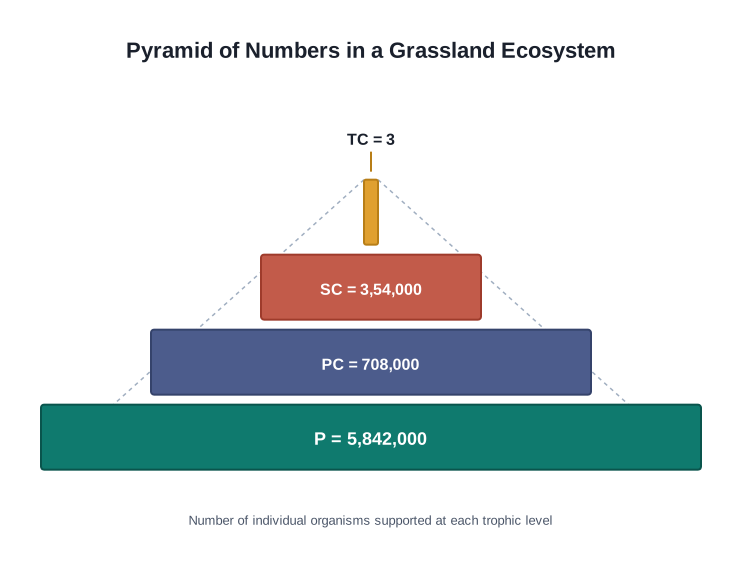
reading the grassland pyramid of numbers (Each bar’s length is the number of individuals at that trophic level. Reading upward — 5,842,000 producers, 708,000 primary consumers, 3,54,000 secondary consumers, just 3 tertiary consumers — the numbers fall steeply. The trend shows that a huge base of plants is needed to support only a handful of top carnivores.)
Pyramid of biomass
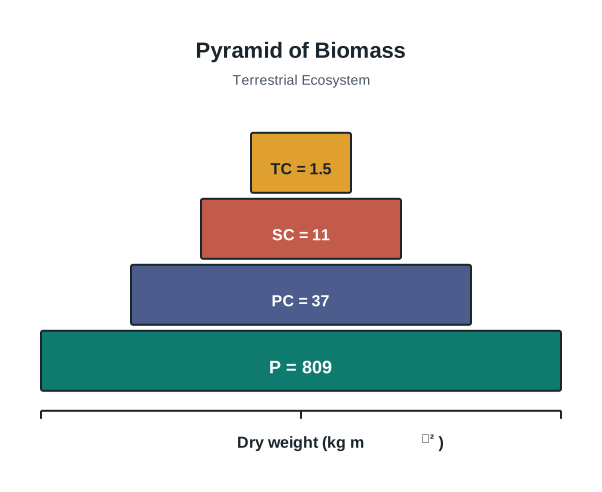
The pyramid of biomass measures the mass of living material at each level rather than the count. In most land ecosystems it shows a sharp decrease in biomass as you move up, as in Fig. 12.7.
When the pyramid turns upside down
Not every pyramid is upright. In some aquatic systems the pyramid of biomass is inverted — narrow at the base and wide above. This happens because the tiny phytoplankton, though few in mass at any instant, reproduce and are eaten so rapidly that they support a much larger standing crop of zooplankton above them (Fig. 12.8).
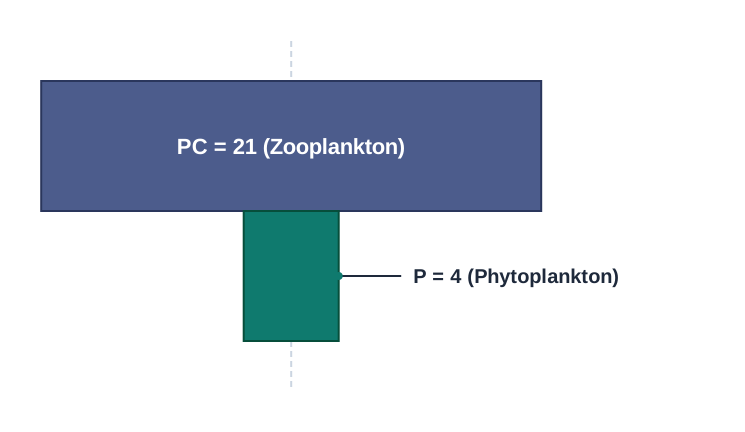
Q5. Can a pyramid of living matter ever stand upside down, with fewer producers at the bottom than consumers above?
A. Yes. In a sea or pond, the pyramid of biomass can be inverted. The phytoplankton producers have a very small standing crop at any moment because they are eaten almost as fast as they grow, yet their rapid turnover feeds a much larger standing crop of zooplankton. So the base (producers, biomass 4) is smaller than the level above it (consumers, biomass 21) — an upside-down pyramid.
Pyramid of energy
The pyramid of energy measures the energy present at each trophic level per unit area over a given time. An ideal energy pyramid makes the losses of energy flow vividly clear, as in Fig. 12.9.
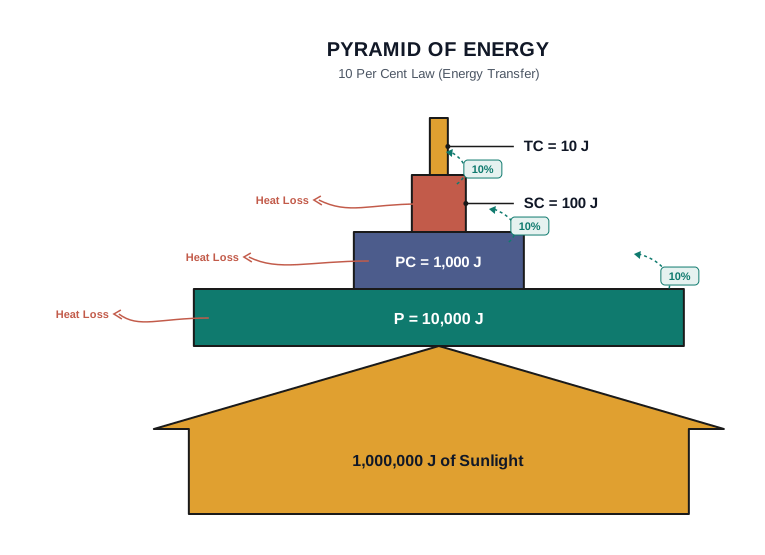
reading the energy pyramid (Of the 1,000,000 J of sunlight, the producers convert only 10,000 J into net primary productivity — just 1 per cent. From there, each level holds only one-tenth of the level below: 10,000 → 1000 → 100 → 10 J. The steady tenfold drop is the 10 per cent law made visible, and it is why the energy pyramid can never be top-heavy.)
Reading pyramids correctly
Any calculation of energy content, biomass or numbers must include all the organisms at a trophic level. If you count only a few individuals, no generalisation you make will hold true.
There is a subtle point here. A trophic level is a functional level, not a species as such. The same species may occupy more than one trophic level in the same ecosystem at the same time. For example, a sparrow is a primary consumer when it eats seeds, fruits and peas, but a secondary consumer when it eats insects and worms.
trophic level vs species (A trophic level is defined by what an organism is doing when it feeds, not by which species it belongs to. One species — a sparrow, or a human — can sit at two trophic levels depending on the meal.)
A single species can feed at more than one trophic level. Can you work out how many trophic levels human beings function at in a food chain?
Upright, inverted, and the exceptions
In most ecosystems, all three pyramids — of number, of biomass and of energy — are upright. That is, producers are greater in number and biomass than the herbivores, and herbivores are greater than the carnivores. And the energy at a lower trophic level is always more than at a higher level.
But there are exceptions to this generalisation for number and biomass. Think of the number of insects feeding on a single big tree: one producer supports many primary consumers, so the pyramid of numbers is no longer a simple upright triangle.
Count the insects feeding on one big tree, then add the small birds that depend on those insects, and the larger birds that eat the smaller ones. Sketch the shape of the pyramid of numbers you would get.
The pyramid of biomass in the sea is generally inverted, because the biomass of fishes far exceeds that of phytoplankton. Isn’t that a paradox? How would you explain it?
The pyramid of energy, however, is always upright and can never be inverted. This is because when energy flows from one trophic level to the next, some energy is always lost as heat at each step. No level can therefore hold more energy than the level below it. Each bar in the energy pyramid shows the amount of energy present at that trophic level in a given time, or annually, per unit area.
which pyramids can invert (Pyramids of number and of biomass can be inverted in some ecosystems. The pyramid of energy never can — energy always decreases upward because heat is lost at every transfer.)
Limitations of ecological pyramids
Useful as they are, ecological pyramids have real limitations. They do not take into account that the same species may belong to two or more trophic levels at once. They assume a simple, single food chain — something that almost never exists in nature — and so they cannot represent a food web. And they give no place at all to the saprophytes (the decomposers), even though these organisms play a vital role in the ecosystem.
The energy pyramid explains a familiar public-health and environmental fact: harmful, non-degradable substances such as DDT or mercury become more concentrated at higher trophic levels (biomagnification). Because so much energy — and body mass — is lost between levels, a top carnivore must eat a great deal of contaminated prey, so the toxins pile up in it far more than in the plants at the base.
12.6 Summary
- An ecosystem is a structural and functional unit of nature made of abiotic and biotic components. The abiotic components are inorganic materials — air, water and soil — while the biotic components are producers, consumers and decomposers.
- Each ecosystem has a characteristic physical structure that arises from the interaction between its abiotic and biotic components. The two main structural features are species composition and stratification.
- Based on its source of nutrition, every organism occupies a definite place in an ecosystem.
- An ecosystem functions through four important components: productivity, decomposition, energy flow and nutrient cycling.
- Primary productivity is the rate of capture of solar energy, or the biomass produced by producers. It is of two types — gross primary productivity (GPP), the total organic matter produced, and net primary productivity (NPP), the biomass left after the producers use some in respiration.
- Secondary productivity is the rate at which consumers assimilate food energy into new organic matter.
- In decomposition, decomposers convert the complex organic compounds of detritus into carbon dioxide, water and inorganic nutrients. Decomposition involves three processes: fragmentation of detritus, leaching and catabolism.
- Energy flow is unidirectional. Plants first capture solar energy, and this food energy is then transferred from producers onward to the decomposers.
- Organisms at different trophic levels are linked by their food or energy relationships, forming a food chain.
- Nutrient cycling is the storage and movement of nutrient elements through the various components of the ecosystem, so that nutrients are used again and again.
- Nutrient cycling is of two types — gaseous and sedimentary. The atmosphere or hydrosphere is the reservoir for the gaseous type (for example, the carbon cycle), while the Earth’s crust is the reservoir for the sedimentary type (for example, the phosphorus cycle).
- The useful products of ecosystem processes are called ecosystem services — for example, the purification of air and water by forests.
12.7 Points to Ponder
- Humans eat both plants and other animals. Working through the chapter’s food-chain categories, how would you classify human beings — and at how many different trophic levels do they actually feed?
- In a grazing food chain, the number of links is limited by the 10 per cent law. Do you think a detritus food chain faces the same limitation on its number of steps? Why or why not?
- If you counted the insects feeding on a single large tree, then the small birds feeding on those insects, and the larger birds feeding on the smaller ones, what shape of pyramid of numbers would you get — and why does it not stay a simple upright triangle?
- In the sea, the pyramid of biomass is often inverted, with the biomass of fishes exceeding that of the phytoplankton that feed them. How can a smaller mass of producers support a larger mass of consumers — and why can this never happen in a pyramid of energy?
- A single species, such as a sparrow, can act as a primary consumer at one moment and a secondary consumer at another. What does this tell you about treating a trophic level as a “functional level” rather than as a fixed group of species?
- Ecological pyramids give no place to the saprophytes, yet these decomposers are vital to every ecosystem. What important part of the real picture is lost when we leave them out?
12.8 NCERT Questions
- Fill in the blanks.
- Plants are called _________ because they fix carbon dioxide.
- In an ecosystem dominated by trees, the pyramid (of numbers) is _________ type.
- In aquatic ecosystems, the limiting factor for productivity is _________.
- Common detritivores in our ecosystem are _________.
- The major reservoir of carbon on earth is _________.
- Which one of the following has the largest population in a food chain?
- Producers
- Primary consumers
- Secondary consumers
- Decomposers
- The second trophic level in a lake is
- Phytoplankton
- Zooplankton
- Benthos
- Fishes
- Secondary producers are
- Herbivores
- Producers
- Carnivores
- None of the above
- What is the percentage of photosynthetically active radiation (PAR) in the incident solar radiation?
- 100%
- 50%
- 1–5%
- 2–10%
- Distinguish between
- Grazing food chain and detritus food chain
- Production and decomposition
- Upright and inverted pyramid
- Food chain and food web
- Litter and detritus
- Primary and secondary productivity
- Describe the components of an ecosystem.
- Define ecological pyramids and describe, with examples, the pyramids of number and biomass.
- What is primary productivity? Give a brief description of the factors that affect primary productivity.
- Define decomposition and describe the processes and products of decomposition.
- Give an account of energy flow in an ecosystem.
12.9 Check Your Concepts
- Assertion–Reason. Assertion (A): The flow of energy through an ecosystem is unidirectional. Reason (R): At each transfer between trophic levels, most of the energy is lost as heat and cannot be reused. State whether A and R are true, and whether R correctly explains A.
- Why can a grazing food chain rarely support more than four or five trophic levels? Explain using the 10 per cent law.
- What do you think would happen to nutrient supply in an ecosystem if all its decomposers were suddenly removed? Give reasons.
- Sequence-ordering. Arrange the following steps of decomposition in their correct order: catabolism, fragmentation, mineralisation, humification, leaching.
- Match the following: | Column I | Column II | |—|—| | a. GPP | i. Rate of formation of new organic matter by consumers | | b. NPP | ii. Total organic matter produced in photosynthesis | | c. Secondary productivity | iii. Dead organic matter used by decomposers | | d. Detritus | iv. GPP left after respiratory losses |
- Why is a pyramid of energy always upright and never inverted, whereas a pyramid of biomass can sometimes be inverted? Explain with an example.
- In a pond ecosystem, name the organisms that typically act as (a) autotrophs, (b) consumers, and (c) decomposers.
- Assertion–Reason. Assertion (A): Decomposition is slower in cold, waterlogged soils. Reason (R): Low temperature and anaerobiosis inhibit the activity of soil microbes. State whether A and R are true, and whether R correctly explains A.
- Why is the measurement of biomass in terms of dry weight considered more accurate than in terms of fresh weight?
- A sparrow may act as a primary consumer when it eats seeds and as a secondary consumer when it eats insects. What does this tell you about the meaning of a “trophic level”?
- The oceans cover about 70 per cent of the Earth’s surface, yet their productivity per unit area is far lower than that of land. Suggest two reasons for this.
- Diagram-labelling. Draw the ladder of trophic levels in an ecosystem and label the four levels (producer, primary consumer, secondary consumer, tertiary consumer), giving one example organism for each.
- Explain why a warm and moist environment favours rapid decomposition, while detritus rich in lignin and chitin decomposes slowly.
- “Matter is recycled in an ecosystem, but energy is not.” Explain this statement with reference to nutrient cycling and energy flow.
12.10 Practice With Numericals
- In a grazing food chain, the producers capture \(20{,}000\\ \\text{J}\) of energy. Applying the 10 per cent law, calculate the energy available to (a) the primary consumer and (b) the secondary consumer.
- The gross primary productivity of a forest is \(3200\\ \\text{g m}^{-2},\\text{yr}^{-1}\), and the plants lose \(1300\\ \\text{g m}^{-2},\\text{yr}^{-1}\) in respiration. Calculate the net primary productivity of the forest.
- Producers in an ecosystem receive \(1{,}000{,}000\\ \\text{J}\) of sunlight and convert \(1\) per cent of it into net primary productivity. Calculate (a) the energy fixed as NPP by the producers, and (b) the energy available at the tertiary consumer level, assuming the 10 per cent law applies at each successive transfer.
- In a pyramid of biomass, the producers have a dry weight of \(809\\ \\text{kg m}^{-2}\) and the primary consumers \(37\\ \\text{kg m}^{-2}\). Calculate the percentage of producer biomass that is present as primary-consumer biomass.