Chapter 3: Emerging Trends
In 1999, a group of researchers had a problem of an unusual kind. A radio telescope was sweeping the sky and recording signals from space, and the recordings were piling up far faster than any laboratory computer could examine them. Buying a supercomputer was out of reach. So the researchers tried something else. They wrote a small program that ordinary people could install on their home computers, and released it to anyone willing to help.
The idea was simple. Most of the time, a home computer sits idle — waiting between keystrokes, showing a screensaver, doing nothing at all. That idle time is wasted processing power. The program quietly downloaded a small slice of the telescope data, analysed it while the machine was otherwise unused, sent the result back, and asked for the next slice.
Over the years that followed, millions of home computers around the world took part. None of them was powerful. Together, joined only by the Internet, they worked through a quantity of data that no single institution could have handled alone.
Nothing in that arrangement was new hardware. What was new was an idea about how machines could be organised — scattered, borrowed, temporary, and pointed at one task. Most of the technologies in this chapter began the same way: not with a new machine, but with a new idea about how to use the ones already there.
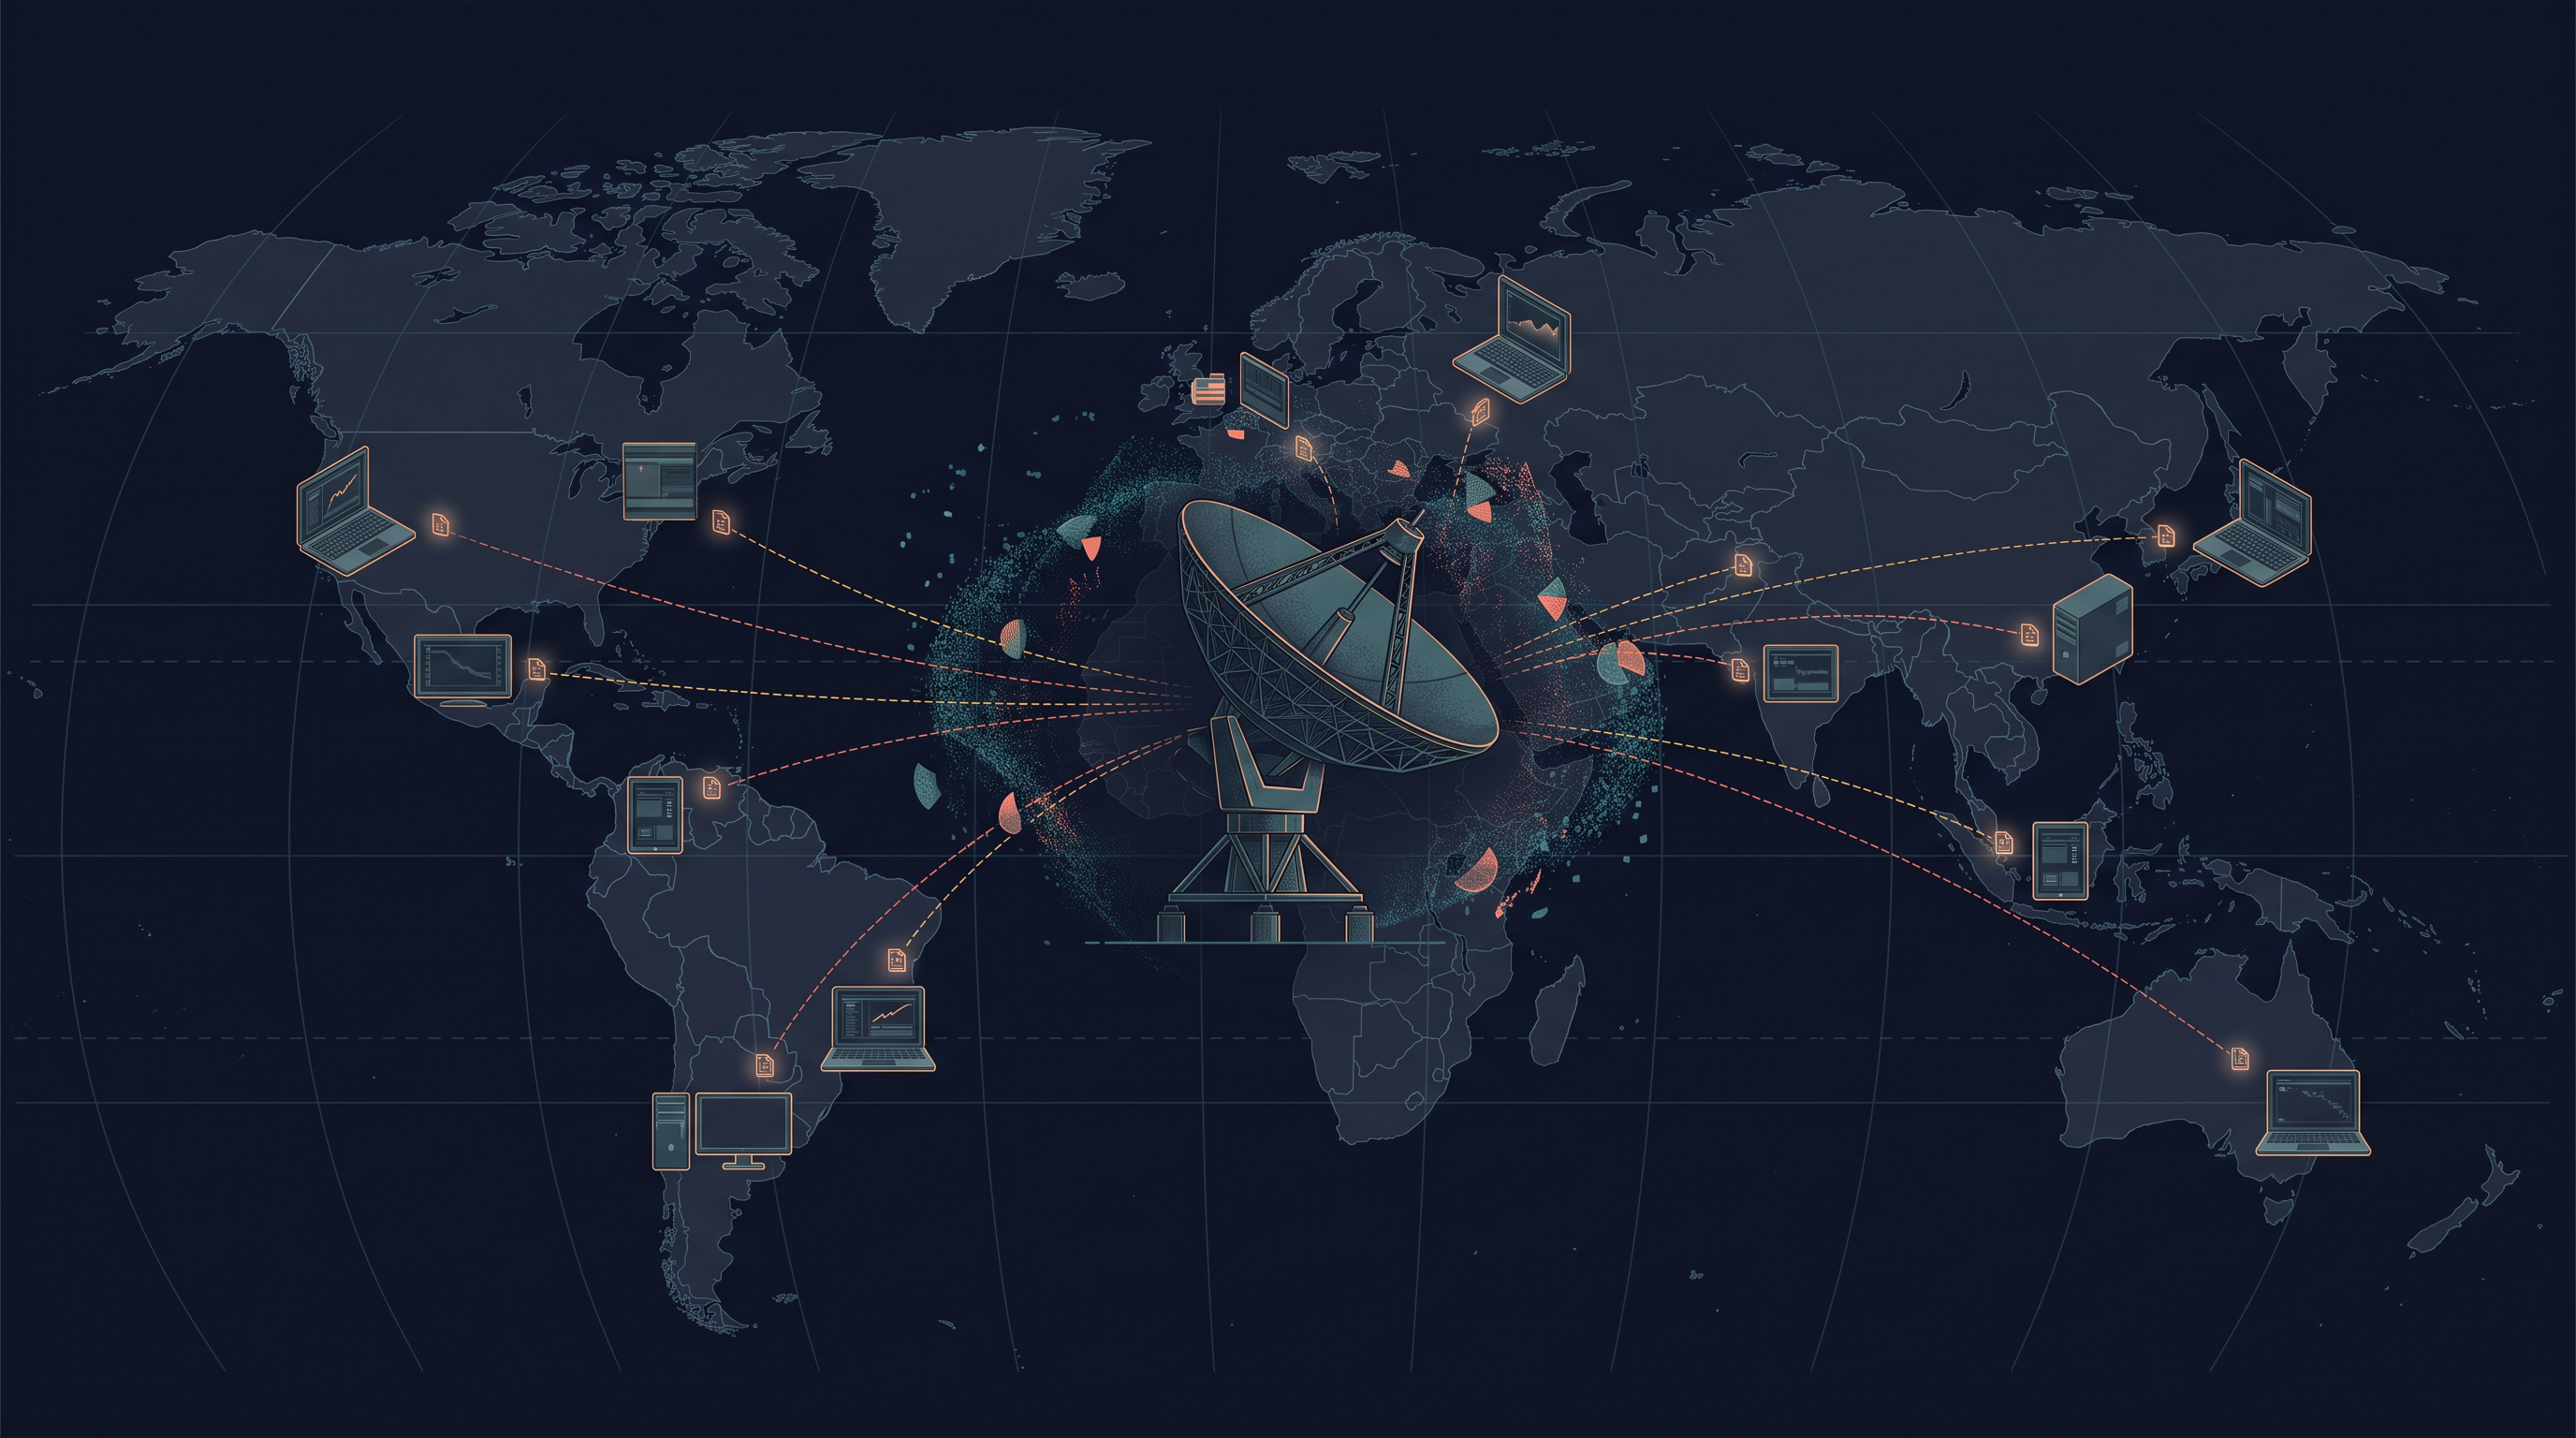
Fig. 3.0 – Distributed processing of radio telescope data.
This chapter takes up each of these questions in turn, and by the end of it you will be able to answer all five in your own words.
3.1 Introduction
Look at a photograph of a computer laboratory from twenty years ago. The machines are bulky, the screens are deep, and every one of them is joined to a wall by a cable. Nothing in that room would surprise a student of the time. Almost everything in it would look strange to you.
Computing changes in this way constantly, and it changes fastest at its edges. Somewhere, a technique that only a few laboratories can use today is quietly becoming something an ordinary person will use next year without thinking about it. Speech typing on a phone was a research problem once. So was recognising a face in a photograph.
Not every new idea travels that road. Many technologies appear, attract some attention, and disappear — because they solved a problem nobody really had, or cost more than they were worth, or were overtaken by something simpler. A few survive, spread, and change the way work is done. Those few are what we call emerging trends.
An emerging trend is a technology that has moved beyond the experimental stage, is gaining wide acceptance among users, and is beginning to set a new pattern in the way things are done. The word “emerging” matters: the technology is not brand new, and it is not yet ordinary. It is in between — visible, growing, and not settled.
New, but not yet ordinary
It helps to see a technology as passing through stages. It is invented in a laboratory. It is tried by a small number of specialists. If it survives that stage, it becomes cheap and reliable enough for ordinary users, and adoption spreads quickly. Finally it becomes so common that nobody calls it a technology any more — it is simply how things are done. Electricity in homes went through exactly this journey, and so did the mobile telephone.
The interesting stage is the third one, and Fig. 3.1 shows where it sits. A technology in that stage is worth studying because it is still changing shape, and because the choices being made about it now — who controls it, what it is used for, what it costs — are not yet fixed.
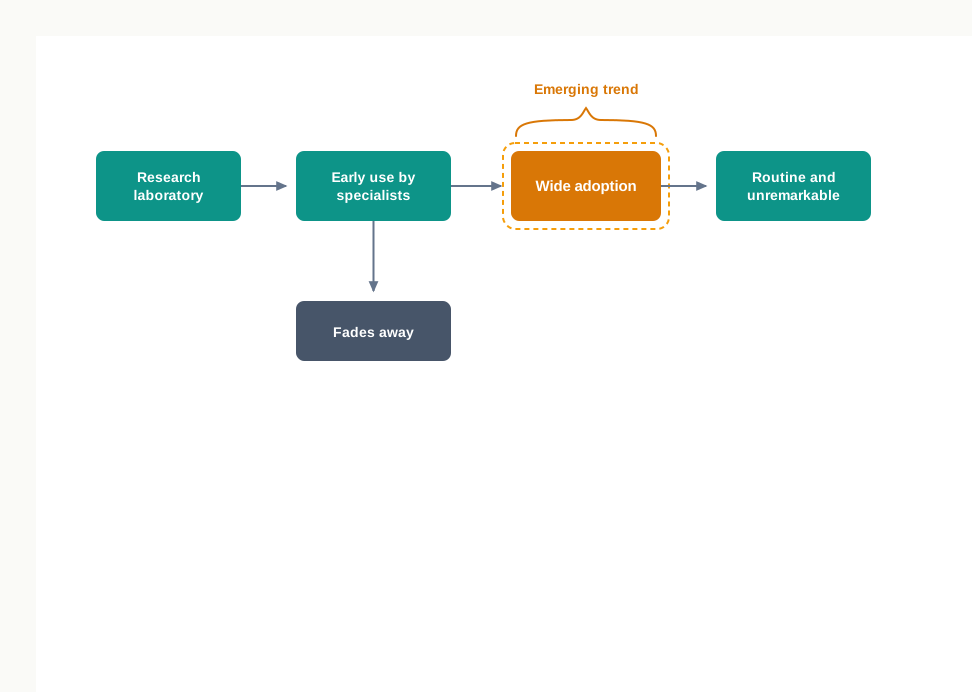
Fig. 3.1 – Stages in the life of a technology.
Why these trends are worth studying
There is a practical reason to keep an eye on such technologies, and a deeper one.
The practical reason is that they change what a computer is expected to do. A programmer who understands only the machine in front of them will be puzzled by a system whose data sits in another country, whose computation is shared among a thousand volunteers, or whose records are held identically by every participant rather than by one office.
The deeper reason is that these technologies are steadily reorganising the digital economy — the part of economic activity that runs on digital technologies, such as online payments, online marketplaces, remote services and data-driven decision making. When shopping, banking, ticketing and record-keeping move onto such systems, the design of the technology becomes a matter of public consequence, not merely a technical detail.
What this chapter covers
Six technologies are taken up in this chapter, listed in Table 3.1. They are not six unrelated topics. Each one is a response to a limit of ordinary computing — a limit of intelligence, of scale, of reach, of ownership, of processing power, or of trust — and reading them in that light is the most useful way to hold them together.
Table 3.1 – the six emerging trends taken up in this chapter, and the limit of ordinary computing that each one addresses
| Trend | The limit it responds to |
|---|---|
| Artificial Intelligence | A computer follows instructions but cannot judge, recognise or learn |
| Big Data | Data arrives in volumes and forms that ordinary tools cannot process |
| Internet of Things | Only computers are on the network; everyday objects are not |
| Cloud Computing | Computing power must be bought and owned before it can be used |
| Grid Computing | One machine’s processing power is fixed, and mostly idle |
| Blockchains | Records held in one central place can be altered or lost |
Read the right-hand column first when you come to each section. A technology is far easier to understand once you know the difficulty it was invented to remove.
One caution before we begin. Because these technologies are still developing, writing about them attracts a great deal of loose language — claims that a system “thinks”, that data is “the new oil”, that a technology will “change everything”. Some of it is advertising. As you read the chapter, hold on to the habit of asking what a technology actually does, what it costs, and where it fails. That habit is worth more than any list of definitions.
3.2 Artificial Intelligence (AI)
A computer, as you have studied it so far, is obedient and literal. It does exactly what its instructions say, in the order they say it, and it does not improve with practice. Write a program to add two numbers and it will add two numbers today, tomorrow, and a lakh times over, never faster and never differently.
Now think of the tasks a person does without any instructions at all. You recognise a friend’s face in a crowded corridor, although you could not write down the rule you used. You understand a sentence spoken in a hurry, with words slurred and one word missing. You decide which of two routes to school will be quicker today, using yesterday’s experience of a blocked road. None of these tasks can be reduced easily to a fixed set of steps, and that is precisely why ordinary programming struggles with them.
Artificial intelligence (AI) is the branch of computer science that attempts to make machines perform such tasks — tasks that would be said to require intelligence if a human did them. An AI system aims to imitate cognitive functions such as learning, recognising, reasoning, decision making and problem solving, so that it can work with little human intervention.
To do this, a system needs something to reason from. That store of facts, assumptions and rules is called its knowledge base. A medical decision-support system, for example, holds facts about symptoms, rules connecting symptoms to conditions, and assumptions about what to do when information is missing. The system consults this store, draws a conclusion, and — this is the important part — can add to the store afterwards, so that its later decisions take the outcome of earlier ones into account.
How the parts of this section fit together
The rest of this section takes up four areas, and it is worth knowing in advance how they are related, because they are not four equal branches of one tree. Fig. 3.2 shows the arrangement.
Machine learning is a subsystem of artificial intelligence — it lies wholly inside it. Natural language processing is an application area of AI, and today it relies heavily on machine learning. Robotics is an interdisciplinary field of its own, drawing on mechanical engineering and electronics as much as on computer science; AI is what makes a robot able to decide rather than merely repeat. Immersive experiences are built mainly from graphics and sensing hardware, and use AI where recognition or tracking is needed. Keeping these distinctions straight will save you from a common muddle later.
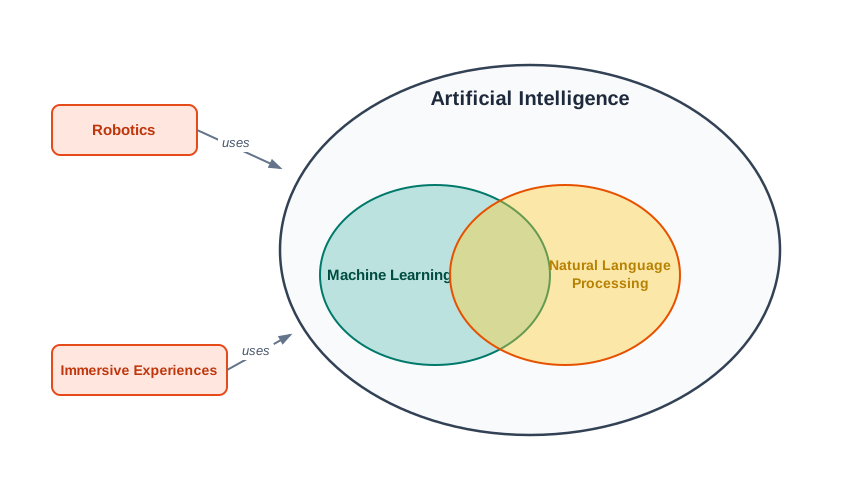
Fig. 3.2 – Branches of artificial intelligence.
3.2.1 Machine Learning
Suppose you are asked to write a program that decides whether an email is unwanted advertising. You could try writing rules by hand: reject a message containing the word “free”, reject one written entirely in capitals. You would fail. There are too many rules, they contradict one another, they change every month, and no human can list them all.
The alternative is to stop writing rules and to supply examples instead. Collect a large number of messages already marked as wanted or unwanted, and let a program work out for itself which combinations of features separate the two groups. This is the idea behind machine learning: a subsystem of artificial intelligence in which a computer learns from data using statistical techniques, without being explicitly programmed for the task by a human being.
Model, training and testing
The program that does this learning is called a model. A model is not a finished answer; it is an arrangement of adjustable quantities that is gradually tuned so that it fits the examples it is shown.
The examples are divided into two parts before any learning begins. The training data is the portion the model is allowed to learn from — it is shown these examples along with the correct answers, and adjusts itself until it gets most of them right. The testing data is a portion kept aside and never shown during learning; it is used afterwards to check how well the model does on examples it has not seen. Fig. 3.3 shows the whole cycle.
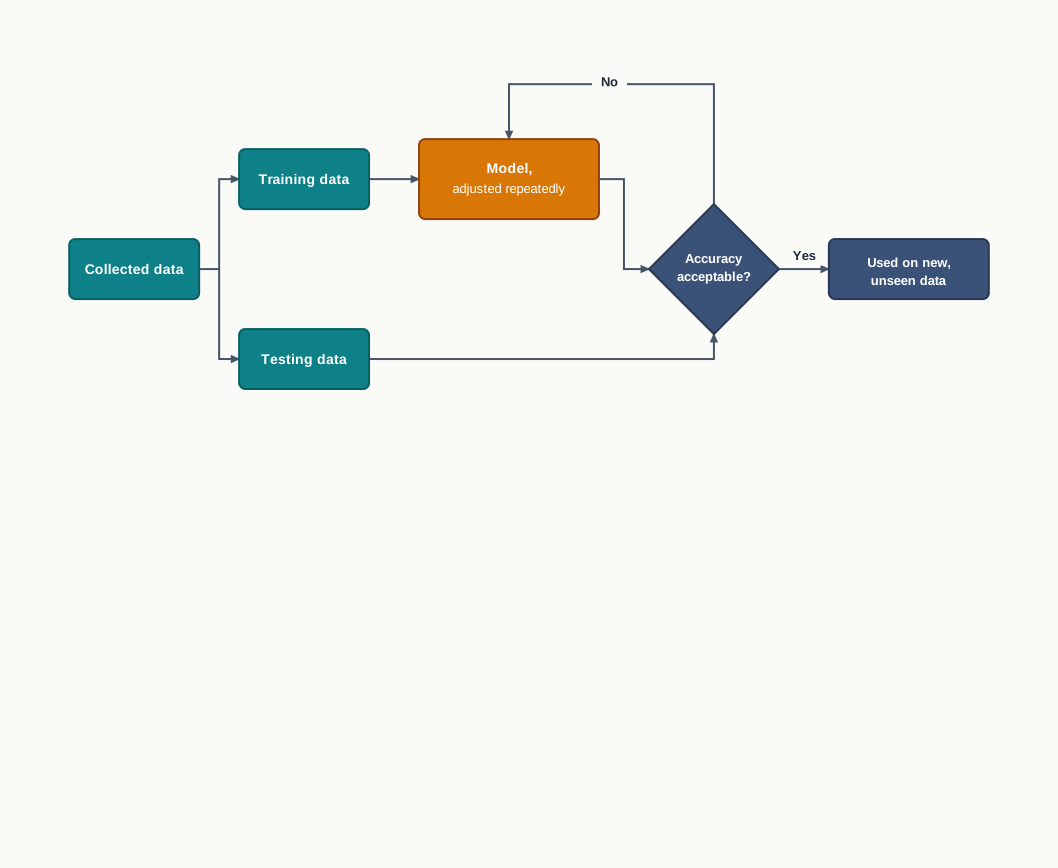
Fig. 3.3 – The machine learning cycle.
Why keep data aside at all, when more training examples would make the model fit better? Because fitting the training data is not the goal. A student who memorises the solved examples in a book will score full marks on those examples and fail on an unseen question. A model can fail in exactly the same way. The only honest measure of learning is performance on data the model has never seen, and that is what the testing data provides.
Table 3.2 – training data vs testing data
| Feature | Training data | Testing data |
|---|---|---|
| Purpose | To let the model adjust itself and learn the pattern | To measure how well the model has learnt |
| Shown to the model during learning | Yes, repeatedly | No, never |
| Correct answers available | Yes, and used for adjustment | Yes, but used only for checking |
| Effect of good performance on it | Shows the model has fitted these examples | Shows the model can generalise to new cases |
| Typical share of the collected data | The larger part | The smaller part, kept aside |
Once the model performs to an acceptable level of accuracy on the testing data, it is put to work: it is given genuinely new and unknown data and asked to predict. That prediction is the product of the whole exercise.
An honest limitation must be recorded here. A model learns whatever is present in its data, including mistakes and imbalances. If the examples of a task come mostly from one kind of situation, the model will do badly on every other kind, and it will give no warning that it is doing so. Judging the data is therefore part of the work, not a preliminary to it.
3.2.2 Natural Language Processing (NLP)
When you begin typing a message and the next word is suggested before you type it, or a misspelt word is corrected as you go, you are seeing the results of natural language processing (NLP) — the area of AI concerned with the interaction between humans and computers through human languages such as Hindi, English or Tamil.
The name draws a contrast that is worth making explicit. Python is a language, but an artificial one: its grammar is fixed, every statement has exactly one meaning, and a single misplaced colon is an error. A natural language is nothing like that. It is ambiguous, incomplete, full of exceptions, and understood largely from context. “The bus stand near the school” and “the school near the bus stand” use the same words to say different things. A single English sentence can carry two meanings that a listener resolves instantly and a machine cannot. This is why NLP is hard, and why progress in it came slowly.
What an NLP system can do
Two conversions matter most in everyday use, and Fig. 3.4 shows both. In speech-to-text conversion, spoken words are captured by a microphone and turned into written text — this is what happens when you dictate a message. In text-to-speech conversion, written text is turned into spoken words, which is what lets a device read a page aloud.
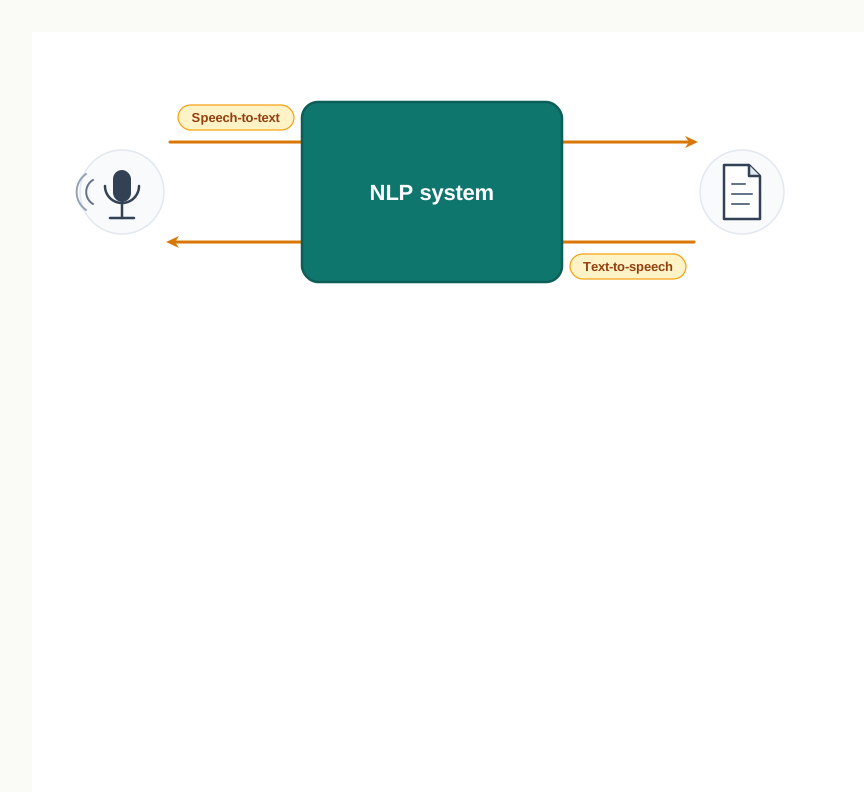
Fig. 3.4 – Speech-to-text and text-to-speech conversions.
Beyond these, two application areas are growing quickly. Machine translation converts text from one language into another, now with a fair degree of correctness for common language pairs — a genuine convenience in a country with as many languages as ours, though a translation still needs a human eye before it is relied upon. Automated customer service is the second: a software system reads a typed query or listens to a spoken one, works out what is being asked, and answers the routine cases without a person being involved.
Taken together, these abilities mean that a device can be operated by voice rather than by keyboard — which matters a great deal to a user who cannot type easily, or who is holding something in both hands, or who is not comfortable reading the language of the interface.
3.2.3 Immersive Experiences
Watching a film on a screen keeps you outside it. You look at the scene; you are not in it. Immersive experience is the term for a computer-generated experience that draws you inside instead — that lets you look around, react and feel involved, by stimulating your senses rather than merely presenting a picture.
Three-dimensional videography, better sound and faster graphics have made such experiences ordinary in entertainment, but the most valuable uses are in training. A driving simulator lets a learner meet a skidding vehicle, a failed brake or a blind turn at night, and to meet each of them repeatedly, without any risk to anybody. A flight simulator does the same for a pilot, and a surgical simulator for a trainee surgeon. In each case the value comes from a simple fact: mistakes in the simulation cost nothing.
Two technologies are used to achieve immersion, and they work on opposite principles.
3.2.3.1 Virtual Reality
Everything you know of the world reaches you through your senses. If a machine could supply your senses with made-up information convincing enough, your perception would follow it. That is the idea behind virtual reality (VR): a three-dimensional, computer-generated environment that simulates a real or imagined world, in which the user is immersed and with which the user can interact.
At present this is achieved with a VR headset, which places a small screen before each eye and shows each eye a slightly different view, so the brain reads the pair as depth. As the wearer turns their head, sensors detect the movement and the view is redrawn to match, which is what makes the scene feel stationary while the wearer moves. Fig. 3.5 shows the arrangement. Sound, and in some systems motion, temperature or touch, are added to strengthen the effect.
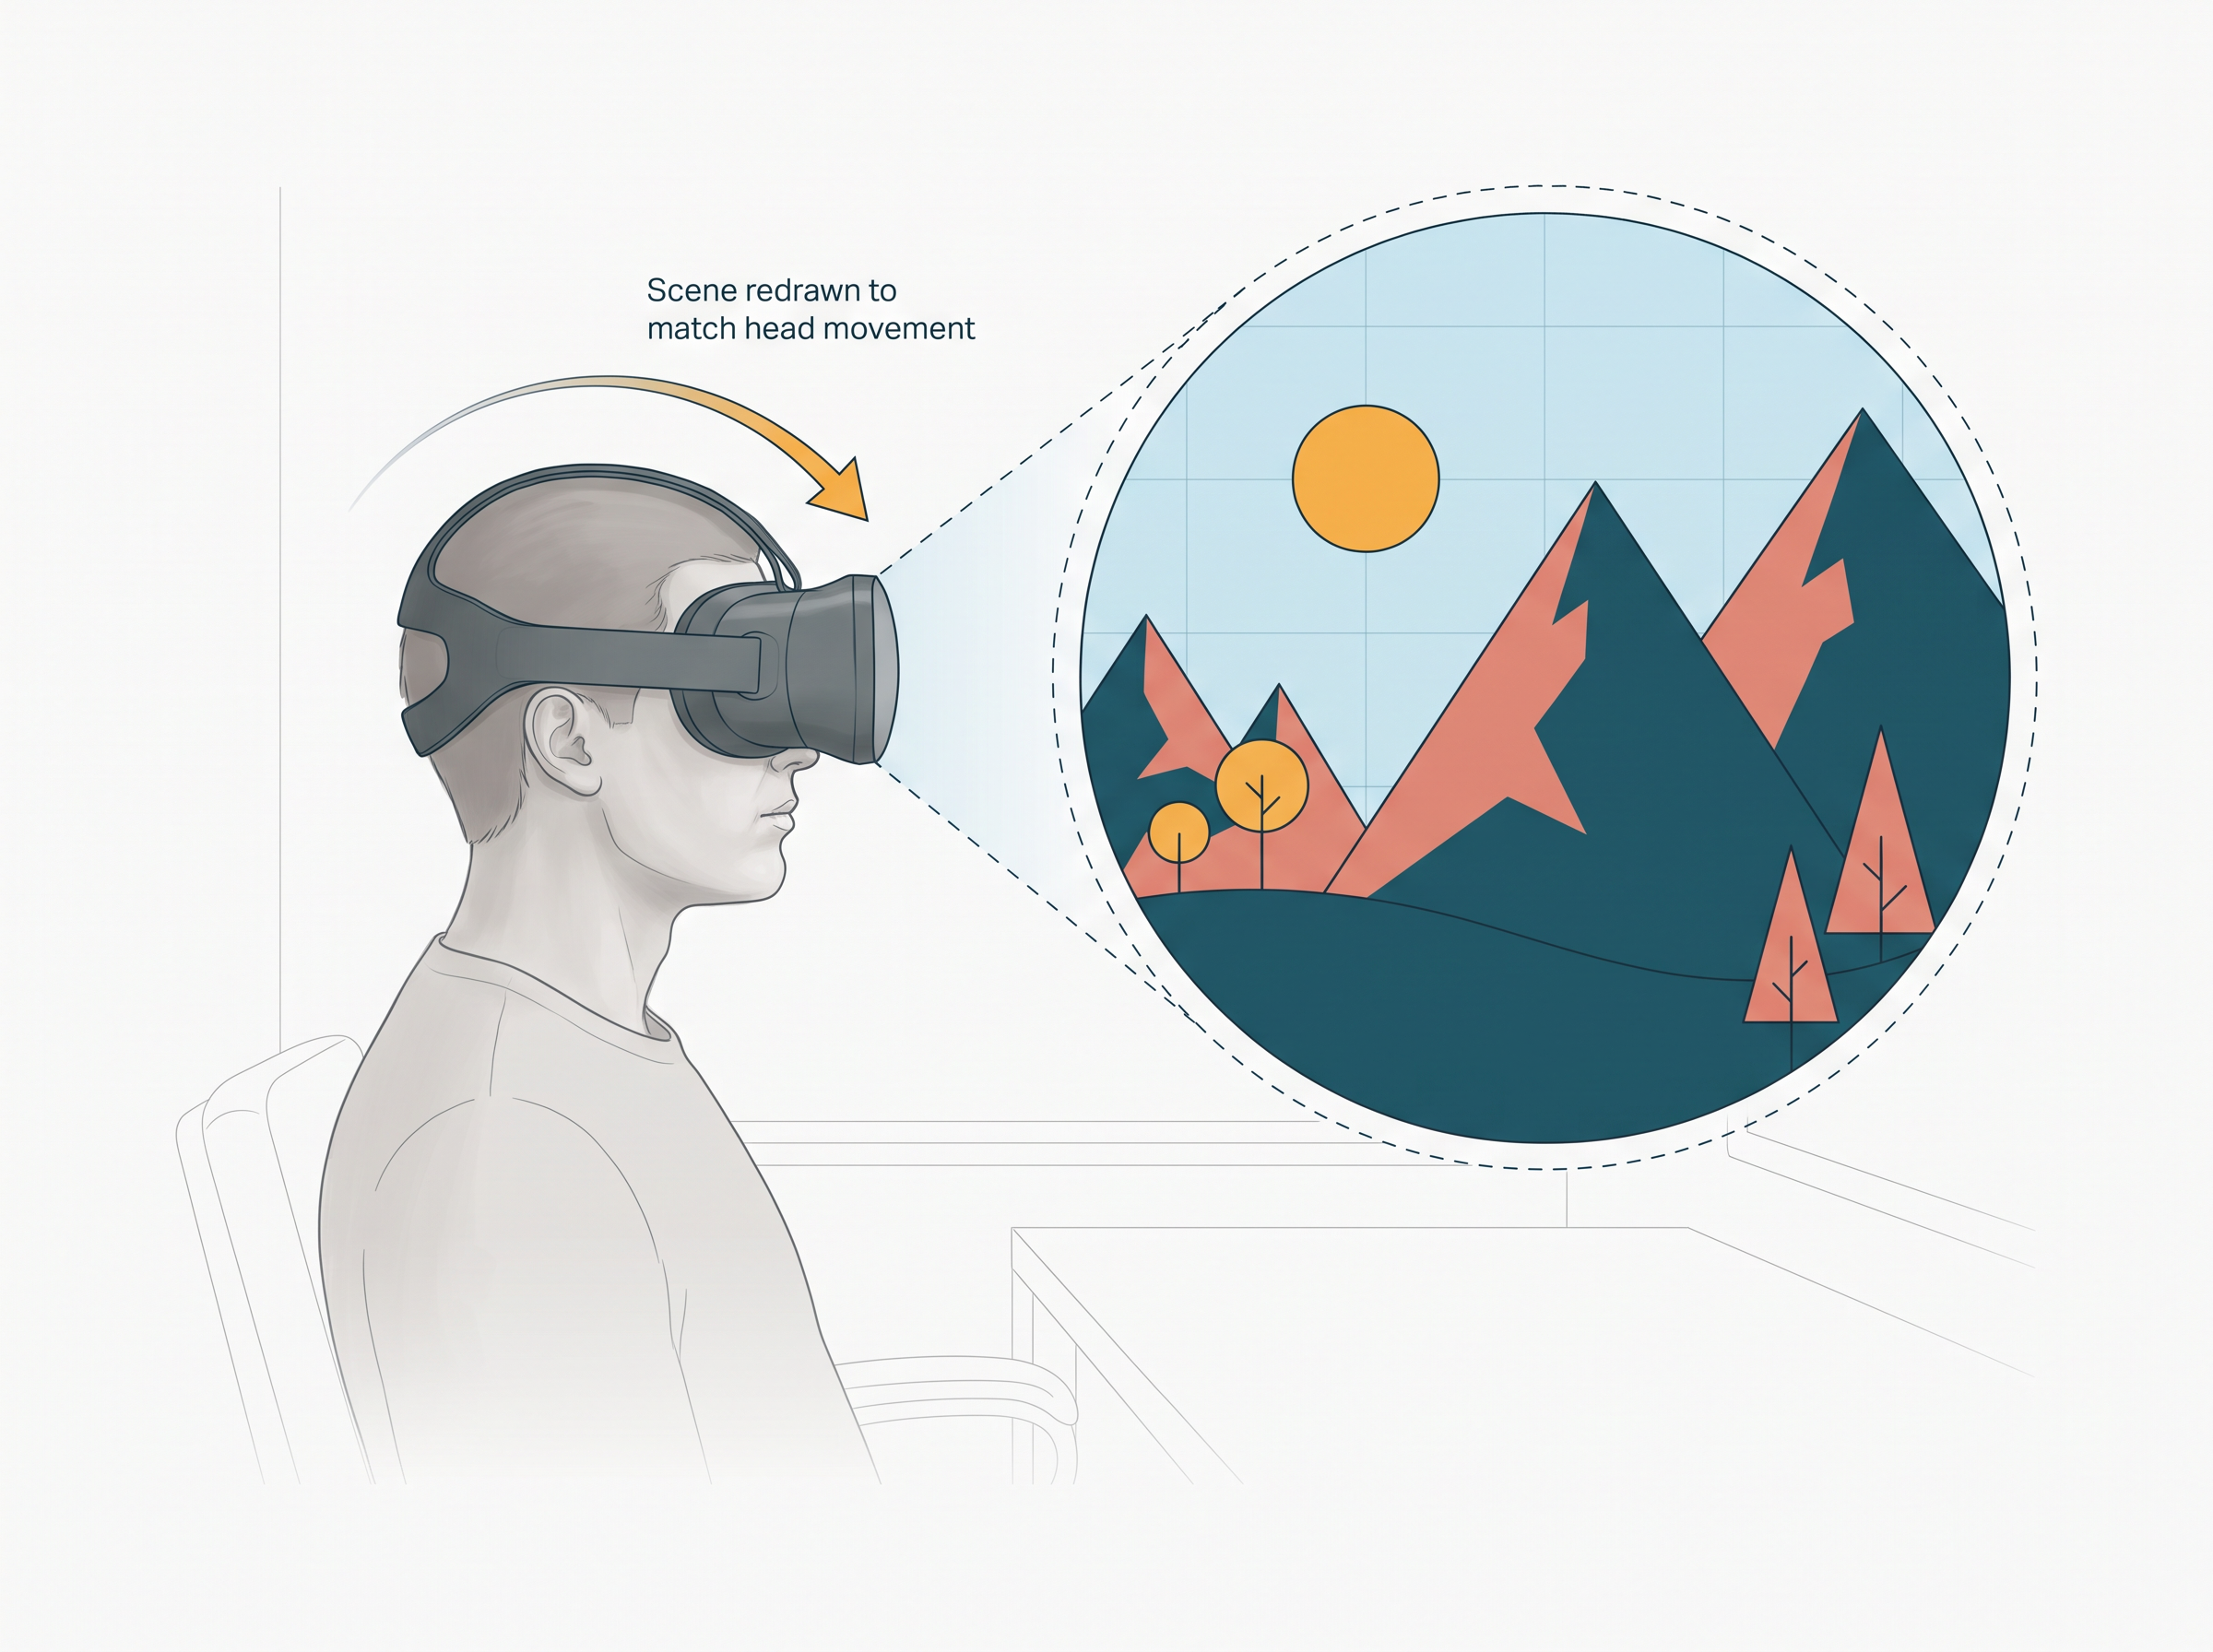
Fig. 3.5 – Virtual reality immersion.
VR is a comparatively new field, and its applications now extend well beyond gaming — into military and industrial training, medical procedures, entertainment, psychology, engineering design, and any area where simulating a situation teaches better than describing it.
3.2.3.2 Augmented Reality
Virtual reality shuts the real world out. Augmented reality (AR) does the opposite: it leaves the real world in view and adds computer-generated information on top of it.
The everyday form is location-based. Point a phone’s camera at the street and the live view appears on the screen with information written over it — the name of the building ahead, the platform number, the fare to the next stop, the reviews of the shop across the road. The camera view is real; the labels are added. Fig. 3.6 shows this. A traveller standing before a historical monument can, in the same way, read about it while looking at it, instead of looking away at a guidebook.
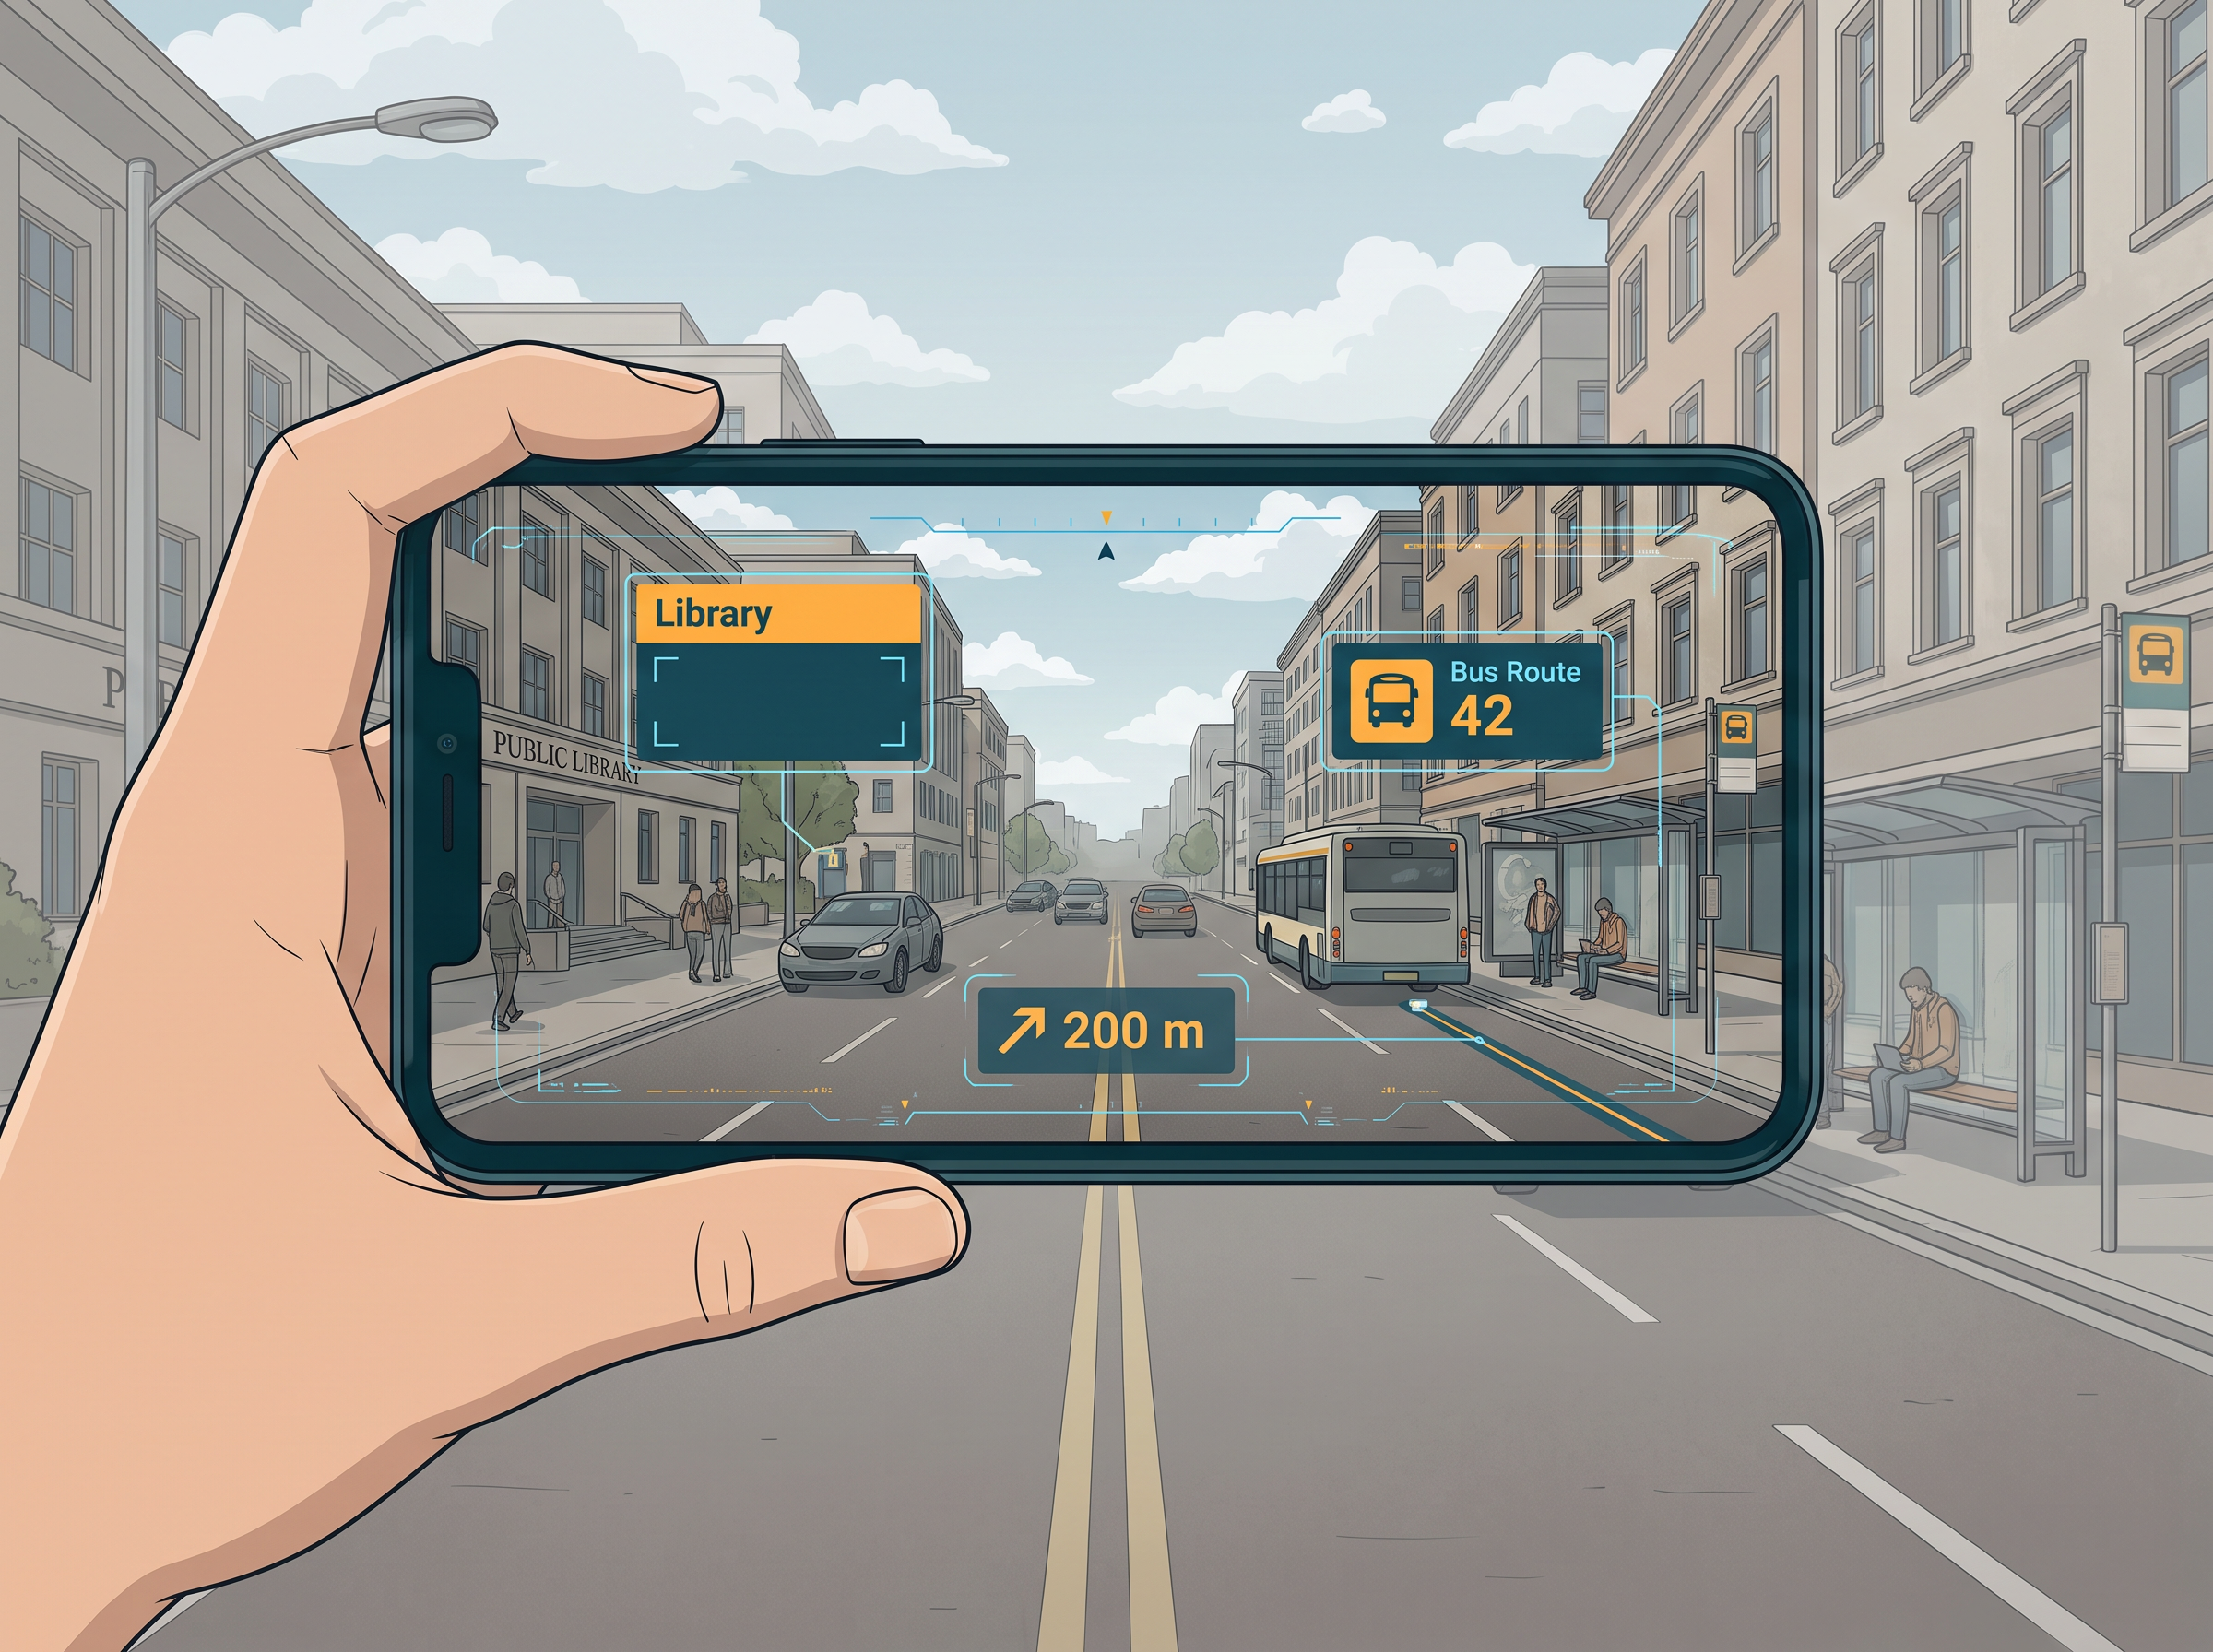
Fig. 3.6 – Augmented reality in a street scene.
The distinction between the two is easy to state and easy to forget: augmented reality does not create a new world, it adds to the perception of the existing one. Table 3.3 sets the two side by side.
Table 3.3 – virtual reality vs augmented reality
| Feature | Virtual reality (VR) | Augmented reality (AR) |
|---|---|---|
| What the user sees | A wholly computer-generated environment | The real surroundings, with computer-generated information added |
| Real surroundings | Hidden from view | Remain visible and in use |
| What the technology creates | A new environment | Additional information about the existing one |
| Usual equipment | A headset covering the eyes | A phone, tablet or transparent display |
| Typical use | Training simulators, gaming, design walkthroughs | Location information, on-site guidance, maintenance instructions |
3.2.4 Robotics
A washing machine performs a task automatically, but it is not a robot. It does one fixed cycle, decided when it was manufactured, and nothing you can do will make it fold clothes. The difference that matters is programmability.
A robot is a machine capable of carrying out one or more tasks automatically with accuracy and precision, and — unlike an ordinary automatic machine — it is programmable by a computer, so it can be made to follow different instructions for different tasks. Robotics is the interdisciplinary branch of technology, drawing on mechanical engineering, electronics and computer science, that deals with the design, fabrication, operation and application of robots.
What a robot is made of
Three parts appear in almost every robot, and Fig. 3.7 labels them. Sensors are devices that measure something in the physical surroundings — distance, temperature, pressure, light, position — and report it as a signal the machine can use. They are among the prime components of a robot, because a machine that cannot detect its surroundings cannot respond to them. A controller holds the program and decides what to do with those readings. Actuators — motors, arms, wheels, grippers — carry out the decision as physical movement.
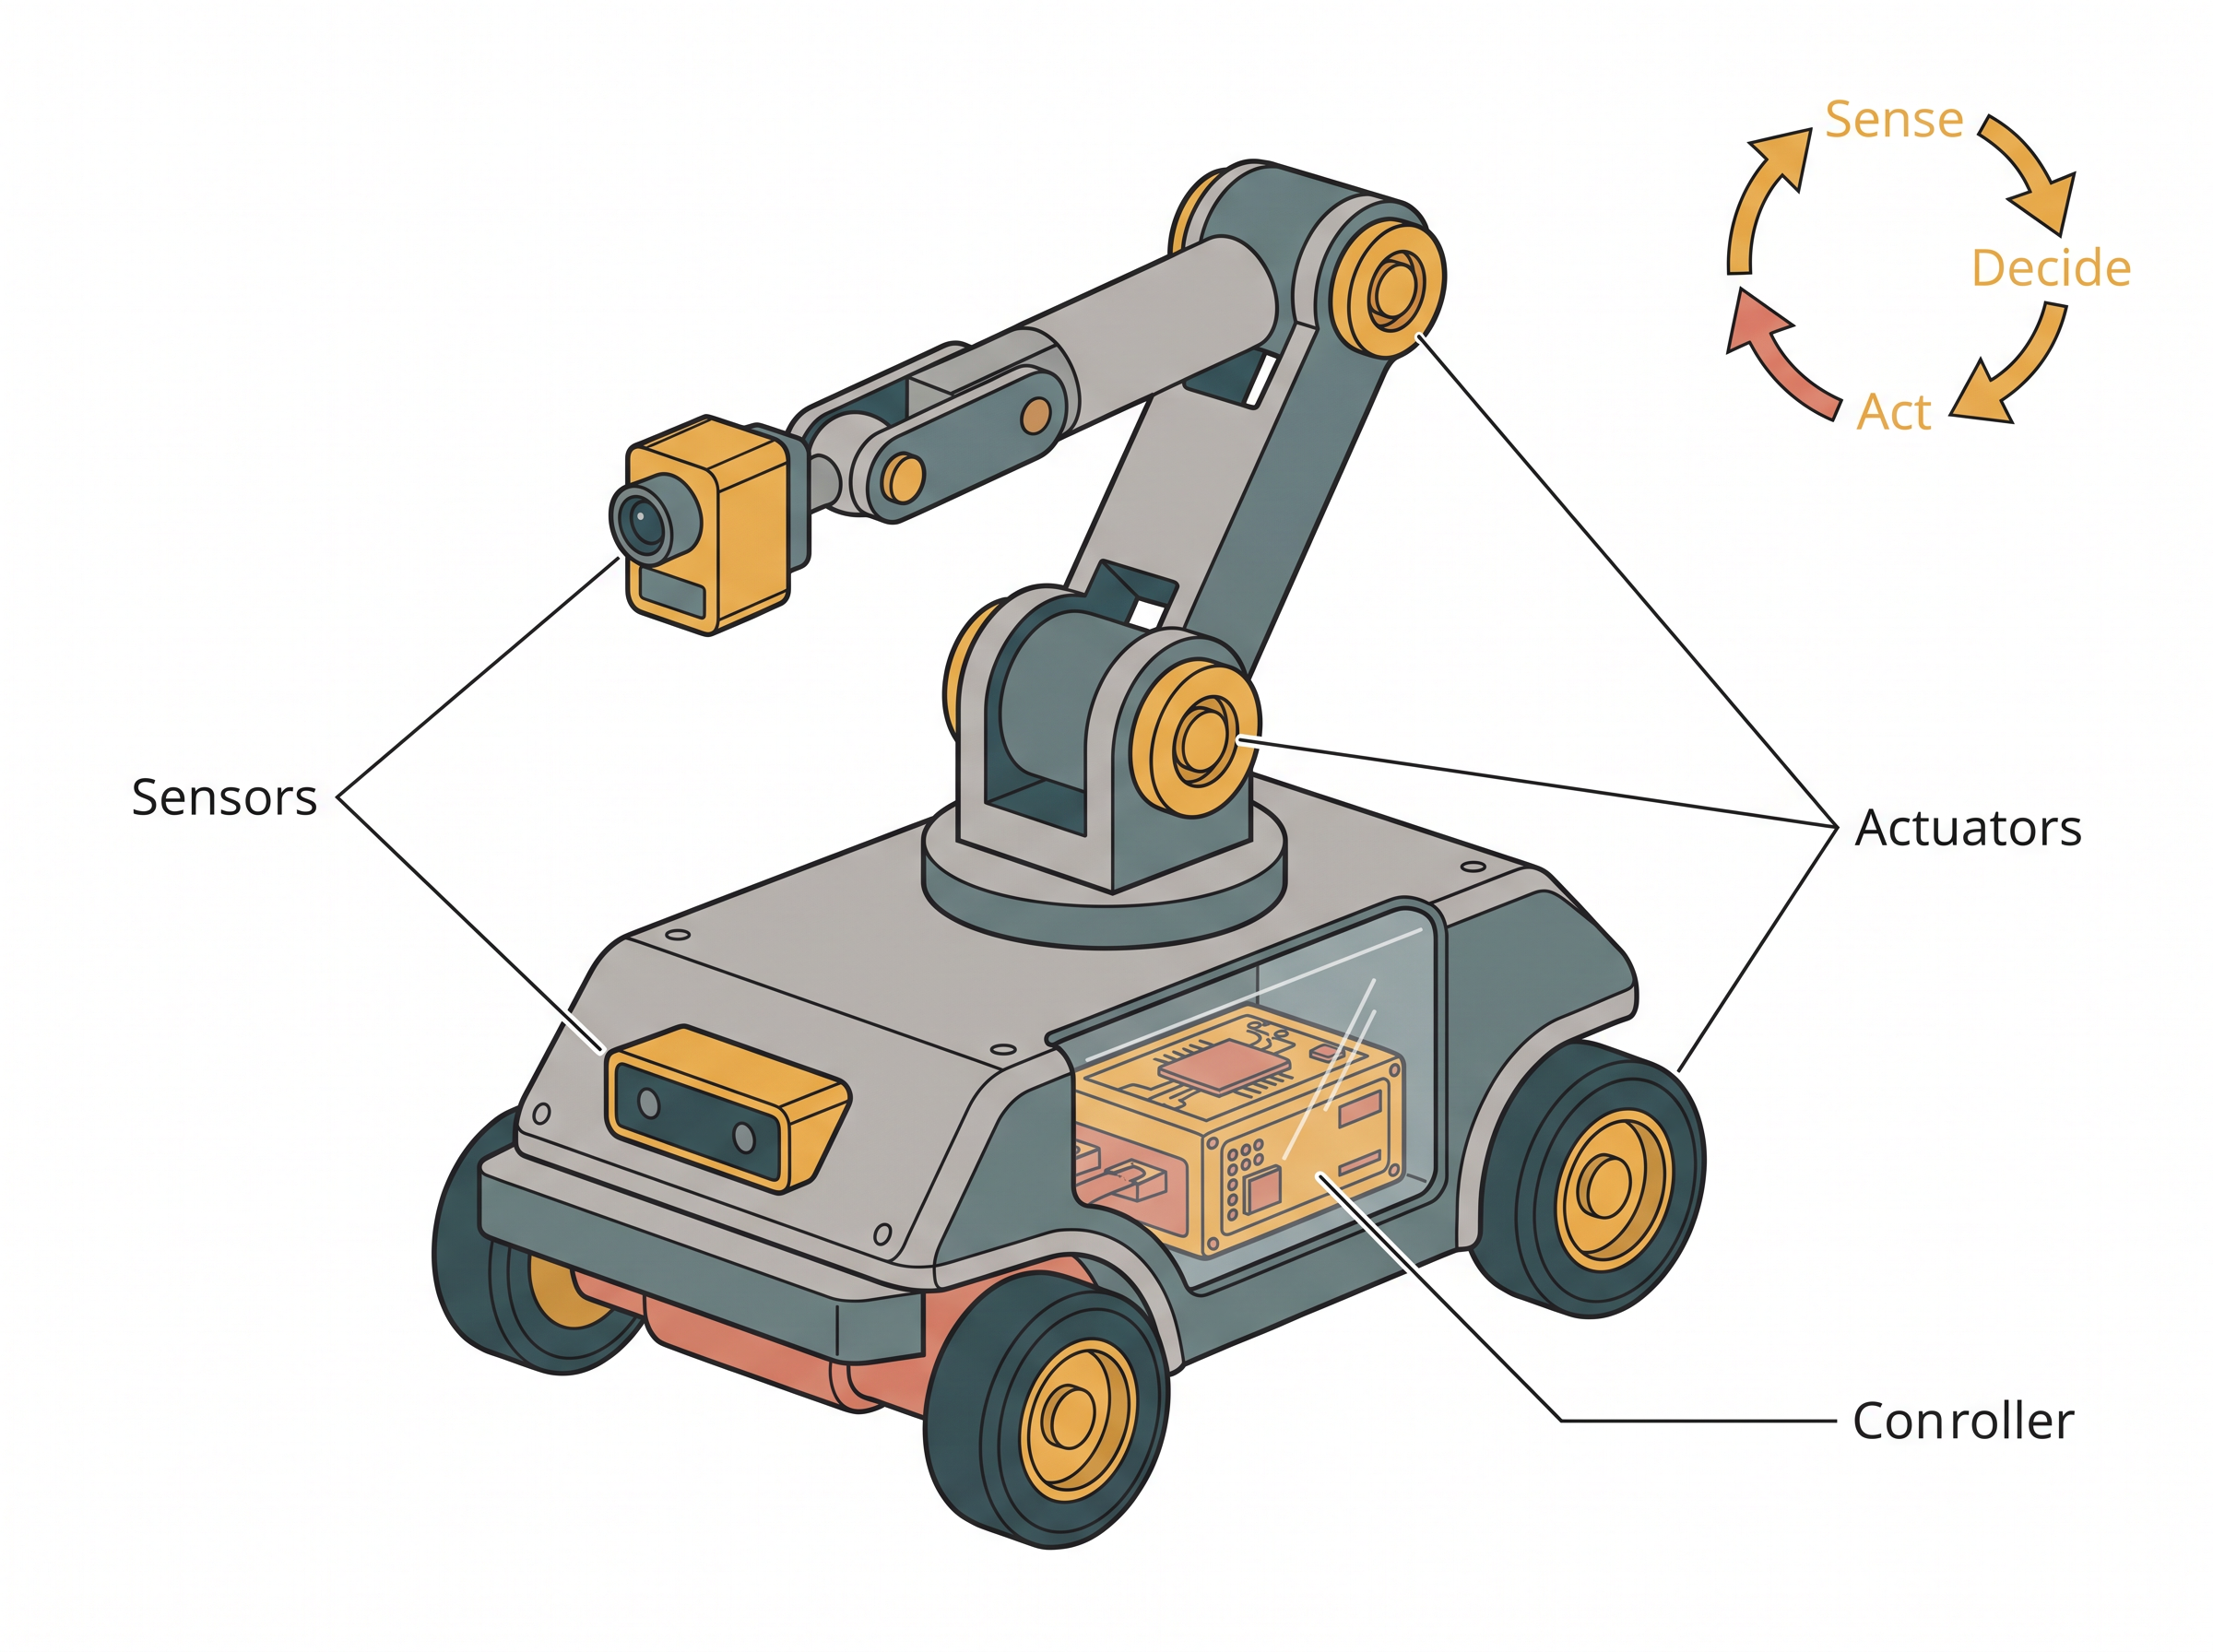
Fig. 3.7 – Principal components of a robot.
Robots were first developed for industrial tasks that were repetitive, physically demanding or hazardous — welding, painting, lifting, handling hot or sharp material. A machine that never tires and never loses concentration is well suited to such work, and a human freed from it can do something better.
Kinds of robots
Robots are usually grouped by how they are built and how they move, as set out in Table 3.4. Robots built to resemble human beings in form are called humanoids.
Table 3.4 – common kinds of robots, grouped by construction, with a typical use for each
| Kind | How it is built | A typical use |
|---|---|---|
| Wheeled robot | Moves on wheels over a fairly even surface | Carrying material along the aisles of a warehouse |
| Legged robot | Moves on two or more legs, able to cross uneven ground | Searching rubble after a building collapse |
| Manipulator | A fixed jointed arm with a gripper or tool at its end | Assembling parts on a production line |
| Humanoid | Built to resemble the human body in form and movement | Research on interaction between people and machines |
Robots are now used in industry, medical science, bionics, scientific research and defence. A surgical assistance robot holds an instrument steadier than a human hand can, while the surgeon controls it. A planetary rover carries instruments across a surface where no person can be sent, taking measurements and sending them back. An unmanned aircraft, or drone, flies without a pilot on board — either controlled remotely or following a flight plan stored in its embedded system, guided by onboard sensors and satellite positioning — and is used for aerial photography, mapping, crop inspection, delivery over short distances, and search and rescue after a flood or earthquake.
3.3 Big Data
Every time you send a message, take a photograph, search for something, watch a video, tap a payment or simply carry a phone with its location switched on, a record is created somewhere. You did not intend to produce data; you intended to do something else. The data is a by-product.
Multiply that by more than a billion Internet users, add the machines that generate records without any human action at all — sensors, cameras, ticket gates, weather stations — and the scale becomes hard to imagine. Fig. 3.8 shows the kinds of sources at work. The important point is not any single number, which would be out of date before this book is printed, but the shape of the situation: the quantity is enormous, it grows continuously, and much of it is generated automatically.
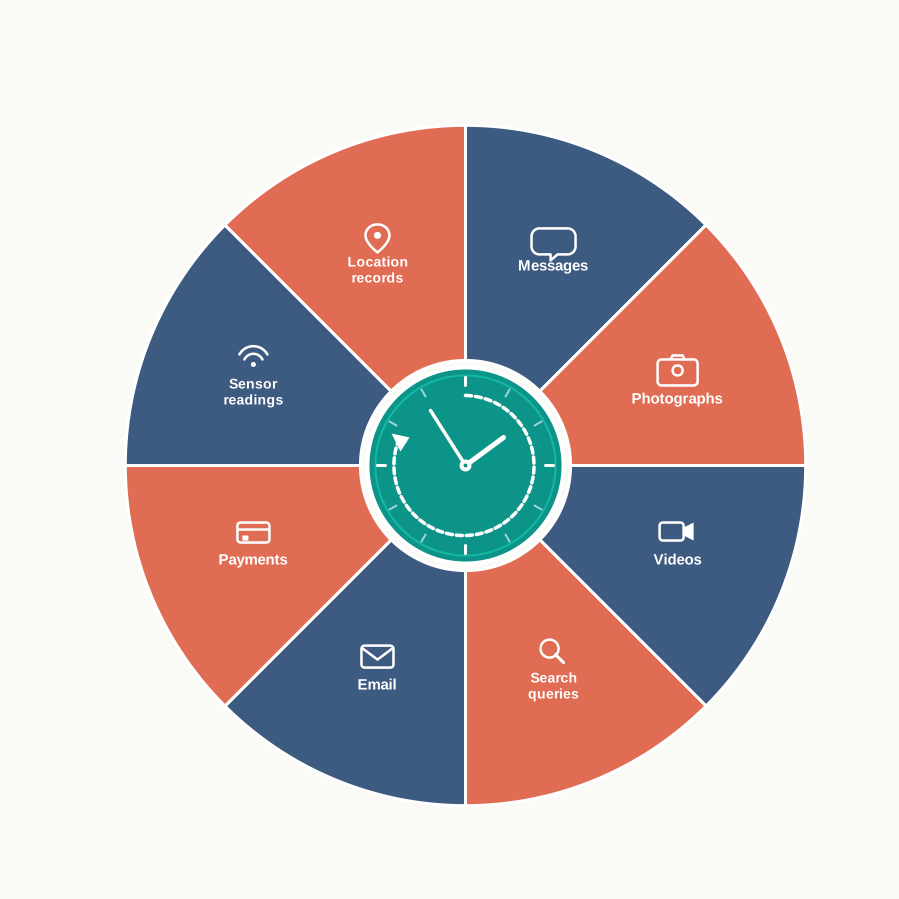
Fig. 3.8 – Continuous generation of digital data.
Data on this scale behaves differently from the data you are used to. A class’s marks list can be opened in a spreadsheet, sorted and totalled on any school computer. A record of every ticket sold on every bus in a state for five years cannot. It will not fit in one machine’s memory, it will not load in a reasonable time, and much of it is not neatly arranged in rows and columns to begin with.
Data sets of that kind are called big data — data sets so large and so complex that traditional data processing tools cannot store, process and analyse them.
How large is large
Some sense of scale helps. A page of plain text is a few kilobytes. A photograph from a phone is a few megabytes. A film is a few gigabytes. Taking the decimal prefixes used for data sizes, \(1\ \text{KB} = 10^{3}\) bytes, \(1\ \text{MB} = 10^{6}\) bytes, \(1\ \text{GB} = 10^{9}\) bytes, \(1\ \text{TB} = 10^{12}\) bytes and \(1\ \text{PB} = 10^{15}\) bytes, where a byte is the amount of storage needed for one character of ordinary text. Organisations working with big data routinely deal in terabytes and petabytes, which is why a single computer is the wrong tool for the job.
Notice also that “big” is a relative word, and deliberately so. The definition does not fix a size in gigabytes; it says the data is beyond what the available tools can handle. A quantity of data that defeated an organisation ten years ago may be comfortable for it today. What makes a data set big is the mismatch between the data and the means of processing it.
Why it is difficult, apart from its size
Size alone would be a storage problem, and storage is cheap. The difficulty is that big data brings a whole cluster of problems with it: integrating data that arrives from many different systems in many different forms, storing it so that it can be retrieved, searching it, processing it, transferring it from place to place, querying it, and presenting the result in a form a person can actually read.
The reward for solving those problems is that such data often contains patterns of real value — which routes are congested and at what hour, which crops failed in which soil conditions, which stage of a course students most often abandon. None of these facts is written anywhere in the data. They have to be extracted from it, and that is why so much effort now goes into developing software and methods for the purpose.
3.3.1 Characteristics of Big Data
Five characteristics are used to distinguish big data from ordinary data. They are conventionally listed as Volume, Velocity, Variety, Veracity and Value, and are shown together in Fig. 3.9. Take them one at a time, because they are five different difficulties, not five ways of saying “large”.
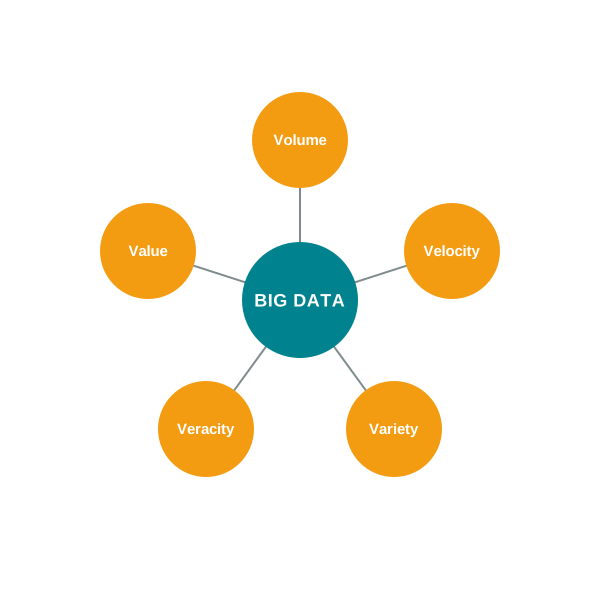
Fig. 3.9 – The five characteristics of big data.
Volume
Volume is the sheer size of the data, and it is the most prominent characteristic. If a data set is so large that ordinary database tools cannot process it, it qualifies on this count alone. Volume is what forces data to be spread across many machines rather than held in one.
Velocity
Velocity is the rate at which the data is generated and stored. Traditional data arrives in batches — a month’s sales, a term’s marks. Big data arrives as a continuous stream, at a far higher rate, and often has to be handled as it arrives rather than afterwards. A system watching traffic sensors across a city cannot wait until midnight to look at the morning’s readings.
Variety
Variety asserts that the data set contains data of many different forms. Structured data is arranged in a fixed pattern of rows and columns, like a marks table. Unstructured data has no such arrangement — text of messages, photographs, videos, audio recordings, web pages. Semi-structured data sits between the two: it carries some organising marks or labels but does not fit a fixed table. Table 3.5 sets the three apart. Most big data is unstructured, which is precisely why traditional tools, built for tables, are defeated by it.
Table 3.5 – structured, semi-structured and unstructured data
| Feature | Structured data | Semi-structured data | Unstructured data |
|---|---|---|---|
| Arrangement | Fixed rows and columns, decided in advance | Carries labels or tags, but no fixed table | No predefined arrangement at all |
| Example | A table of bus routes with fare and distance | A web page with tagged headings and fields | Photographs, videos, chat messages, audio |
| Ease of searching | Straightforward, using ordinary queries | Possible, using the labels | Difficult; needs specialised processing |
| Share of big data | Small | Moderate | The largest part |
Veracity
Veracity refers to the trustworthiness of the data. Data collected on a large scale is rarely clean: readings are missing, a sensor drifts out of calibration, the same person appears twice under two spellings, a form is filled carelessly, one region is over-represented because collection was easier there. Processing such data without noticing gives results that are wrong, and — worse — wrong with an air of authority, because they came out of a large computation. Veracity is the characteristic that forces a check on the data before conclusions are drawn from it.
Value
Value asks the plain question: is any of this worth extracting? Big data is not merely a large pile; the reason for keeping it is that it may hold hidden patterns and useful knowledge. But storing, transferring and processing it costs money, machines and time. A preliminary enquiry into whether the data holds anything of value is therefore worth making before the effort is spent, or the whole exercise may return nothing.
3.3.2 Data Analytics
Collecting data is not the point. Learning something from it is. Data analytics is the process of examining data sets in order to draw conclusions about the information they contain, with the aid of specialised systems and software.
The order of work matters, and Fig. 3.10 sets it out. Raw data is gathered from its sources and cleaned — duplicates removed, missing values dealt with, obvious errors corrected. It is then organised into a form that can be worked on, examined for patterns and relationships, and finally presented, usually as a chart or a summary, so that a person can act on it. The last step is not decoration. A conclusion nobody can read changes nothing.
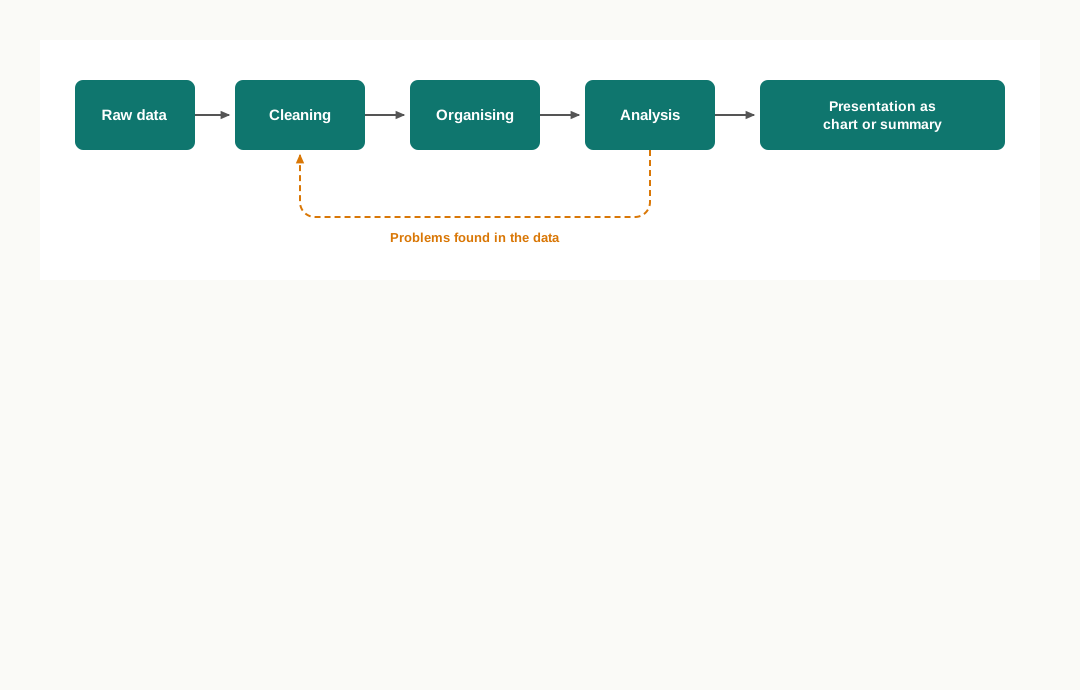
Fig. 3.10 – The data analytics process.
Analytics is used wherever decisions rest on evidence. A transport department examines ticket data to decide where an extra bus is needed and at what hour. A hospital examines admission records to plan staffing. A researcher examines experimental readings to see whether they support or contradict a hypothesis — and here it is worth noticing that analytics is as useful for disproving a claim as for supporting one, which is exactly what makes it honest work.
The tools are ordinary programming tools. Python is widely used for this purpose, because libraries exist for it that handle large tables of data directly, letting a person filter, group and summarise thousands of rows with a few lines of code instead of writing that machinery by hand.
One caution belongs here, and it follows straight from veracity. Analysis cannot repair data. If the readings were biased in collection, every conclusion drawn from them will carry that bias forward, stated more confidently than before. The first question to ask of any analysis is not “what does it show?” but “where did this data come from, and what is missing from it?”
3.4 Internet of Things (IoT)
When we speak of a computer network, we usually mean a network of computers — laptops, desktops, servers, and portable devices such as tablets, smartphones and smart watches, joined by wire or wirelessly, exchanging data with one another over the Internet or over a local network. Every member of that network is a machine built for computing.
Now extend the idea. Suppose the bulbs, the ceiling fan, the door lock and the refrigerator in a house were also members of that network. What would they have to say? A refrigerator could report that its door has been left open. A water tank could report its level. A door lock could report that it is still unlocked at eleven at night. And in the other direction, they could be told things: switch off, warm up at six, unlock for the person now at the gate.
This is the idea of the Internet of Things (IoT) — a network of devices that have embedded hardware and software allowing them to connect to a network and exchange data with other devices on it. Fig. 3.11 shows the picture: a network whose members are ordinary objects rather than computers.
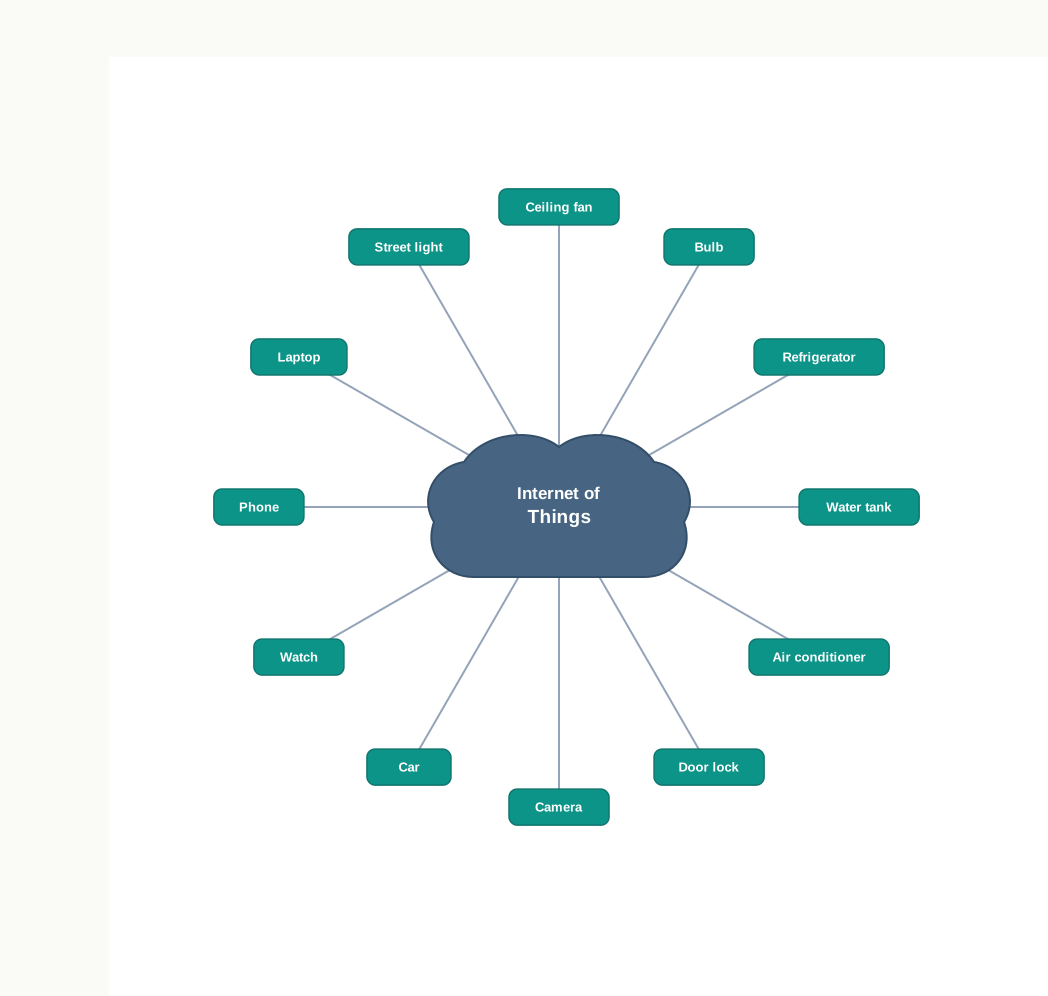
Fig. 3.11 – Everyday devices connected to the Internet of Things.
What turns an object into a “thing”
An ordinary refrigerator cannot join a network, so something has to be added to it. Four things are needed, and it is worth naming them because they explain both the possibilities and the costs.
The object needs a way to observe or to act — a sensor to measure temperature or a switch to cut power. It needs a small computer inside it to run the necessary instructions; this is usually a microcontroller, a complete tiny computer on a single chip, with its processor, memory and input–output connections built in, designed to sit inside a device and control it. It needs a way to communicate, generally wireless. And it needs an identity on the network, so that a message meant for this refrigerator does not reach the neighbour’s.
Notice what has been added and what has not. The refrigerator still cools food exactly as before. What is new is that it can now report what it is doing and be told what to do next.
At present, most household devices with advanced hardware and software are used in isolation from one another, and every operation needs a person to perform it. You switch the geyser on; you remember to switch it off. IoT tends to bring these devices together so that they work in collaboration — the geyser learns the household’s timings, the lights respond to whether a room is occupied, and the whole set can be reached from a phone whether you are in the next room or in another city.
The cost of connecting everything
Two honest limitations should be recorded before we go further. A connected device sends data about a household out of that household, and a record of when your lights go on and off says a good deal about your life. And a device on a network can be reached over that network, so a poorly protected appliance weakens the security of everything else on it. These are reasons to insist on well-made devices, changed default passwords and updated software — not reasons to avoid the technology, but not small matters either.
3.4.1 Web of Things (WoT)
The Internet of Things lets you interact with devices through a phone or a computer, which is convenient until you count the applications. Each manufacturer supplies its own, so a house with devices from eight makers needs eight applications, each with its own login, its own arrangement of buttons and its own idea of what a schedule is. Nothing connects them, and a rule as simple as “when the last person leaves, switch everything off” cannot be written at all, because no single application can see all the devices.
We already have a system in which anything can be reached in one uniform way, through one program: the web. A web page is fetched, read and acted on by a browser, whatever machine it came from. If a fan, a lock and a sensor could each be reached in that same way, one interface would serve all of them.
That is what the Web of Things (WoT) proposes. It allows web services to be used to connect anything in the physical world, alongside the human identities already on the web, so that devices from different makers can be reached and combined through a common set of web standards. It is on this foundation that smart homes, smart offices and smart cities can realistically be built, because it removes the requirement that everything come from one manufacturer.
Table 3.6 – Internet of Things vs Web of Things
| Feature | Internet of Things | Web of Things |
|---|---|---|
| What it provides | The network connectivity that lets devices exchange data | A common way of reaching those devices, built on web standards |
| Level at which it works | Devices, connections and data exchange | Services and interfaces on top of the connected devices |
| Access to a device | Usually through the application supplied for it | Through any browser or program that speaks the web standards |
| Combining devices of different makes | Difficult, since each has its own application | Straightforward, since all are reached the same way |
| Relation between the two | The layer beneath | The layer above, and dependent on it |
3.4.2 Sensors
Hold a phone upright and the display stands upright; turn it on its side and the display turns with it. The phone is not watching you. It is reading two of its own components: an accelerometer, which detects the orientation of the phone with respect to gravity, and a gyroscope, which tracks rotation or twist and adds that information to what the accelerometer supplies. Between them, they tell the software which way is down. Fig. 3.12 shows what each contributes.
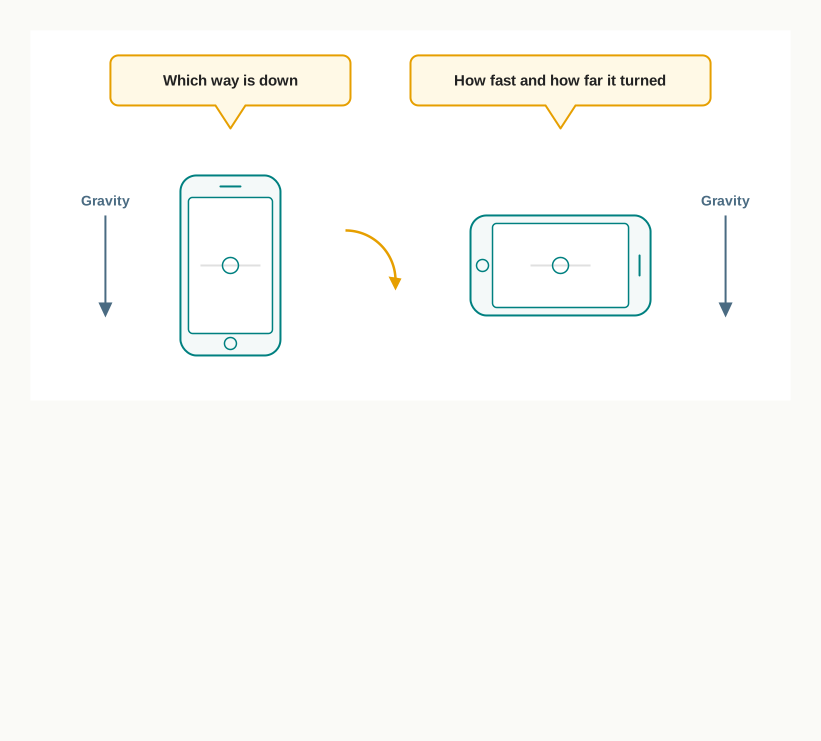
Fig. 3.12 – Accelerometer and gyroscope inputs in a phone.
Sensors of this kind are the monitoring and observing elements of any real-world application, and their steady improvement is one of the main reasons IoT has become possible at all. A sensor that is cheap, small and needs little power can be placed anywhere — in a device, on a bridge, in a field.
The kind of sensor that matters most for IoT does more than measure. A smart sensor takes input from the physical environment and uses its own built-in computing resources to perform predefined functions upon detecting a specific input, processing the data before passing it on.
That last phrase is the whole point of the word “smart”. A plain sensor sends every reading onward and lets some other machine decide what matters. A smart sensor decides locally: it can discard a reading that is within the normal range, average a hundred readings into one, or raise an alert only when a threshold is crossed. This saves network traffic, saves power, and lets the device respond immediately instead of waiting for an answer to come back. Table 3.7 lists sensors you will meet often.
Table 3.7 – common sensors, what each measures, and a typical use
| Sensor | What it measures | A typical use |
|---|---|---|
| Accelerometer | Orientation and change of speed | Turning a phone display upright |
| Gyroscope | Rotation or twist | Steadying a camera image while the hand moves |
| Temperature sensor | Warmth of air, water or a surface | Switching a cold store’s compressor on and off |
| Proximity sensor | Nearness of an object | Blanking a phone screen held against the ear |
| Light sensor | Brightness of the surroundings | Dimming a display, or switching a street light on at dusk |
| Humidity sensor | Moisture in the air or soil | Deciding when a field needs watering |
3.4.3 Smart Cities
Cities are filling up faster than they are being built. With rapid urbanisation, the load on a city grows year by year, and with it the difficulty of managing land, water, waste, air quality, health and sanitation, traffic congestion, public safety and security, along with the roads, railways, bridges, electricity supply, subways and public facilities that everything else depends on. Adding capacity is expensive and slow. Using existing capacity better is often cheaper and faster, and that requires knowing, at any moment, what is actually happening across the city.
A smart city is one that uses computer and communication technology together with IoT to manage and distribute its resources efficiently. Fig. 3.13 shows several such arrangements at once.
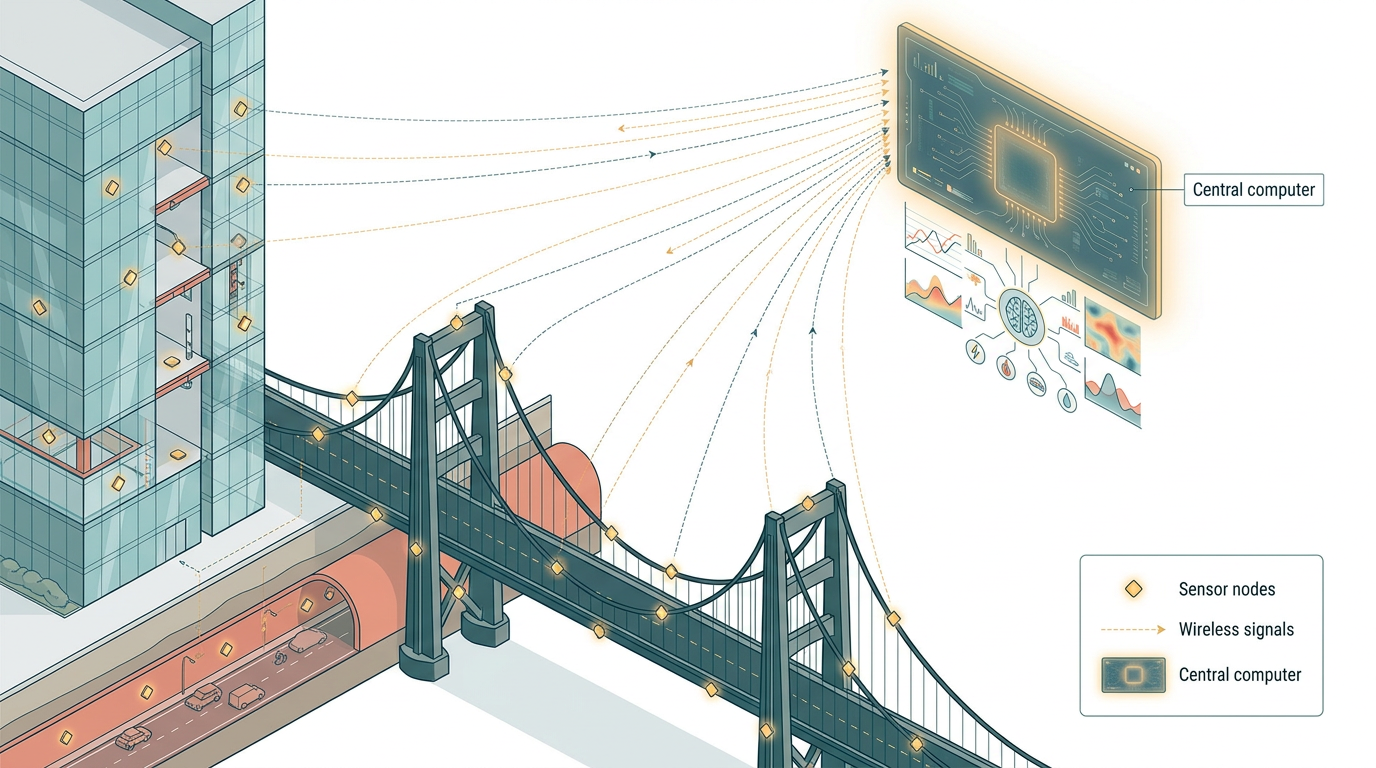
Fig. 3.13 – Distributed sensors in a smart city.
The examples in that figure are worth reading closely, because each follows the same pattern. A smart building carries sensors that detect earthquake tremors and can warn nearby buildings so that they prepare accordingly — the value lies in the few seconds of warning, which are enough to stop a lift at the nearest floor. A smart bridge uses wireless sensors to detect a loose bolt, a frayed cable or a crack, and alerts the concerned authorities by SMS, so that a fault is found while it is still small. A smart tunnel uses wireless sensors to detect a leak or a build-up of congestion inside it.
In each case, readings pass as wireless signals across a network of sensor nodes to a centralised computer for further analysis. Notice that no single sensor understands anything; the understanding comes from bringing many readings together in one place, which is exactly the situation described in section 3.3.
The same approach extends across every sphere of a city — transport systems, power plants, water supply networks, waste management, law enforcement, information systems, schools, libraries and hospitals — with the aim of making them work in unison rather than each in ignorance of the others. That, and not the gadgets, is what the word “smart” is meant to describe.
3.5 Cloud Computing
Suppose your school decides to put its library catalogue online, so that any student can check from home whether a book is available. Ten years ago that would have meant buying a server, finding a room for it, arranging a permanent connection, paying somebody to look after it, and hoping the estimate of how many students would use it was roughly right. Buy too small a machine and the site fails in examination week. Buy too large a machine and most of it stands idle all year.
Notice the awkward part of that arrangement. Before you can use any computing power at all, you must own it — and you must decide how much to own before you know how much you need.
Cloud computing removes that requirement. It is an arrangement in which computer-based services are delivered over the Internet, and are available to a user from anywhere, on any device. The services include software, hardware such as servers, databases and storage. They are provided by organisations called cloud service providers, who usually charge on a pay-per-use basis — much as you pay for electricity, by the amount consumed rather than by buying a share of the power station.
You have almost certainly used it already. Storing photographs and files as a backup somewhere other than your own device is a cloud service. So is editing a document in a browser without installing anything, and so is hosting a website.
On-demand resources
The phrase that captures the change is on-demand service — a resource that is provided when it is asked for, in the quantity asked for, and paid for only for as long as it is used. A user can run a large application, or process a large amount of data, without owning the storage or the processing power needed, so long as they are connected to the Internet.
This is what makes the library catalogue affordable. In examination week the service can be given more capacity for a few days; in the holidays it can be reduced. Nothing is bought, and nothing stands idle.
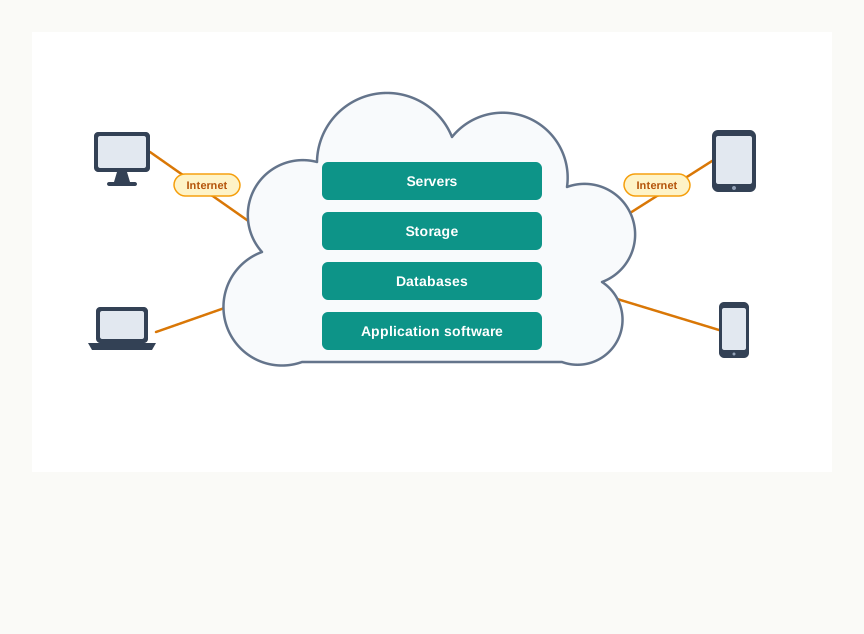
Fig. 3.14 – Accessing cloud computing services.
3.5.1 Cloud Services
The clearest way to understand the cloud is to treat everything as a service — a “service” being any facility the cloud provides. Three standard models are used to categorise the computing services delivered through the cloud, shown in Fig. 3.14 and taken in turn below: Infrastructure as a Service (IaaS), Platform as a Service (PaaS), and Software as a Service (SaaS).
The three differ in one respect only: how much of the arrangement the provider looks after, and how much is left to you. Reading them in that order — from most left to you, to least — makes the set easy to hold in mind.
3.5.1.1 Infrastructure as a Service (IaaS)
An IaaS provider offers computing infrastructure of different kinds: servers, virtual machines, storage and backup facilities, network components, operating systems, and other hardware or software.
A virtual machine (VM) deserves a word here, since the whole model rests on it. A virtual machine is a complete computer created in software — with its own operating system, memory and disk — running on a shared physical machine alongside others. To the user it behaves exactly like a separate computer, which is what allows one powerful machine in a data centre to be rented to several users at once, each isolated from the rest.
Using IaaS, a user takes hardware infrastructure located at a remote site and configures it, deploys software on it, and runs whatever application they choose on that infrastructure. The hardware and software are outsourced on a demand basis and paid for as used, which saves not only the cost of the equipment but the costs that follow it — setting up, maintenance and security.
What is left to the user is everything above the machine: choosing and installing the software, keeping it updated, and making it work. IaaS gives the most freedom of the three models, and asks the most in return.
3.5.1.2 Platform as a Service (PaaS)
Most people who rent a server do not want a bare machine. They want a place where their application will simply run.
PaaS is the facility in which a user can install and execute an application without concerning themselves with the underlying infrastructure or its setup. It provides a platform, or environment, in which to develop, test and deliver software applications.
Take a concrete case. Suppose a web application has been written using Python and MySQL. To run it online under PaaS, one obtains a server from the cloud on which Python and MySQL are already installed and the web server is already configured. Nothing has to be installed or configured; the application is simply placed there and runs.
The user retains complete control over the deployed application and its configuration — it is still their program, behaving as they wrote it. What they have given up is control over the layer beneath, which is precisely what they wanted to be rid of. For a developer, this reduces both the cost and the complexity of buying and managing hardware and software.
3.5.1.3 Software as a Service (SaaS)
The third model takes the last step. SaaS provides on-demand access to application software itself, usually under a licence or a subscription taken by the user.
When you edit a document, prepare a spreadsheet or fill a form in a browser, without having installed the program on your own machine, you are using SaaS. The user is not concerned with installation or configuration of the software at all, as long as it is accessible. As in PaaS, the user is still given access to the configuration settings of the application they are using — the choices that belong to the user, such as preferences and permissions, remain theirs.
Table 3.8 – the three cloud service models compared
| Feature | IaaS | PaaS | SaaS |
|---|---|---|---|
| What the provider supplies | Servers, virtual machines, storage, network components | A ready environment to develop, test and run applications | Finished application software |
| What the user manages | The operating system, the software installed and the application | Only the application and its configuration | Only their own settings and data |
| Skill demanded of the user | Highest — the user builds the arrangement | Moderate — the user writes and deploys the application | Least — the user simply uses the software |
| Suits | An organisation needing full control over its systems | A developer who wants an application to run without managing servers | Anyone needing to use a program without installing it |
| Everyday illustration | Renting a bare plot on which to build | Renting a built house, and arranging your own rooms | Staying in a serviced room |
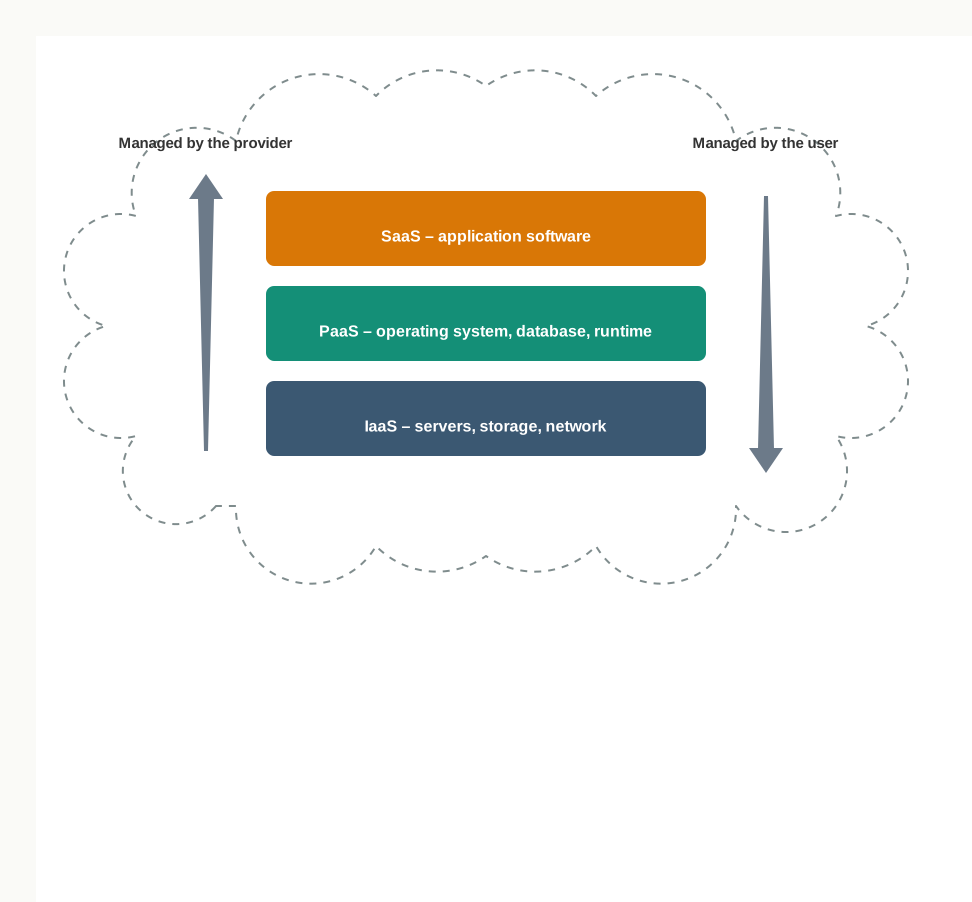
Fig. 3.15 – The three cloud service models.
What the three models have in common
In every one of these models, the user obtains infrastructure, platform or software on demand and is charged according to usage. The common consequence matters more than the differences: a new or growing organisation no longer needs a large investment before it can begin. A group of students with an idea and no equipment can put a working service online and pay only for what it actually uses.
Governments have taken up the same reasoning. To make use of cloud computing across its departments, the Government of India launched an initiative known as GI Cloud, named MeghRaj, so that public services could share computing resources rather than each department procuring and running its own.
3.6 Grid Computing
Look around a computer laboratory at four in the afternoon, after the last class has left. Forty machines are switched on, and every one of them is doing nothing. The same is true of most computers most of the time: the processor waits between keystrokes, and the waiting is wasted.
Now put that observation beside a different problem — a calculation so large that no single machine in the building could finish it in a month. The two facts together suggest an arrangement. If the large task could be cut into forty smaller pieces, and each idle machine given one piece, the work might be done in an evening. This is the reasoning behind grid computing, and the arrangement described at the opening of this chapter was a grid of exactly this kind.
A grid is a computer network of geographically dispersed and heterogeneous computational resources. Two words in that sentence carry the meaning. Geographically dispersed means the machines need not be in one room, one building or one country. Heterogeneous means they need not be alike — a grid may combine desktops, laptops, workstations and servers, of different makes, ages and speeds.
The constituent resources of a grid are called nodes. What distinguishes a grid from an ordinary network is what the nodes do: they temporarily come together to solve a single large task and to reach a common goal, and they disperse afterwards. The effect, from the point of view of the task, is a virtual supercomputer with enormous processing power and storage — assembled out of machines that were bought for something else entirely. Fig. 3.16 shows the arrangement.
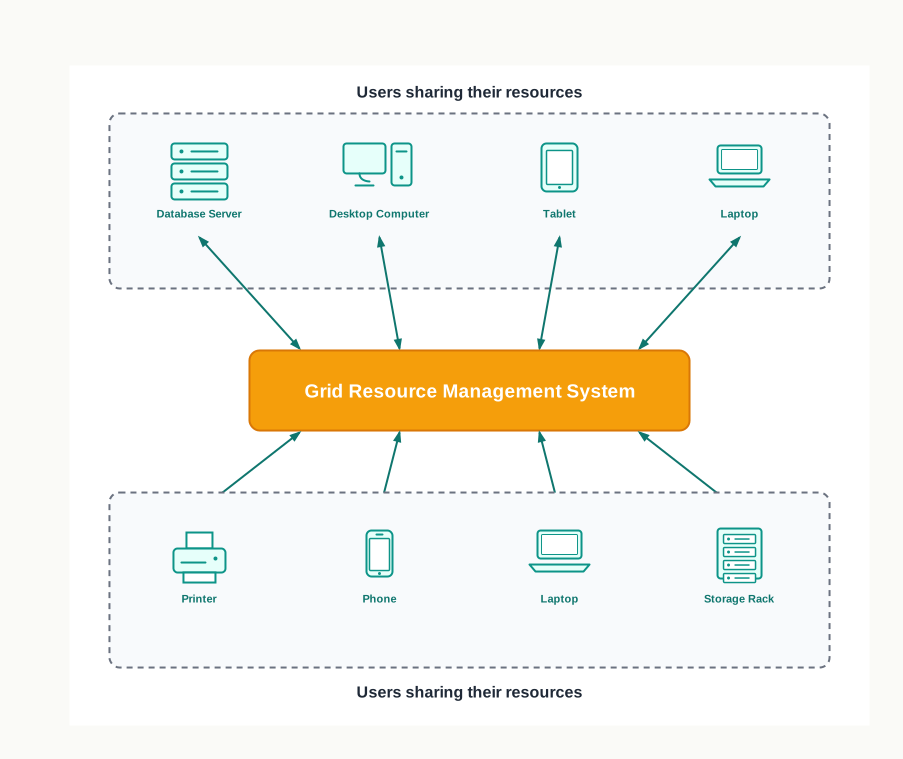
Fig. 3.16 – A grid computing architecture.
Why the idea is worth taking seriously
Countless computational nodes, ranging from hand-held mobile devices to personal computers and workstations, are already connected to a local network or to the Internet. They have been paid for, they are powered, and their memory and processing capacity sit largely unused. Reusing that capacity is economically sensible in a way that buying more machines is not.
The consequence matters most where money is scarce and problems are large. A grid provides an opportunity to solve computationally intense scientific and research problems without actually procuring costly hardware — which is why the approach took hold in universities and research institutions long before it reached industry.
Two kinds of grid
A grid can be of two types.
The first is a data grid, used to manage large and distributed data that requires multi-user access. Here the difficulty being solved is not calculation but storage and reach: the data is spread across many sites, and many people in many places need to work with it as though it were one collection.
The second is a CPU or processor grid, where processing is moved from one computer to another as needed, or where a large task is divided into subtasks that are distributed to various nodes for parallel processing. This is the type in the laboratory example above, and it is shown in Fig. 3.17.
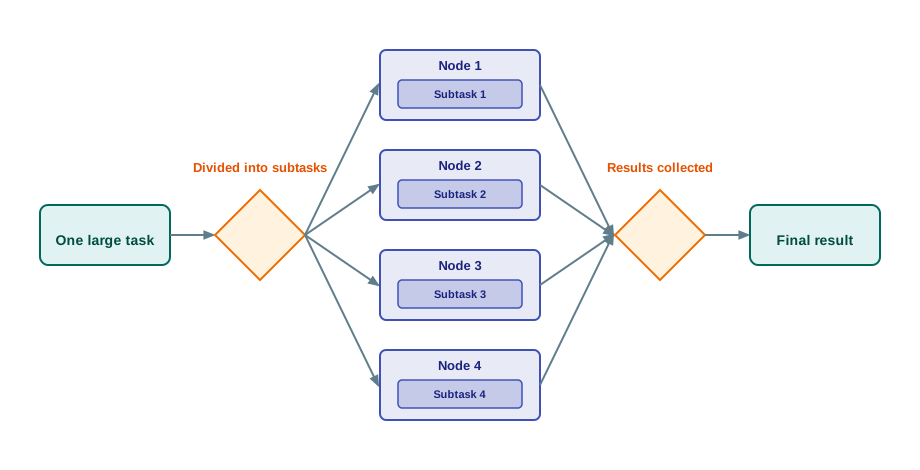
Fig. 3.17 – Parallel processing in a CPU grid.
How a grid is different from cloud computing
These two topics are easily confused, because both involve using computing power that is not in front of you. The difference lies in who provides it and why.
In an IaaS cloud service, there is a service provider who owns infrastructure and rents it to users, charging for the use. The provider’s purpose is to supply services, and the arrangement is commercial and permanent. In grid computing, there is no such supplier: multiple computing nodes, often belonging to different owners, join together to solve a common computational problem, and a grid is more application specific — it is built around a particular task rather than offered as a general service.
Table 3.9 – cloud computing compared with grid computing
| Feature | Cloud computing | Grid computing |
|---|---|---|
| Purpose | To provide computing services to users | To solve one large computational problem |
| Who supplies the resources | A service provider, from its own infrastructure | Many independent owners, contributing their nodes |
| Relationship of the parts | Provider and customer | Cooperating peers working towards a common goal |
| Nature of the resources | Uniform, managed as one pool | Heterogeneous and geographically dispersed |
| Duration | Available continuously as a service | Nodes join temporarily, for the task at hand |
| Payment | Charged according to usage | Usually contributed, not sold |
Holding a grid together
Nodes that differ in make, operating system and speed do not cooperate by themselves. To set up a grid by connecting numerous nodes, in terms of both data and processing, a layer of software called middleware is required to implement the distributed processor architecture.
Middleware sits between the individual machines and the application, and does the work of making many computers behave as one: deciding which node receives which subtask, moving the data to it, collecting results, and noticing when a node has stopped answering. The Globus Toolkit is one such open-source software toolkit used for building grids, and it includes software for security, resource management, data management, communication and fault detection.
That last item is not a minor feature. In a grid the nodes are not under one authority — a machine may be switched off, taken home, or disconnected in the middle of a subtask. The middleware must assume this will happen and re-issue the work elsewhere, which is why a grid is harder to build than its simple description suggests.
Two further limits are worth recording. Moving data to a node costs time, so a task whose data is enormous and whose calculation is small can take longer on a grid than on one machine. And the security question is unavoidable: a grid asks the owner of every node to run somebody else’s work on their machine, and asks the owner of the problem to trust results computed on machines they do not control.
3.7 Blockchains
Consider how a digital transaction is ordinarily recorded. A bank, or a ticket booking service, keeps one central database. When a transaction is performed, the database is updated — one entry at a time, by the organisation that owns it. Everyone involved trusts that record because they trust the organisation keeping it.
The arrangement works, and it has two weaknesses that follow from the same fact. Because all the data sits in one place, that place can be attacked, and it can be lost. And because one organisation holds the only copy, anyone who doubts an entry has no independent record to check it against.
Keeping the record everywhere instead of somewhere
Blockchain technology works on a different principle: a decentralised and shared database, in which each participating computer holds a copy of the whole thing. There is no single copy to attack, and no single owner to trust.
The unit of storage is a block — a secured chunk of data, holding a valid transaction. Each block carries some data called its header, which is visible to every other node in the network, while the private data of the block remains accessible only to its owner. Blocks link one after another in sequence, and the resulting chain of blocks is what gives the technology its name, as shown in Fig. 3.18.
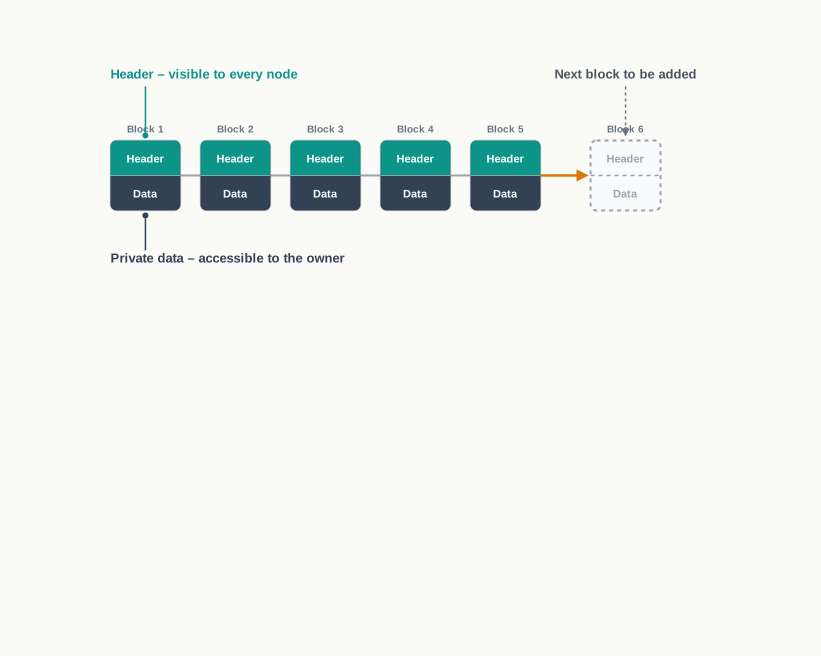
Fig. 3.18 – Structure of a blockchain.
A blockchain, then, is a system that allows a group of connected computers to maintain a single updated and secure ledger. Every computer, or node, that participates receives a full copy of the database.
An append-only ledger
The word ledger is worth pausing on, because it is borrowed deliberately from ordinary book-keeping. A ledger is a running record of transactions, kept in order, in which entries accumulate rather than replace one another.
A blockchain maintains an ‘append only’ open ledger. New records are added at the end; existing records are never edited or removed. And a record is added only after all the nodes within the network have authenticated the transaction, which is the sequence set out in Fig. 3.19.
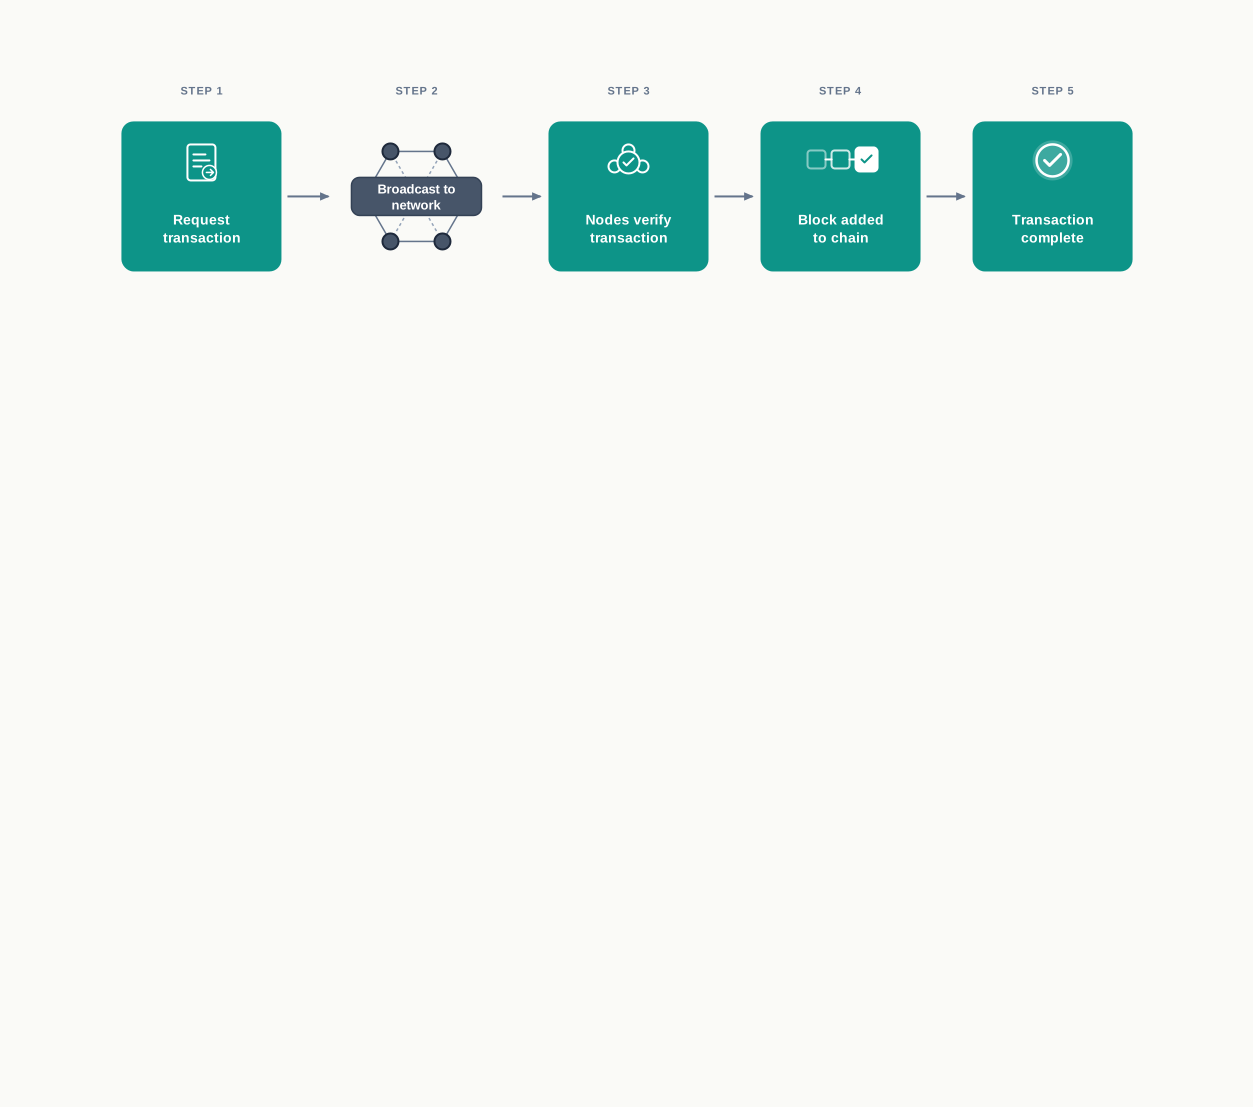
Fig. 3.19 – Adding a new block to the ledger.
Safety and security of the transactions rest on that arrangement rather than on any guard placed around a single machine. Since every member of the network keeps a copy of the blockchain, it is not possible for a single member to alter the data — an altered copy simply disagrees with all the others and is rejected.
Table 3.10 – a centralised database compared with a blockchain
| Feature | Centralised database | Blockchain |
|---|---|---|
| Where the data is kept | In one place, owned by one organisation | On every participating node, as a full copy |
| Who may update it | The owning organisation | Any participant, after the nodes authenticate the transaction |
| Editing an existing record | Possible — records can be changed or deleted | Not possible — records are only added |
| Effect of one machine failing | The service may stop, and data may be lost | No effect; every other node still holds the record |
| Basis of trust | Trust in the organisation that keeps it | Agreement among many independent nodes |
| Cost of operation | One copy to store and maintain | Every record stored and verified many times over |
Where it is being used
The most widely known application of blockchain technology is digital currency, where a record of who holds what must be maintained without any central bank keeping it. But the properties that make it suitable there — decentralisation, openness and resistance to alteration — are of interest wherever transparency, accountability and efficiency are wanted, in business and in systems of governance alike.
Three examples show the range. In healthcare, better sharing of records between providers raises the chance of accurate diagnosis and effective treatment, and lets organisations deliver care more economically, while the history of who added what remains visible. In land registration, a shared unalterable record of ownership would remove a common source of disputes over ownership claims and encroachment. In voting, a system built on a ledger of this kind addresses the problem of votes being altered after they are cast, since everything recorded stays recorded and open to scrutiny. Beyond these, the technology is being taken up in banking, media, telecom, travel and hospitality, among other sectors.
What the design costs
Every one of those benefits is bought with duplication. The same record is stored on every node and verified by every node, so a blockchain is slower, more expensive in storage and far more demanding in energy than a single database doing the same work. For a task where one trusted organisation can perfectly well keep the record, that cost buys nothing.
The honest way to judge a proposal, then, is to ask a single question first: do the participants have reason to distrust one another, or to distrust a central keeper of the record? If they do, the expense begins to look sensible. If they do not, an ordinary database is the better engineering.
3.8 Summary
Emerging trends
An emerging trend is a state-of-the-art technology that has moved past the experimental stage and is being taken up widely enough to set a new pattern of use. Many new technologies appear and fade; only those that spread and change how a task is done become trends.
Each technology in this chapter answers a limit of ordinary computing — a limit of intelligence, of scale, of reach, of ownership, of processing power, or of trust. Knowing which limit a technology addresses is the quickest way to understand it.
Artificial intelligence
Artificial intelligence is the branch of computer science that builds machines able to simulate intelligent human behaviour — learning, recognising, reasoning, understanding language and making decisions — with little human intervention. An AI system reasons from a knowledge base, a store of facts, assumptions and rules, and can add to that store from the outcomes of its own earlier decisions.
Machine learning is a subsystem of AI in which a computer learns from data using statistical techniques instead of being explicitly programmed for the task. The learning program is called a model. It is adjusted on training data, whose correct answers are shown to it, and then judged on testing data, which is kept aside and never shown during learning. Only when its accuracy on the testing data is acceptable is it used to predict on new, unknown data.
A model learns only what its data contains. Unrepresentative or biased data produces a model that fails silently on everything outside its experience, which is why performance on unseen data, and not on training data, is the honest measure of learning.
Natural language processing is the area of AI concerned with interaction between humans and computers through human languages. Its two everyday conversions are speech-to-text and text-to-speech; machine translation and automated customer service are growing application areas. Natural language is hard for machines because it is ambiguous, incomplete and understood largely from context, unlike a programming language.
An immersive experience is a computer-generated experience that engages the senses strongly enough for the user to feel present within the scene. It is achieved by two opposite means. Virtual reality supplies a wholly computer-generated three-dimensional environment and hides the real surroundings. Augmented reality leaves the real surroundings visible and superimposes computer-generated information on them; its commonest form is location-based.
A robot is a machine that carries out one or more tasks automatically with accuracy and precision and, unlike an ordinary automatic machine, is programmable by a computer. Robotics is the interdisciplinary branch of technology dealing with the design, fabrication, operation and application of robots.
A robot works by a repeating cycle of sensing, deciding and acting: sensors report the surroundings, a controller decides using the program, and actuators act. Robots are of many types, such as wheeled robots, legged robots, manipulators and humanoids, and are used in industry, medical science, bionics, scientific research and defence. They perform well in structured surroundings and badly in unstructured ones.
Big data
Big data refers to data sets of such enormous volume and complexity that traditional data processing tools cannot capture, store, process and analyse them. The definition is deliberately relative: what makes data “big” is the mismatch between the data and the available means of processing it, not any fixed number of bytes.
Five characteristics distinguish big data from traditional data: Volume, Velocity, Variety, Veracity and Value. Volume is its sheer size; Velocity the rate at which it is generated and stored; Variety the mixture of structured, semi-structured and unstructured forms; Veracity the trustworthiness of the data; and Value the question of whether the knowledge hidden in it is worth the cost of extracting.
Structured data is arranged in fixed rows and columns; unstructured data — text, images, audio, video — has no predefined arrangement; semi-structured data carries labels without fitting a fixed table. Most big data is unstructured, which is precisely why tools built for tables fail on it.
Data analytics is the process of examining data sets, with the aid of specialised systems and software, in order to draw conclusions about the information they contain. Analytics is the activity; big data is the material it works on. Analysis cannot repair data — a bias in collection reappears in every conclusion drawn from it.
Internet of Things
The Internet of Things is a network of devices that carry embedded hardware and software allowing them to connect to a network and exchange data with other devices on it. An ordinary object becomes part of it when it is given a way to sense or act, a microcontroller to run instructions, a means of communication and an identity on the network.
The Web of Things allows web services to be used to connect anything in the physical world, alongside the human identities already on the web. It is built on top of IoT, not instead of it: IoT supplies the connectivity, while WoT supplies one common way of reaching devices of different makes, which is what makes smart homes, smart offices and smart cities practicable.
A smart sensor takes input from the physical environment and uses built-in computing resources to perform predefined functions upon detection of a specific input, processing the data before passing it on. Deciding locally — discarding an ordinary reading, averaging many, alerting only on a threshold — saves network traffic and power, and allows immediate response.
A smart city uses computing and communication technology together with IoT to manage and distribute its resources efficiently. Sensor nodes on buildings, bridges and tunnels pass readings as wireless signals to a centralised computer for analysis, so that faults and conditions are noticed while they are still small. No single sensor understands anything; the understanding comes from bringing many readings together.
Cloud computing
Cloud computing delivers computer-based services — software, servers, databases and storage — over the Internet, accessible from anywhere on any device, and charged on a pay-per-use basis by organisations called cloud service providers. An on-demand service is one supplied at the moment it is requested, in the quantity requested, and paid for only while in use.
Three standard models categorise cloud services: Infrastructure as a Service (IaaS), Platform as a Service (PaaS) and Software as a Service (SaaS). IaaS supplies servers, virtual machines, storage and network components, leaving the software to the user. PaaS supplies a ready environment in which to develop, test and run an application, with the user retaining control over the application and its configuration. SaaS supplies the finished application software itself, usually by licence or subscription.
A virtual machine is a complete computer created in software, with its own operating system, memory and disk, running on a shared physical machine — which is what allows one machine in a data centre to serve several users, each isolated from the rest.
The shared consequence of all three models is that a new or growing organisation need not make a large investment before it can begin. The costs are that the service exists only while the connection does, and that the data sits on machines the user does not control.
Grid computing
A grid is a computer network of geographically dispersed and heterogeneous computational resources. Its constituent resources are called nodes, and they come together temporarily to solve a single large task and reach a common goal, creating the effect of a virtual supercomputer with enormous processing power and storage.
A grid can be of two types: a data grid, used to manage large and distributed data requiring multi-user access, and a CPU or processor grid, where processing is moved from one machine to another as needed, or a large task is divided into subtasks distributed to various nodes for parallel processing.
Grid computing differs from an IaaS cloud service in who provides the resources and why. In IaaS a service provider rents its own infrastructure to users; in a grid, independent nodes belonging to different owners join to solve a common computational problem. The cloud sells capacity; a grid pools it.
Middleware is the layer of software required to implement the distributed processor architecture — allotting subtasks, moving data, collecting results and detecting failed nodes. A grid suits work that divides into independent parts, and gains nothing on a task whose every step depends on the one before it.
Blockchains
A blockchain is a system that allows a group of connected computers to maintain a single updated and secure ledger, of which every participating node holds a full copy. A block is a secured chunk of data holding a valid transaction; its header is visible to every node, while its private data is accessible to its owner alone, and such blocks form a chain.
The ledger is append only: entries are added at the end and never edited or removed, and a new block is added only after all the nodes in the network have authenticated the transaction. Security follows from the arrangement itself — since every member keeps a copy, no single member can alter the data.
The best-known application is digital currency, but the same properties are useful wherever transparency, accountability and efficiency matter — in healthcare records, land registration, voting, and sectors such as banking, media, telecom, travel and hospitality.
Every benefit is bought with duplication. The same record is stored and verified on every node, which costs storage, computation and energy, and a wrong entry can be corrected only by a further entry. Where one trusted organisation can perfectly well keep the record, an ordinary database remains the better engineering.
3.9 Key Terms
AI — artificial intelligence. See Artificial intelligence.
AR — augmented reality. See Augmented reality.
Artificial intelligence (AI) — the branch of computer science concerned with building machines that simulate intelligent human behaviour, such as learning, recognising, reasoning and decision making.
Augmented reality (AR) — the superimposition of computer-generated information over the user’s real physical surroundings, which remain visible.
Big data — data sets of such enormous volume and complexity that traditional data processing tools cannot capture, store, process and analyse them.
Block — a secured chunk of data holding a valid transaction, whose header is visible to every node while its private data is accessible to its owner alone.
Blockchain — a system in which a group of connected computers maintains one shared, updated and secure append-only ledger, of which every node holds a full copy.
Cloud computing — the delivery of computing services such as software, servers, databases and storage over the Internet, accessible from anywhere and charged according to use.
Cloud service provider — an organisation that supplies computing services over the cloud, usually on a pay-per-use basis.
CPU — central processing unit.
CPU or processor grid — a grid in which processing is moved from one machine to another as needed, or a large task is divided into subtasks distributed to various nodes for parallel processing.
Data analytics — the process of examining data sets, with the aid of specialised systems and software, in order to draw conclusions about the information they contain.
Data grid — a grid used to manage large and distributed data requiring multi-user access.
Digital economy — the part of economic activity that runs on digital technologies, such as online payments, online marketplaces and data-driven decision making.
Emerging trend — a state-of-the-art technology that is gaining popularity among users and setting a new pattern of use, and whose full impact is still unfolding.
GB — gigabyte, \(10^{9}\) bytes.
Grid — a computer network of geographically dispersed and heterogeneous computational resources that work together on a common task.
Humanoid — a robot built to resemble the human body in form and movement.
IaaS — infrastructure as a service; the cloud model in which the provider supplies servers, virtual machines, storage and network components, leaving the software to the user.
Immersive experience — a computer-generated experience that engages the senses so that the user feels present within the scene rather than merely watching it.
Internet of Things (IoT) — a network of physical devices carrying embedded hardware and software that lets them connect to a network and exchange data with other devices on it.
IoT — Internet of Things. See Internet of Things.
KB — kilobyte, \(10^{3}\) bytes.
Knowledge base — a store of facts, assumptions and rules that an AI system uses to arrive at decisions.
Ledger — a running record of transactions kept in order, in which entries accumulate rather than replace one another.
Machine learning — the subsystem of artificial intelligence in which a computer learns patterns from data using statistical techniques instead of being explicitly programmed for the task.
Machine translation — the conversion of text from one language into another by a computer.
MB — megabyte, \(10^{6}\) bytes.
Microcontroller — a complete tiny computer on a single chip, with processor, memory and input–output connections built in, designed to sit inside a device and control it.
Middleware — the layer of software that makes many separate machines work as one, allotting subtasks, moving data, collecting results and detecting failed nodes.
Model — the program produced by machine learning, adjusted on training data until it accounts for the examples it is shown.
Natural language processing (NLP) — the area of artificial intelligence that enables computers to interpret, process and produce human languages, written or spoken.
NLP — natural language processing. See Natural language processing.
Node — a constituent computational resource of a grid, or a participating computer in a blockchain network.
On-demand service — a computing resource made available at the moment it is requested, in the quantity requested, and charged for only while in use.
PaaS — platform as a service; the cloud model in which the provider supplies a ready environment to develop, test and run applications.
PB — petabyte, \(10^{15}\) bytes.
Robot — a programmable machine that carries out one or more tasks automatically with accuracy and precision, following instructions given through computer programs.
Robotics — the interdisciplinary branch of technology concerned with the design, fabrication, operation and application of robots.
SaaS — software as a service; the cloud model in which the provider supplies finished application software, usually by licence or subscription.
Sensor — a device that measures a physical quantity in the surroundings and reports it as a signal the machine can use.
Smart city — a city that uses computing, communication technology and connected devices to monitor its conditions and manage and distribute its resources efficiently.
Smart sensor — a sensor that uses built-in computing resources to perform predefined functions upon detecting a specific input, processing the data before passing it on.
SMS — short message service.
TB — terabyte, \(10^{12}\) bytes.
Testing data — the portion of the data kept aside and never shown during learning, used afterwards to measure how well a model performs on unseen examples.
Training data — the portion of the data a model is allowed to learn from, shown to it along with the correct answers.
Virtual machine (VM) — a complete computer created in software, with its own operating system, memory and disk, running on a shared physical machine.
Virtual reality (VR) — a three-dimensional computer-generated environment that replaces the user’s perception of the real surroundings and can be explored and interacted with.
VM — virtual machine. See Virtual machine.
VR — virtual reality. See Virtual reality.
Web of Things (WoT) — the use of web services to connect anything in the physical world, giving devices of different makes one common way of being reached, built on top of IoT.
WoT — Web of Things. See Web of Things.
3.10 Points to Ponder
A machine learning model works out its own rule from data, and that rule can be difficult to explain even for the people who built the system. Suppose such a model is used to decide which students need extra coaching. What would have to be shown about the model before you would be willing to act on its answer, and would high accuracy on testing data by itself be enough?
Veracity says that data can be noisy, biased or incomplete, and that analysis cannot repair it. Two teams study the same question using data collected in two entirely different ways, and reach the same conclusion. Does that agreement make the conclusion more trustworthy, or could both data sets be wrong in the same direction — and how would you tell the two cases apart?
Big data is defined by what ordinary tools cannot handle rather than by any fixed number of bytes. That means a data set can stop being big data without changing at all, simply because tools improved. Is a definition that shifts under our feet a weakness in the idea, or is it the only honest way to define it?
A smart sensor decides locally which readings are worth sending on, and discards the rest. This saves power and network traffic, but the discarded readings are gone for good. How would you decide what a sensor is allowed to throw away, given that the question you want to ask of the data may only occur to you a year later?
Grid computing rests on the observation that most computers are idle most of the time, and that idle capacity is free for the asking. Yet the great majority of machines never join any grid. What has to be true of a task, of a network, and of the trust between the parties before pooling idle machines is actually worth doing?
A blockchain ledger is append only, so nothing recorded in it can ever be removed — a mistake can only be corrected by a further entry, with the mistake still visible. Consider a record of a person’s transactions, or of a student’s conduct, kept this way for forty years. Is a record that cannot forget always better than one that can?
3.11 Objective Questions
Which characteristic of big data refers to the trustworthiness of the data? [1 mark]
- Volume
- Velocity
- Veracity
- Value
In which cloud service model does the provider supply a ready environment in which an application can be developed, tested and run, without the user having to set up the underlying infrastructure? [1 mark]
- Infrastructure as a Service
- Platform as a Service
- Software as a Service
- Web of Things
The constituent computational resources of a grid are called: [1 mark]
- blocks
- models
- nodes
- sensors
Fill in the blank: The portion of the collected data that is kept aside and never shown to a model during learning is called ______________ . [1 mark]
State whether true or false: In augmented reality, the user’s real surroundings are hidden from view and replaced by a computer-generated environment. [1 mark]
Assertion (A): No single participant of a blockchain network can alter a record that has been entered in the ledger. Reason (R): Every participating node in the network holds a full copy of the ledger. [1 mark]
- Both A and R are true, and R is the correct explanation of A.
- Both A and R are true, but R is not the correct explanation of A.
- A is true but R is false.
- A is false but R is true.
Assertion (A): Any data set larger than one terabyte is classified as big data. Reason (R): Volume is the most prominent characteristic of big data. [1 mark]
- Both A and R are true, and R is the correct explanation of A.
- Both A and R are true, but R is not the correct explanation of A.
- A is true but R is false.
- A is false but R is true.
Match each sensor in Column A with what it measures in Column B. [1 mark]
| Column A | Column B |
|---|---|
| a. Accelerometer | i. Brightness of the surroundings |
| b. Humidity sensor | ii. Nearness of an object |
| c. Proximity sensor | iii. Orientation with respect to gravity |
| d. Light sensor | iv. Moisture in the air or soil |
- Match each term in Column A with its description in Column B. [1 mark]
| Column A | Column B |
|---|---|
| a. Middleware | i. A store of facts, assumptions and rules used for decision making |
| b. Humanoid | ii. Software that makes many separate machines work as one |
| c. Knowledge base | iii. A complete computer created in software on a shared physical machine |
| d. Virtual machine | iv. A robot built to resemble the human body in form and movement |
- Write the full form of each of the following: IoT, NLP, IaaS, VR. [1 mark]
3.12 Check Your Concepts
Define machine learning. Name the two parts into which the collected data is divided before learning begins. [2 marks]
What is a smart sensor? State one advantage of a sensor processing its readings before passing them on. [2 marks]
Write the full form of WoT, and state in one sentence what it adds to the Internet of Things. [2 marks]
Differentiate between virtual reality and augmented reality, giving one example of each. [3 marks]
Explain any three of the five characteristics of big data, giving one example for each. [3 marks]
What is an on-demand service? Give reasons why on-demand resources make it easier for a newly formed organisation to begin work. [3 marks]
Explain the three stages of the cycle by which a robot operates. Give reasons why a robot that works reliably on a factory floor may perform poorly in a crowded street. [4 marks]
Differentiate between cloud computing and grid computing on any four points, and give one situation in which each would be the better choice. [4 marks]
Explain the three standard cloud service models, stating clearly in each case what the provider manages and what is left to the user. A school wants to run an attendance program written by its own students, without buying a server or configuring one. Justify which model you would advise, with reasons. [5 marks]
Explain how a blockchain keeps a record secure without any central authority. Your answer should describe what a block holds, what is meant by an append-only ledger, and when a new block is added to the chain. State one cost that this design carries. [5 marks]
3.13 Output & Debugging
Classify each of the following as structured, semi-structured or unstructured data: (i) a table of bus routes with fare and distance, (ii) a voice note recorded on a phone, (iii) a web page with tagged headings and fields, (iv) a photograph taken at a school function. [2 marks]
A diagram shows a central rectangle labelled “Grid Resource Management System”. Above and below it, two dashed boundaries each enclose four machines of different kinds — a database server, a desktop, a tablet, a laptop, a printer, a phone, a second laptop and a storage rack — every machine joined to the central rectangle by a two-headed arrow. Both boundaries are labelled “users sharing their resources”. [3 marks]
- Name the arrangement shown.
- What is meant by saying that the resources in it are heterogeneous? Support your answer from the diagram.
- If a single large calculation is divided into subtasks and given to these machines, which of the two types of grid is being used?
Copy the table below into your answer book and complete the four empty cells. [3 marks]
Table 3.11 – a partly filled comparison of a centralised database with a blockchain
| Feature | Centralised database | Blockchain |
|---|---|---|
| Where the data is kept | In one place, owned by one organisation | ____________ |
| Editing an existing record | ____________ | Not possible; records are only added |
| Effect of one machine failing | ____________ | No effect; every other node still holds the record |
| Basis of trust | Trust in the organisation that keeps it | ____________ |
Name the sensor that makes each of the following possible: (i) the display turns sideways when the phone is rotated, (ii) a street light switches itself on at dusk, (iii) the screen goes blank when the phone is held against the ear. [2 marks]
A student has written the five statements below. Three of them are wrong. Identify the three and rewrite each correctly. [3 marks]
- Testing data is the portion of the data that a model adjusts itself on during learning.
- In Software as a Service, the user is not concerned with installing or configuring the software.
- A grid is useful for a calculation in which every step needs the result of the step before it.
- Machine learning is a subsystem of artificial intelligence.
- The Web of Things replaces the Internet of Things, so devices no longer need a network connection.
3.14 Case-Based Questions
- A city bus depot runs sixty buses. The depot fits each bus with a device that records its position every ten seconds, along with the fuel level and the engine temperature, and sends the readings over a wireless connection to a computer at the depot. Within a month, the depot finds that its ordinary spreadsheet can no longer open the collected file. [5 marks]
- Name the technology that has been used to connect the buses to the depot’s computer, and state the three things that had to be added to each bus to make this possible. [2 marks]
- Which characteristic of big data is most responsible for the spreadsheet failing here? Give reasons for your answer. [1 mark]
- The depot manager suggests that each device should send a reading only when the fuel level falls below a set mark or the engine temperature crosses a limit. Name the kind of sensor this would require, and state two advantages of this arrangement. [2 marks]
- A school science club has ten years of daily rainfall readings taken at four stations and wants to analyse them. The analysis divides neatly into four independent parts, one for each station. The club has no money for equipment, but the school laboratory has forty computers that are switched on and unused after four in the afternoon. A teacher suggests instead renting processing capacity online and paying for the hours used. [5 marks]
- Name the technology behind each of the two suggestions, and state the essential difference between them. [2 marks]
- Which of the two types of grid would the laboratory arrangement be, and why? [1 mark]
- The club then decides to analyse a different problem in which each day’s calculation needs the result of the previous day. Explain what happens to the advantage of using forty machines, with reasons. [2 marks]
- Twenty farmers of a village cooperative deliver produce to a shared warehouse. Each delivery is written in a single register kept in the warehouse office. Twice this year, a farmer has disputed an entry, and there is no second record against which the register can be checked. [5 marks]
- Name the technology that would let all twenty farmers and the warehouse keep the same record, and state what each participant would hold. [1 mark]
- Explain what is meant by an append-only ledger, and how a wrong entry would be dealt with under it. [2 marks]
- The cooperative wants this record available to every farmer through a browser, without any of them installing or maintaining software. Name the cloud service model that suits this, with reasons. [2 marks]