Chapter 11: Organisms and Populations
In the autumn of 1838, a young naturalist named Charles Darwin was reading, almost for amusement, an essay on human population written decades earlier by an English clergyman, Thomas Malthus. Malthus had made a simple but unsettling point: living things tend to multiply far faster than their food supply can grow. A population, left unchecked, does not add members one by one — it doubles, and doubles again, racing upward. Yet the world around Darwin was clearly not drowning in any single kind of creature. Every species produces far more young than can possibly survive, and something, somewhere, is constantly cutting their numbers back.
That contradiction struck Darwin like a key turning in a lock. If far more individuals are born than the environment can support, then those individuals must struggle, and only some will survive to reproduce. Here, he realised, was the very engine of natural selection — and it operated not on a lone organism, but on a whole population.
This chapter follows that same trail of thought. It asks what a population really is, how we measure and describe it, why its numbers rise and fall, and how the populations of different species push against, feed upon, cheat, and even rescue one another as they share a crowded world.
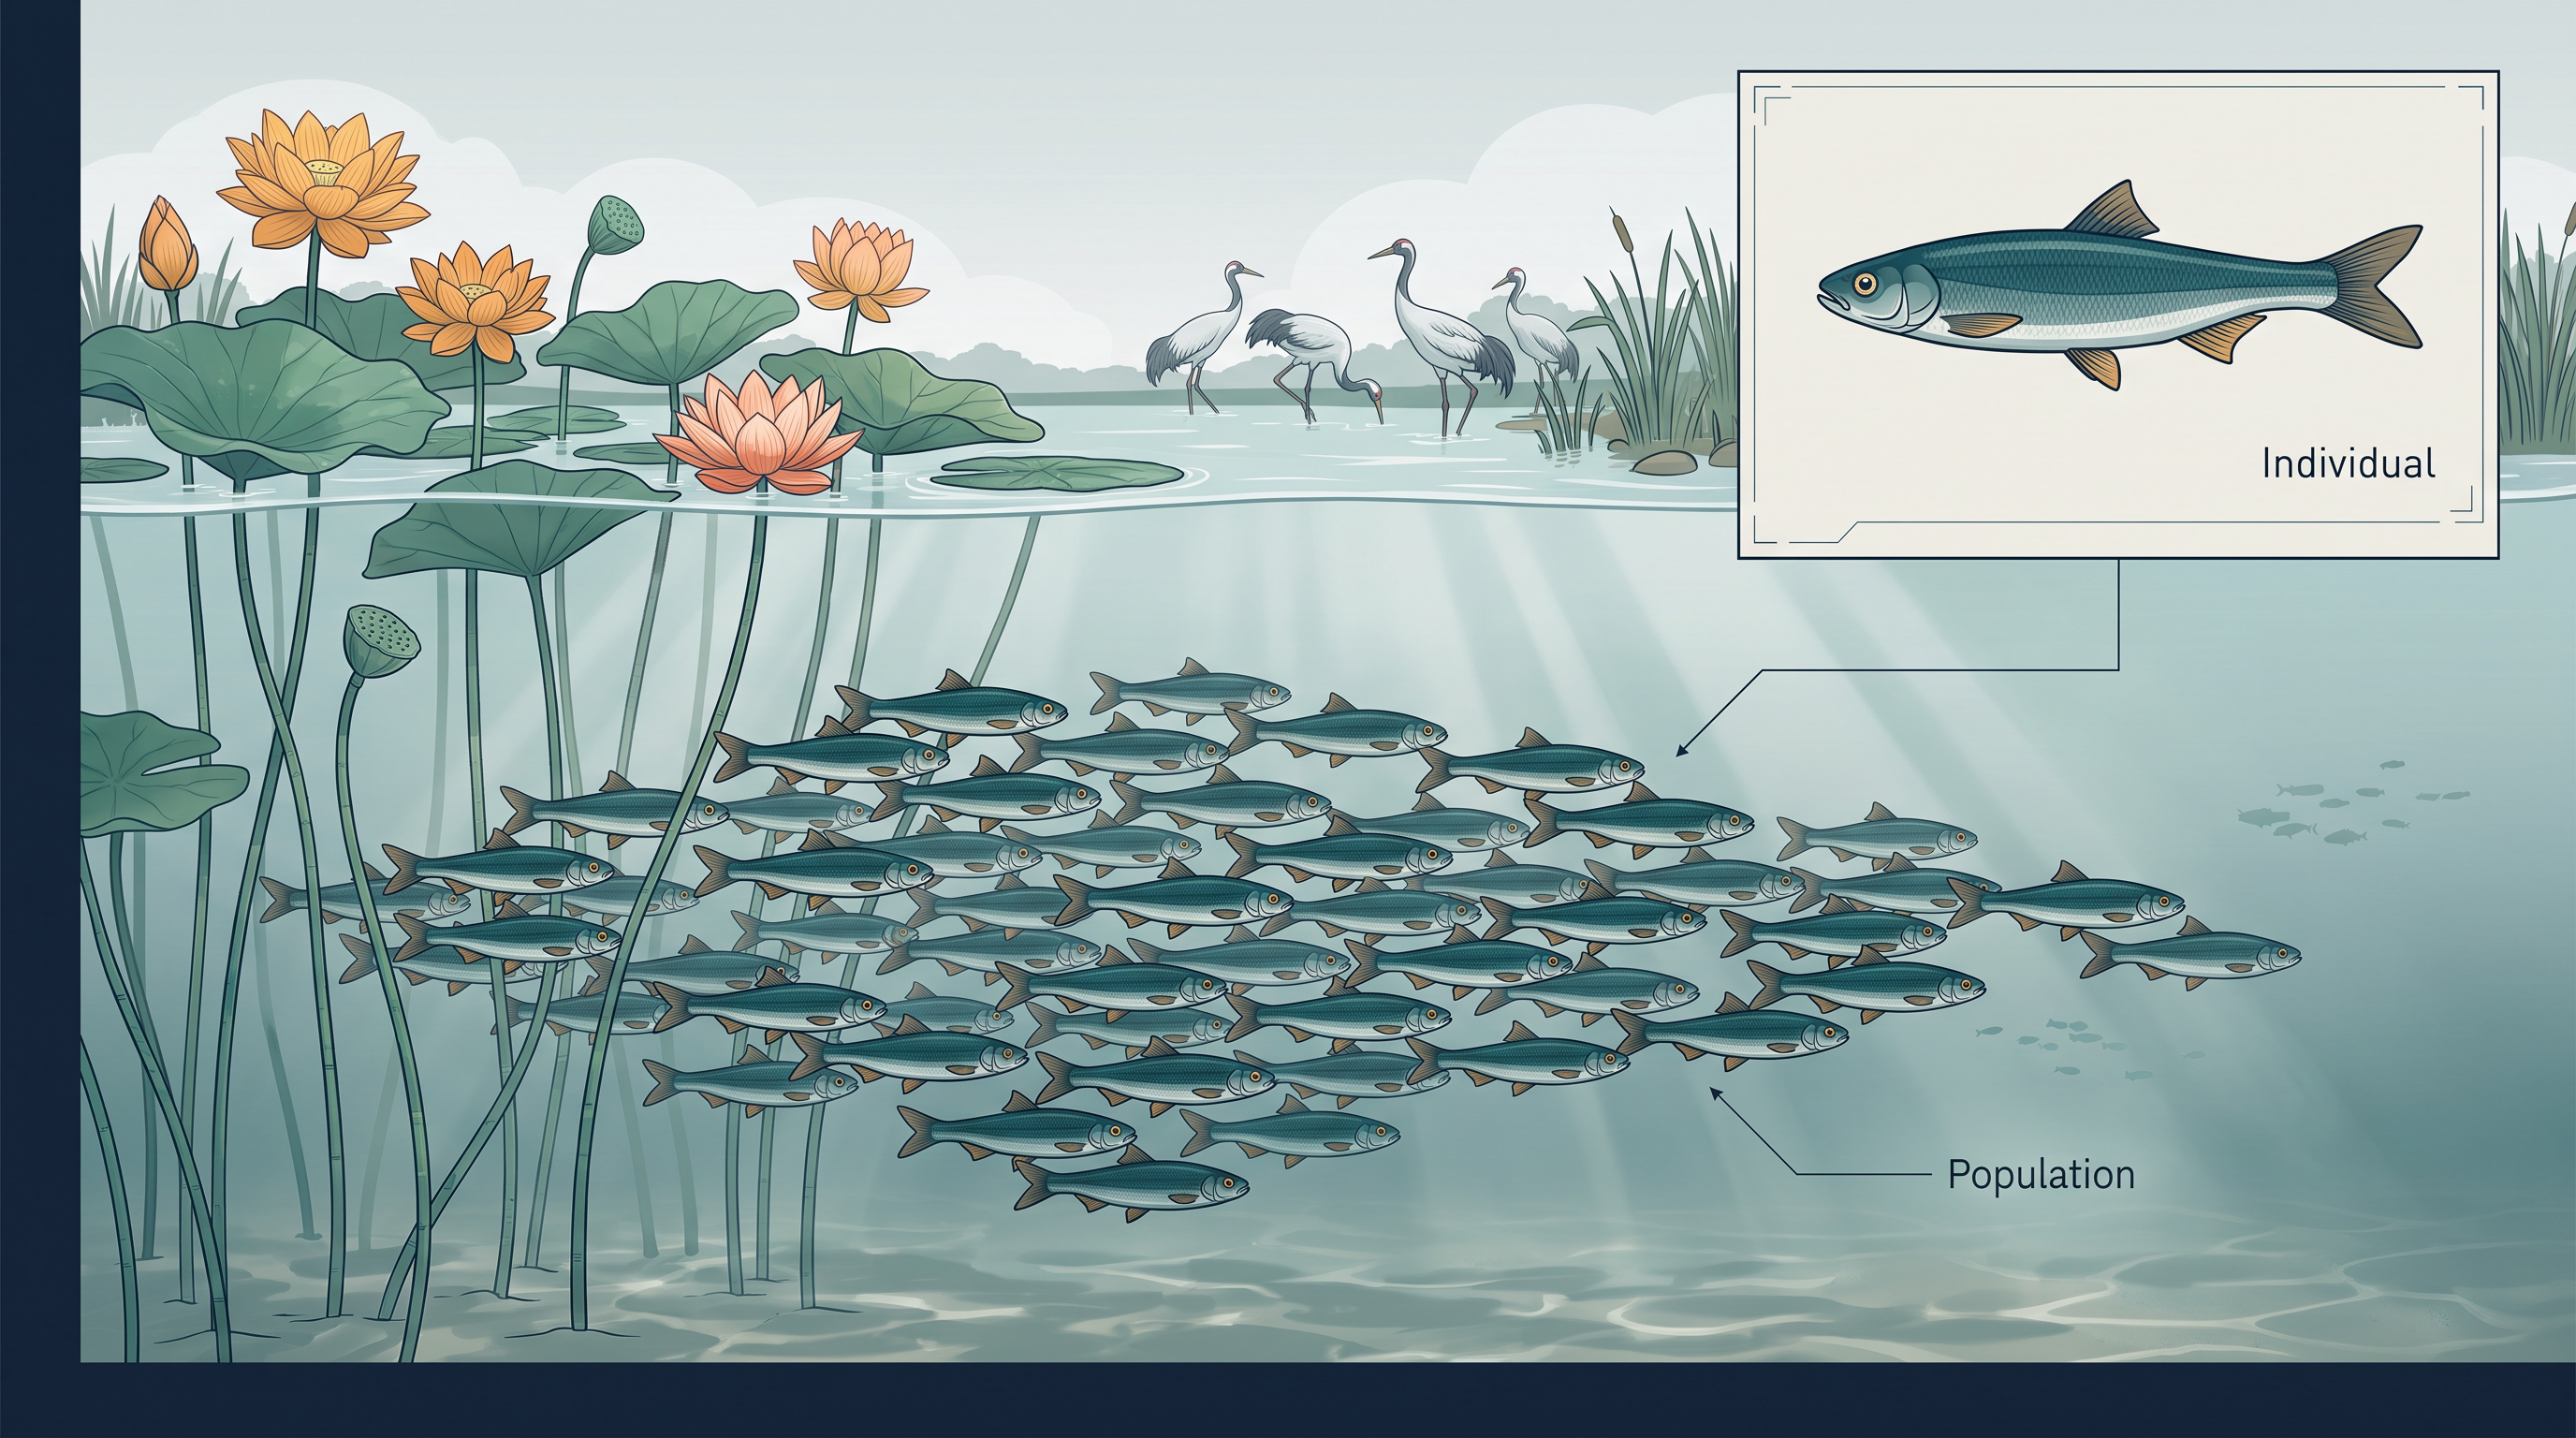
Fig. 11.0 – A pond scene contrasting an individual with a population.
By the end of this chapter, you will be able to answer each of these questions for yourself.
11.1 Populations
You have already learnt in earlier classes that ecology is the branch of biology that studies the interactions among organisms, and between organisms and their physical, non-living (abiotic) surroundings. It is the science of how living things fit into, and depend upon, the world around them.
Ecology is usually studied at four levels of biological organisation — the organism, the population, the community, and the biome. Each level is built from the one below it, so understanding a population first requires being clear about what sits just below and just above it on this ladder.
In this chapter we focus on ecology at the population level — how a group of organisms of the same kind behaves as a unit that has properties no single individual can have on its own.
11.1.1 Population Attributes
In nature we rarely find a single, isolated individual of any species living entirely on its own. Most organisms live in groups within a well-defined geographical area, where they share or compete for the same resources and can potentially interbreed. Such a group constitutes a population.
The word interbreeding suggests sexual reproduction, but in ecology we are not so strict. A group of individuals produced even by asexual reproduction is also treated as a population for the purpose of study. What matters is that they are the same species, living together in one area, drawing on the same resources.
Examples of populations are all around us: all the cormorants in a wetland, all the rats in an abandoned house, all the teakwood trees in a stretch of forest, all the bacteria growing in a single culture plate, and all the lotus plants in one pond. Each is a population — one species, one place, one interacting group.
You have learnt in earlier chapters that although it is the individual organism that must actually cope with a changed environment, it is at the population level that natural selection acts to shape the desired traits over generations. This is exactly why population ecology matters so much: it is the link that ties ecology to population genetics and to evolution itself.
Attributes an individual cannot have
Here is the central idea of this whole section: a population has certain attributes that an individual organism simply cannot have. An individual is born and an individual dies — but only a population can have a birth rate and a death rate.
In a population, birth and death rates are per capita rates — that is, they are expressed per individual of the population, as a change in numbers (an increase or a decrease) measured against the members present.
An example makes this clear. Suppose a pond held 20 lotus plants last year, and through reproduction 8 new plants were added, bringing the total to 28. The birth rate is then
\[\\text{birth rate} = \\frac{8}{20} = 0.4 \\text{ offspring per lotus per year}\]
Now suppose that in a laboratory population of 40 fruitflies, 4 individuals died during a specified period — say, one week. The death rate for that period is
\[\\text{death rate} = \\frac{4}{40} = 0.1 \\text{ individuals per fruitfly per week}\]
Notice how the same number of deaths would mean something very different in a population of 40 than in a population of 4,000. That is precisely why we use a rate per individual rather than a raw count.
Sex ratio and age distribution
Another attribute that belongs to a population and not to an individual is the sex ratio. Any single organism is simply male or female, but a population can be described by its sex ratio — for example, 60 per cent females and 40 per cent males.
At any moment, a population is also made up of individuals of many different ages. If we plot the age distribution — the percentage of individuals in each age group — we get a structure called an age pyramid, as shown in Fig. 11.1. For human populations, age pyramids usually show the age distribution of males and females side by side.
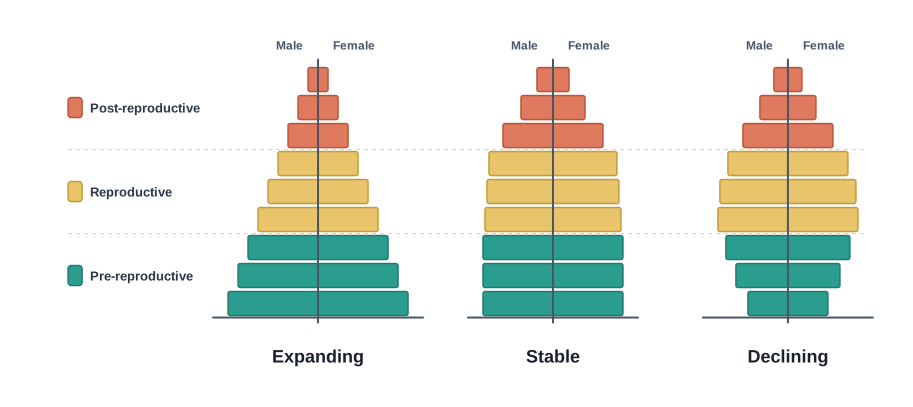
Fig. 11.1 – Age pyramids for expanding, stable and declining populations.
The shape of an age pyramid tells us the growth status of the population — whether it is (a) growing (expanding), (b) stable, or (c) declining.
How big is a population? Population density
The size of a population tells us a great deal about its status in a habitat. Whatever ecological process we wish to study — the effect of competition with another species, the impact of a predator, or the result of spraying a pesticide — we always measure that effect as a change in population size.
Population sizes in nature range enormously. In some years, fewer than 10 Siberian cranes may visit the Bharatpur wetlands, while a pond may hold millions of Chlamydomonas, a microscopic alga. This population size, measured technically, is called population density, and it is designated by the symbol N.
Population density need not always be measured as a simple headcount. Although the total number is usually the most appropriate measure, in some situations counting numbers is either meaningless or extremely difficult, and we then use a different measure.
Consider an area holding 200 carrot grass plants (Parthenium hysterophorus) and a single, huge banyan tree with a vast canopy. To say the banyan’s density is “low” compared with the carrot grass would badly underestimate the enormous ecological role the banyan plays in that community. In such a case, per cent cover or biomass is a far more meaningful measure of population size than a bare count.
Total number also becomes impractical when a population is so huge that counting is impossible or hugely time-consuming.
Sometimes we do not even need the absolute density; a relative density serves the purpose equally well. For instance, the number of fish caught per trap is a good enough measure of a lake’s fish density for comparison, without ever counting every fish in the lake.
In fact, for most large or elusive animals we are obliged to estimate population size indirectly, without actually seeing or counting the animals at all. The tiger census in our national parks and tiger reserves, for example, is often based on pug marks (footprints) and faecal pellets left behind.
11.1.2 Population Growth
The size of a population is never a fixed, static number. It keeps changing with time, depending on factors such as food availability, predation pressure and adverse weather. In fact, it is exactly these changes in population density that tell us whether a population is flourishing or declining.
Whatever the ultimate causes, the density of a population in a given habitat over a given period rises and falls because of four basic processes. Two of them (natality and immigration) increase density, and two (mortality and emigration) decrease it.
- Natality refers to the number of births during a given period that are added to the initial population.
- Mortality is the number of deaths in the population during a given period.
- Immigration is the number of individuals of the same species that have come into the habitat from elsewhere during the period being studied.
- Emigration is the number of individuals of the population that have left the habitat and gone elsewhere during that period.
The way these four push and pull on population density is summarised in Fig. 11.2.
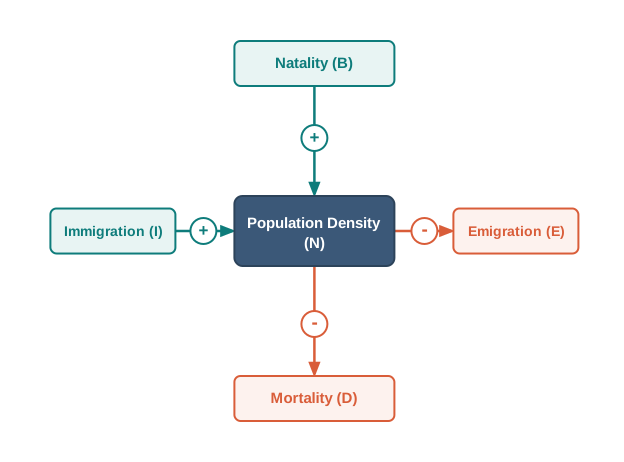
Fig. 11.2 – The four basic factors influencing population density.
If N is the population density at time t, then its density at the next time step, t + 1, is given by:
\[N\_{t+1} = N\_t + \\left\[(B + I) - (D + E)\\right]\]
Here B is natality (births), I is immigration, D is mortality (deaths) and E is emigration, all counted over the period from t to t + 1.
Flowchart
FC 11.1 – What changes population density: Natality (B, +) → adds; Immigration (I, +) → adds; these raise N. Mortality (D, −) → removes; Emigration (E, −) → removes; these lower N. Net change = (B + I) − (D + E).
Reading this equation, we can see that population density will increase whenever births plus immigrants (B + I) outnumber deaths plus emigrants (D + E). Under normal conditions, births and deaths are the most important of the four factors; immigration and emigration usually matter only under special circumstances. For example, when a brand-new habitat is just being colonised, immigration may contribute far more to growth than births do.
Growth Models
Does population growth follow any specific, predictable pattern over time? We have long worried about unchecked human population growth and the problems it creates, so it is natural to ask whether animal populations in nature grow in the same way, or whether they show some restraint. Nature may in fact have a lesson or two to teach us about controlling growth.
Exponential growth. Resources such as food and space are obviously essential for a population to grow without hindrance. Ideally, when resources in a habitat are unlimited, each species can fully realise its innate potential to increase in number. Under such conditions the population grows in an exponential (geometric) fashion.
Suppose a population of size N has a per capita birth rate b (not the total number of births, but births per individual) and a per capita death rate d. Then the change in N over a unit of time is:
\[\\frac{dN}{dt} = (b - d) \\times N\]
If we let \((b - d) = r\), the equation simplifies to:
\[\\frac{dN}{dt} = rN\]
Here r is a very important parameter called the intrinsic rate of natural increase. It captures a population’s built-in capacity to grow, and it is widely used to assess how any biotic or abiotic factor affects a population.
To give a sense of the magnitude of r: for the Norway rat r is 0.015, for the flour beetle it is 0.12, and in 1981 the r value for the human population of India was 0.0205. A larger r means a faster intrinsic capacity to multiply.
If you know basic calculus, the exponential growth equation can be written in its integrated form as:
\[N\_t = N\_0,e^{rt}\]
where N\(\_t\) is the population density after time t, N\(\_0\) is the population density at time zero (the start), r is the intrinsic rate of natural increase, and e is the base of natural logarithms (2.71828).
When we plot N against time for such growth, we get a J-shaped curve (curve a in Fig. 11.3).
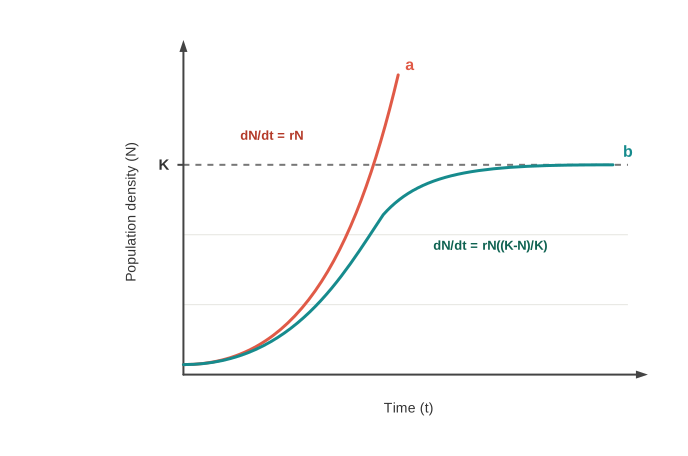
Fig. 11.3 – Exponential and logistic population growth curves.
Any species growing exponentially under unlimited resources can reach an enormous population in a surprisingly short time. Darwin pointed out that even a slow-breeding animal such as the elephant could build up to huge numbers in the absence of any checks.
Flowchart
FC 11.2 – Exponential doubling on the chessboard: Square 1 (1 grain) → Square 2 (2) → Square 3 (4) → Square 4 (8) → … doubling each square → Square 64 (an astronomically large number).
Logistic growth. In reality, no population has unlimited resources at its disposal, so unchecked exponential growth cannot continue for long. Limited resources force individuals to compete, and eventually the “fittest” individuals survive and reproduce. (The governments of many countries have recognised this same truth and introduced measures to restrain human population growth.)
Every habitat can support only a certain maximum number of individuals of a species, beyond which no further growth is possible. This upper limit set by nature is called the carrying capacity (K) for that species in that habitat.
A population growing in a habitat with limited resources shows a characteristic sequence: first a lag phase, then phases of acceleration and deceleration, and finally an asymptote, where the population density levels off at the carrying capacity K. Plotting N against time t now gives a smooth S-shaped (sigmoid) curve (curve b in Fig. 11.3). This pattern is called Verhulst–Pearl logistic growth, and it is described by the equation:
\[\\frac{dN}{dt} = rN\\left(\\frac{K - N}{K}\\right)\]
where N is the population density at time t, r is the intrinsic rate of natural increase, and K is the carrying capacity.
Flowchart
FC 11.3 – Phases of logistic growth: lag phase (slow start) → acceleration (rapid rise) → deceleration (growth slows as N nears K) → asymptote (levels off at carrying capacity K).
The term \(\\left(\\dfrac{K - N}{K}\\right)\) is the key to understanding logistic growth. When N is small, this fraction is close to 1, so growth is almost exponential. As N approaches K, the fraction shrinks toward 0, so growth slows and finally stops. When N equals K, the bracket becomes 0 and \(\\frac{dN}{dt} = 0\) — the population stops growing exactly at its carrying capacity.
Since resources for almost every animal population are finite and become limiting sooner or later, the logistic model is considered the more realistic one.
11.1.3 Life History Variation
Populations evolve so as to maximise their reproductive fitness — also called Darwinian fitness, essentially a high r value — in the particular habitat where they live. Under a given set of selection pressures, organisms evolve toward the most efficient possible reproductive strategy for those conditions.
The strategies vary widely. Some organisms breed only once in their lifetime — the Pacific salmon fish and bamboo are classic examples — while others breed many times over their lives, as most birds and mammals do. Some species produce a large number of small-sized offspring (oysters, pelagic fishes), while others produce a small number of large-sized offspring (birds, mammals).
So which strategy is “best” for maximising fitness? There is no single answer. Ecologists find that life-history traits have evolved in relation to the specific constraints imposed by the abiotic and biotic components of each organism’s habitat. What works in one environment may fail in another.
The evolution of life-history traits across different species is, even today, an active and important area of research among ecologists.
11.1.4 Population Interactions
Can you think of any natural habitat on Earth inhabited by just a single species? There is no such place — such a situation is not even conceivable. For any species, the bare minimum requirement is at least one other species to feed on.
Even a plant, which makes its own food, cannot survive entirely alone: it needs soil microbes to break down organic matter and return inorganic nutrients for absorption, and it needs an animal agent for pollination. It is clear, then, that in nature animals, plants and microbes cannot live in isolation. They interact in many ways to form a biological community, and even in the simplest communities many interactive links exist, even if not all are obvious.
Interspecific interactions arise between populations of two different species. Such an interaction may be beneficial, detrimental, or neutral (neither harmful nor helpful) to one species or to both. If we mark a beneficial effect with +, a detrimental effect with −, and a neutral effect with 0, we can lay out every possible outcome, as in Table 11.1.
Table 11.1: Population Interactions
| Species A | Species B | Name of Interaction |
|---|---|---|
| + | + | Mutualism |
| − | − | Competition |
| + | − | Predation |
| + | − | Parasitism |
| + | 0 | Commensalism |
| − | 0 | Amensalism |
In mutualism, both species benefit. In competition, both lose. In parasitism and predation, only one species benefits (the parasite or the predator, respectively), while the other — the host or the prey — is harmed. In commensalism, one species benefits while the other is neither helped nor harmed. In amensalism, one species is harmed while the other is unaffected.
Three of these interactions — predation, parasitism and commensalism — share a common feature: the interacting species live closely together.
(i) Predation
What would happen to all the energy that plants (autotrophs) fix, if there were no animals to eat those plants? Think of predation as nature’s way of transferring the energy fixed by plants up to higher trophic (feeding) levels.
When we picture predator and prey, the tiger and the deer usually come to mind — but a sparrow eating a seed is no less a predator. Even though plant-eating animals are placed in a separate category called herbivores, in a broad ecological sense they are not very different from predators, because they too consume other living organisms.
Besides serving as “conduits” for energy transfer across trophic levels, predators play several other vital roles.
First, predators keep prey populations under control. Without predators, a prey species could reach very high densities and destabilise the ecosystem. This is exactly why exotic species, when introduced into a new region without their natural predators, often turn invasive and spread out of control.
Second, predators help maintain species diversity in a community by lowering the intensity of competition among prey species.
If a predator becomes too efficient and overexploits its prey, the prey may be wiped out — and the predator will then starve and vanish too. This is why predators in nature tend to be “prudent,” not exterminating their prey. Meanwhile, prey species have evolved many defences to reduce the impact of predation.
Some insects and frogs are cryptically coloured (camouflaged) so predators cannot spot them easily. Others are poisonous and are therefore avoided.
For plants, the herbivores are the predators. Nearly 25 per cent of all insects are phytophagous — feeding on plant sap and other plant parts. The problem is especially severe for plants because, unlike animals, they cannot run away. Plants have therefore evolved a startling variety of morphological and chemical defences.
Thorns, as seen in Acacia and Cactus, are the commonest morphological defence. Chemically, many plants make and store substances that sicken a herbivore, block its feeding or digestion, disrupt its reproduction, or even kill it.
(ii) Competition
When Darwin wrote of the “struggle for existence” and the “survival of the fittest,” he was convinced that interspecific competition is a powerful force in evolution.
It is commonly believed that competition happens only when closely related species fight over the same limiting resource — but this is not entirely true, for two reasons.
Firstly, totally unrelated species can compete for the same resource. In some shallow South American lakes, for instance, visiting flamingoes and resident fishes compete for the same food — the zooplankton in the lake.
Secondly, resources need not even be scarce for competition to occur. In interference competition, one species reduces another’s feeding efficiency simply by its inhibitory, interfering presence — even when food and space are abundant.
For these reasons, competition is best defined not by resource shortage but by its effect.
It is fairly easy to show competition in the laboratory. As Gause and other experimental ecologists demonstrated, when resources are limited, the competitively superior species eventually eliminates the other. But proving that such competitive exclusion actually happens in nature is harder, though strong circumstantial evidence exists.
Further evidence comes from competitive release. A species whose range is squeezed into a small area by a superior competitor is often found to expand its range dramatically once that competitor is experimentally removed.
In general, herbivores and plants appear to be more adversely affected by competition than carnivores are.
These observations were captured in a famous principle.
More recent studies caution against sweeping generalisations. They do not deny that interspecific competition occurs in nature, but they point out that species facing competition may evolve mechanisms that promote co-existence rather than exclusion.
One such mechanism is resource partitioning. If two species would compete for the same resource, they may avoid conflict by using it differently — for example, feeding at different times of day or foraging in different ways.
(iii) Parasitism
Since a parasitic life offers free lodging and free meals, it is not surprising that parasitism has evolved again and again, in taxonomic groups ranging from plants to higher vertebrates.
Many parasites are host-specific — able to parasitise only a single host species — and this tight relationship drives co-evolution: if the host evolves a way to reject or resist the parasite, the parasite must in turn evolve a counter-measure to keep succeeding on that same host.
To suit their way of life, parasites have evolved special adaptations: the loss of unnecessary sense organs, the presence of adhesive organs or suckers to cling to the host, the loss of the digestive system, and a high reproductive capacity.
The life cycles of parasites are often complex, involving one or two intermediate hosts or vectors to help them reach their primary host. The human liver fluke (a trematode) needs two intermediate hosts — a snail and a fish — to complete its cycle. The malarial parasite needs a vector, the mosquito, to spread to new hosts.
Flowchart
FC 11.4 – Life cycle of the human liver fluke: primary host (human) → parasite eggs released → first intermediate host (snail) → second intermediate host (fish) → eaten by human → back to primary host.
Most parasites harm the host: they may lower its survival, growth and reproduction, reduce its population density, and make it physically weak and so more vulnerable to predation.
Parasites are grouped by where they live on or in the host. Ectoparasites feed on the external surface of the host — lice on humans, ticks on dogs, and ectoparasitic copepods on many marine fish. The plant Cuscuta, commonly seen growing on hedge plants, is a parasite that has lost its chlorophyll and leaves during evolution and now draws all its nutrition from the host plant it clings to.
Endoparasites, in contrast, live inside the host body at various sites — the liver, kidney, lungs, red blood cells, and so on. Because of their extreme specialisation, their life cycles are even more complex, and their body form is greatly simplified while their reproductive potential is emphasised.
A fascinating special case is brood parasitism in birds, where the parasitic bird lays its eggs in the nest of its host and lets the host incubate and raise them. Through evolution, the parasitic bird’s eggs have come to closely resemble the host’s own eggs in size and colour, so the host is less likely to detect the foreign eggs and throw them out.
(iv) Commensalism
Commensalism is the interaction in which one species benefits while the other is neither harmed nor helped (+ 0).
An orchid growing as an epiphyte on a mango branch benefits (it gains a place to perch and reach light) while the mango tree is unaffected. Barnacles growing on the back of a whale gain a free ride and feeding site while the whale gains nothing and loses nothing.
A classic example is the cattle egret and grazing cattle — a sight common in farmed rural areas. The egrets forage close to the moving cattle because the cattle, as they walk, stir up and flush out insects from the vegetation that the egrets would otherwise struggle to find. The egret gains a meal; the cattle are unaffected.
Another example is the sea anemone and the clown fish. The anemone has stinging tentacles, and the clown fish lives safely among them. The fish gains protection, since predators avoid the stinging tentacles, while the anemone derives no apparent benefit from hosting the fish.
(v) Mutualism
Mutualism is the interaction that benefits both interacting species (+ +).
Lichens are an intimate mutualism between a fungus and a photosynthesising alga or cyanobacterium — the fungus provides shelter and mineral uptake, the alga provides food. Similarly, mycorrhizae are associations between fungi and the roots of higher plants: the fungi help the plant absorb essential nutrients from the soil, while the plant supplies the fungi with energy-yielding carbohydrates.
The most spectacular examples of mutualism, however, are found in plant–animal relationships. Plants need animals to pollinate their flowers and to disperse their seeds. Animals must be “paid a fee” for these services, so plants offer rewards: pollen and nectar for pollinators, and juicy, nutritious fruits for seed dispersers.
But such a mutually beneficial system must also be protected against “cheaters” — for example, animals that steal nectar without pollinating in return. This is why plant–animal interactions often involve co-evolution, in which the flower and its pollinator evolve in tight step with each other.
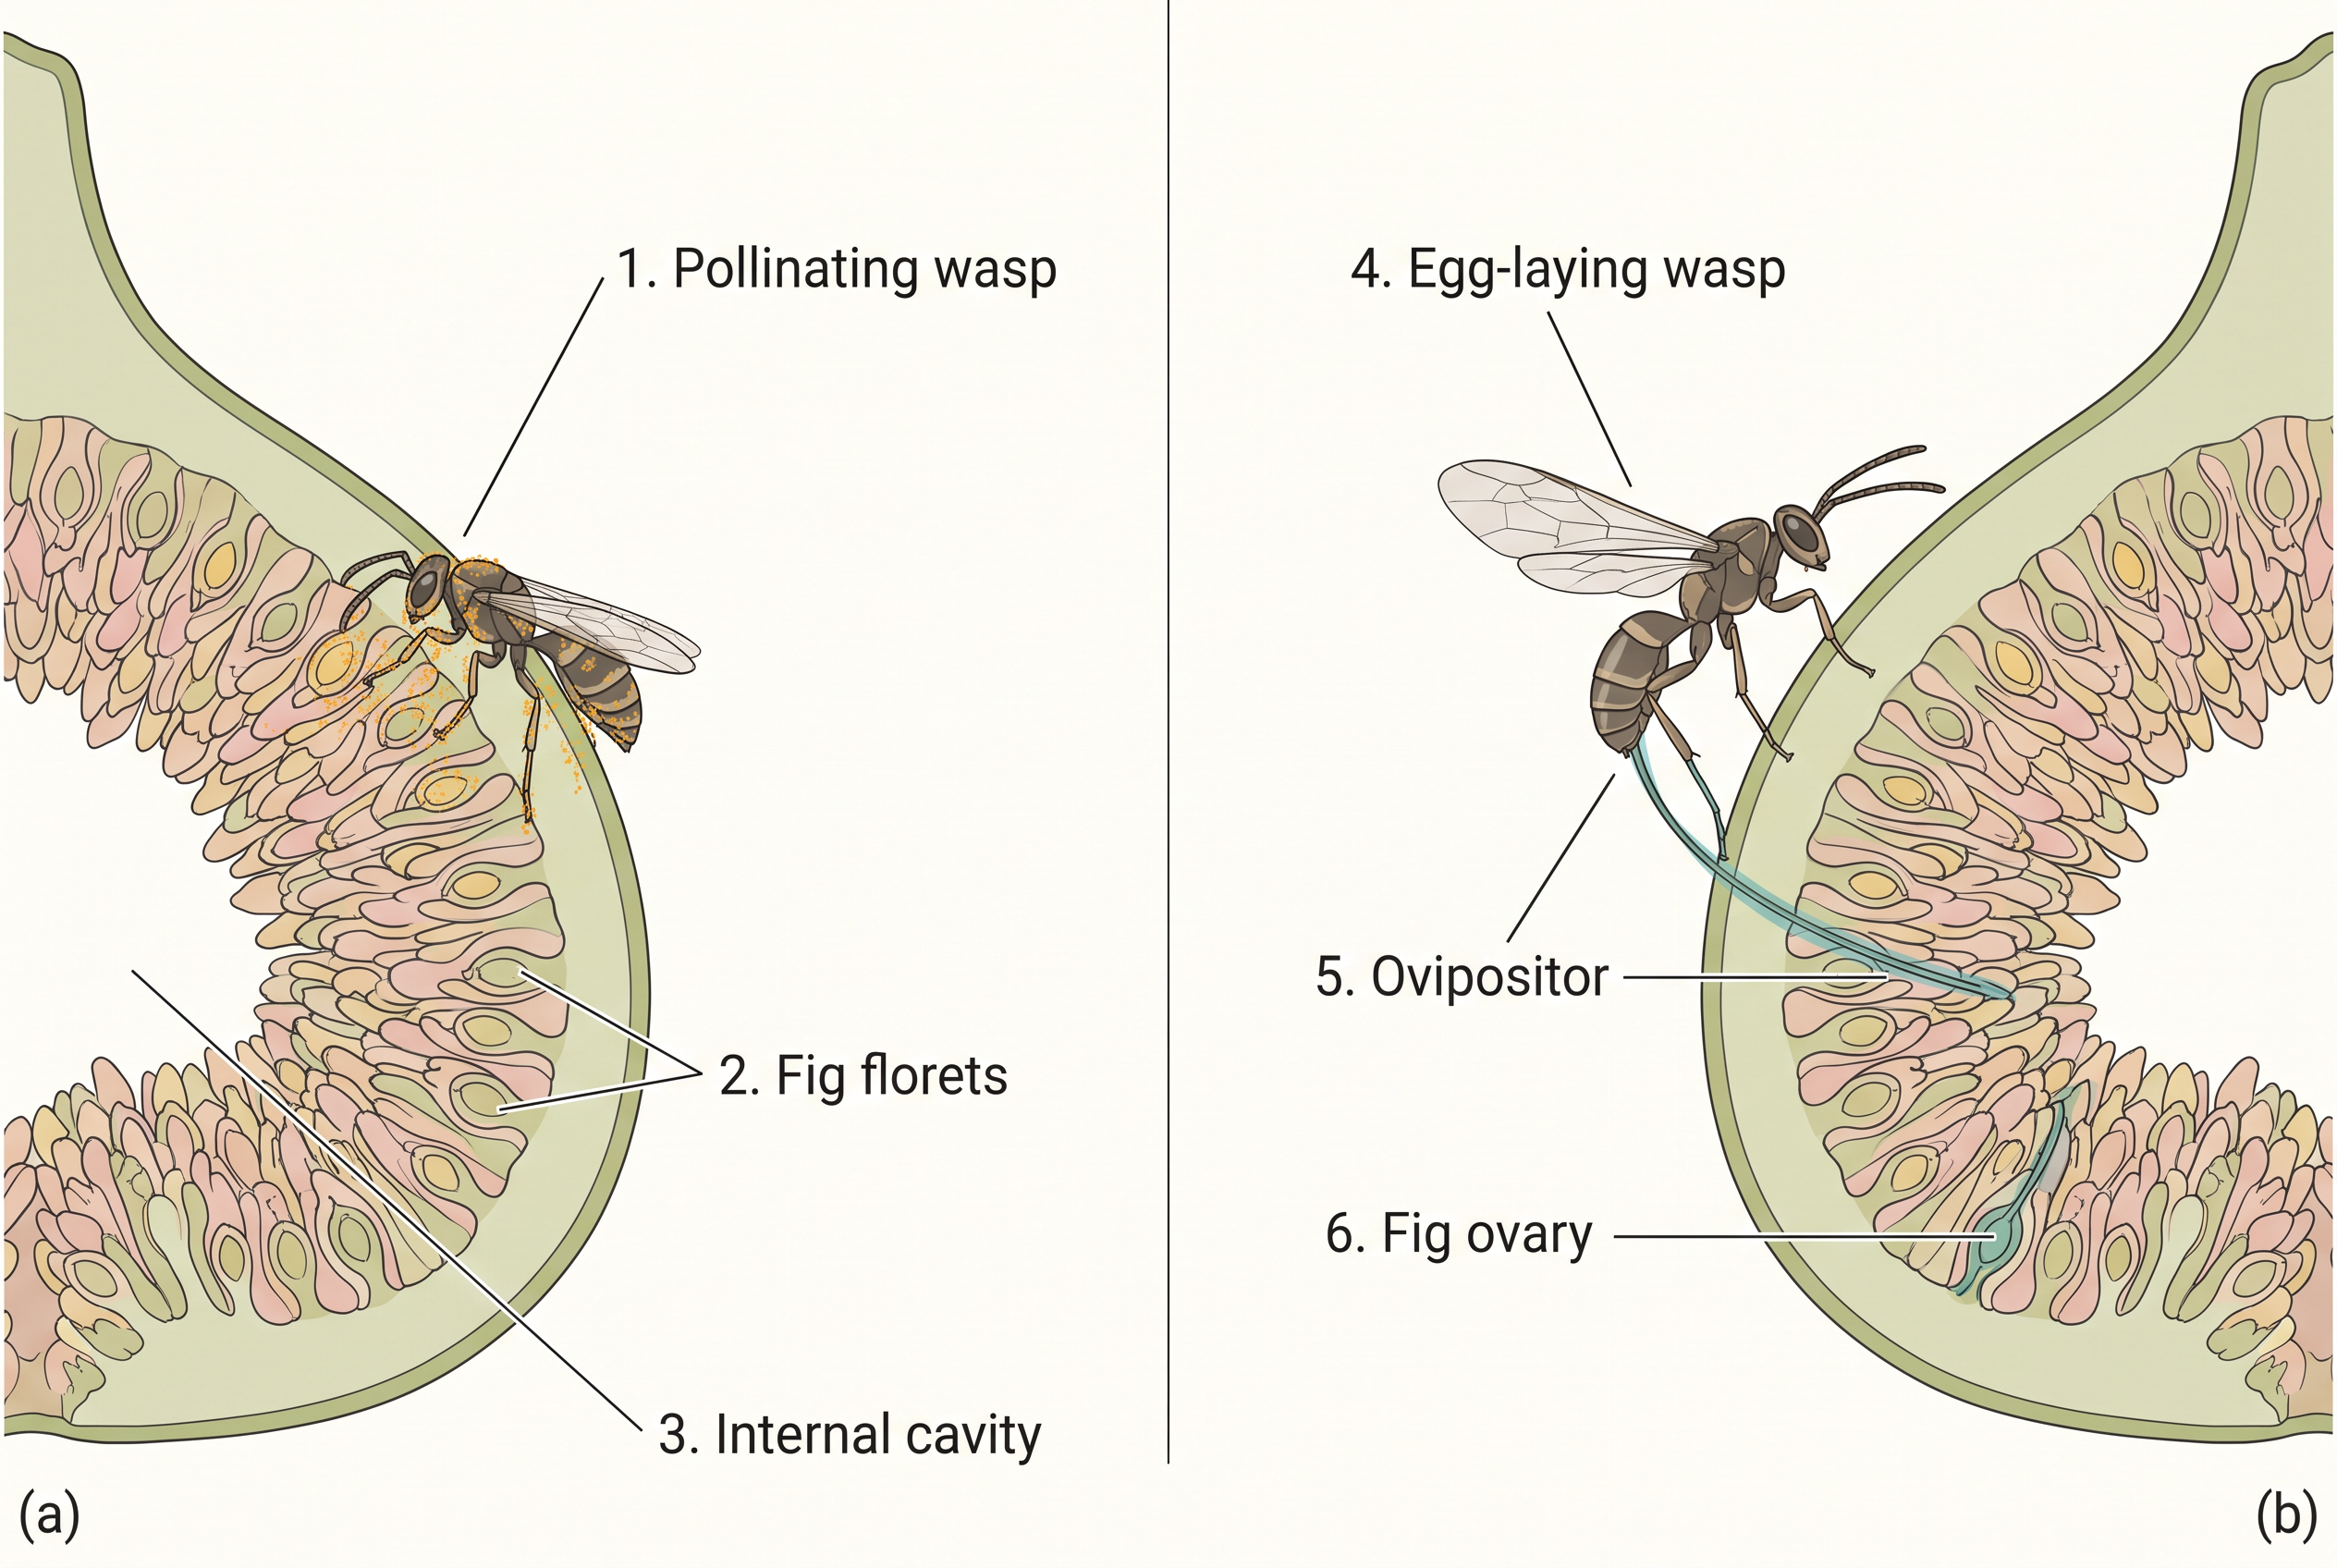
Fig. 11.4 – Fig–wasp mutualism: (a) pollination and (b) egg-laying.
Orchids show a bewildering diversity of floral shapes, many of which have evolved specifically to attract the right pollinator insect (bees and bumblebees) and guarantee pollination, as suggested in Fig. 11.5. Not all orchids, however, pay a reward.
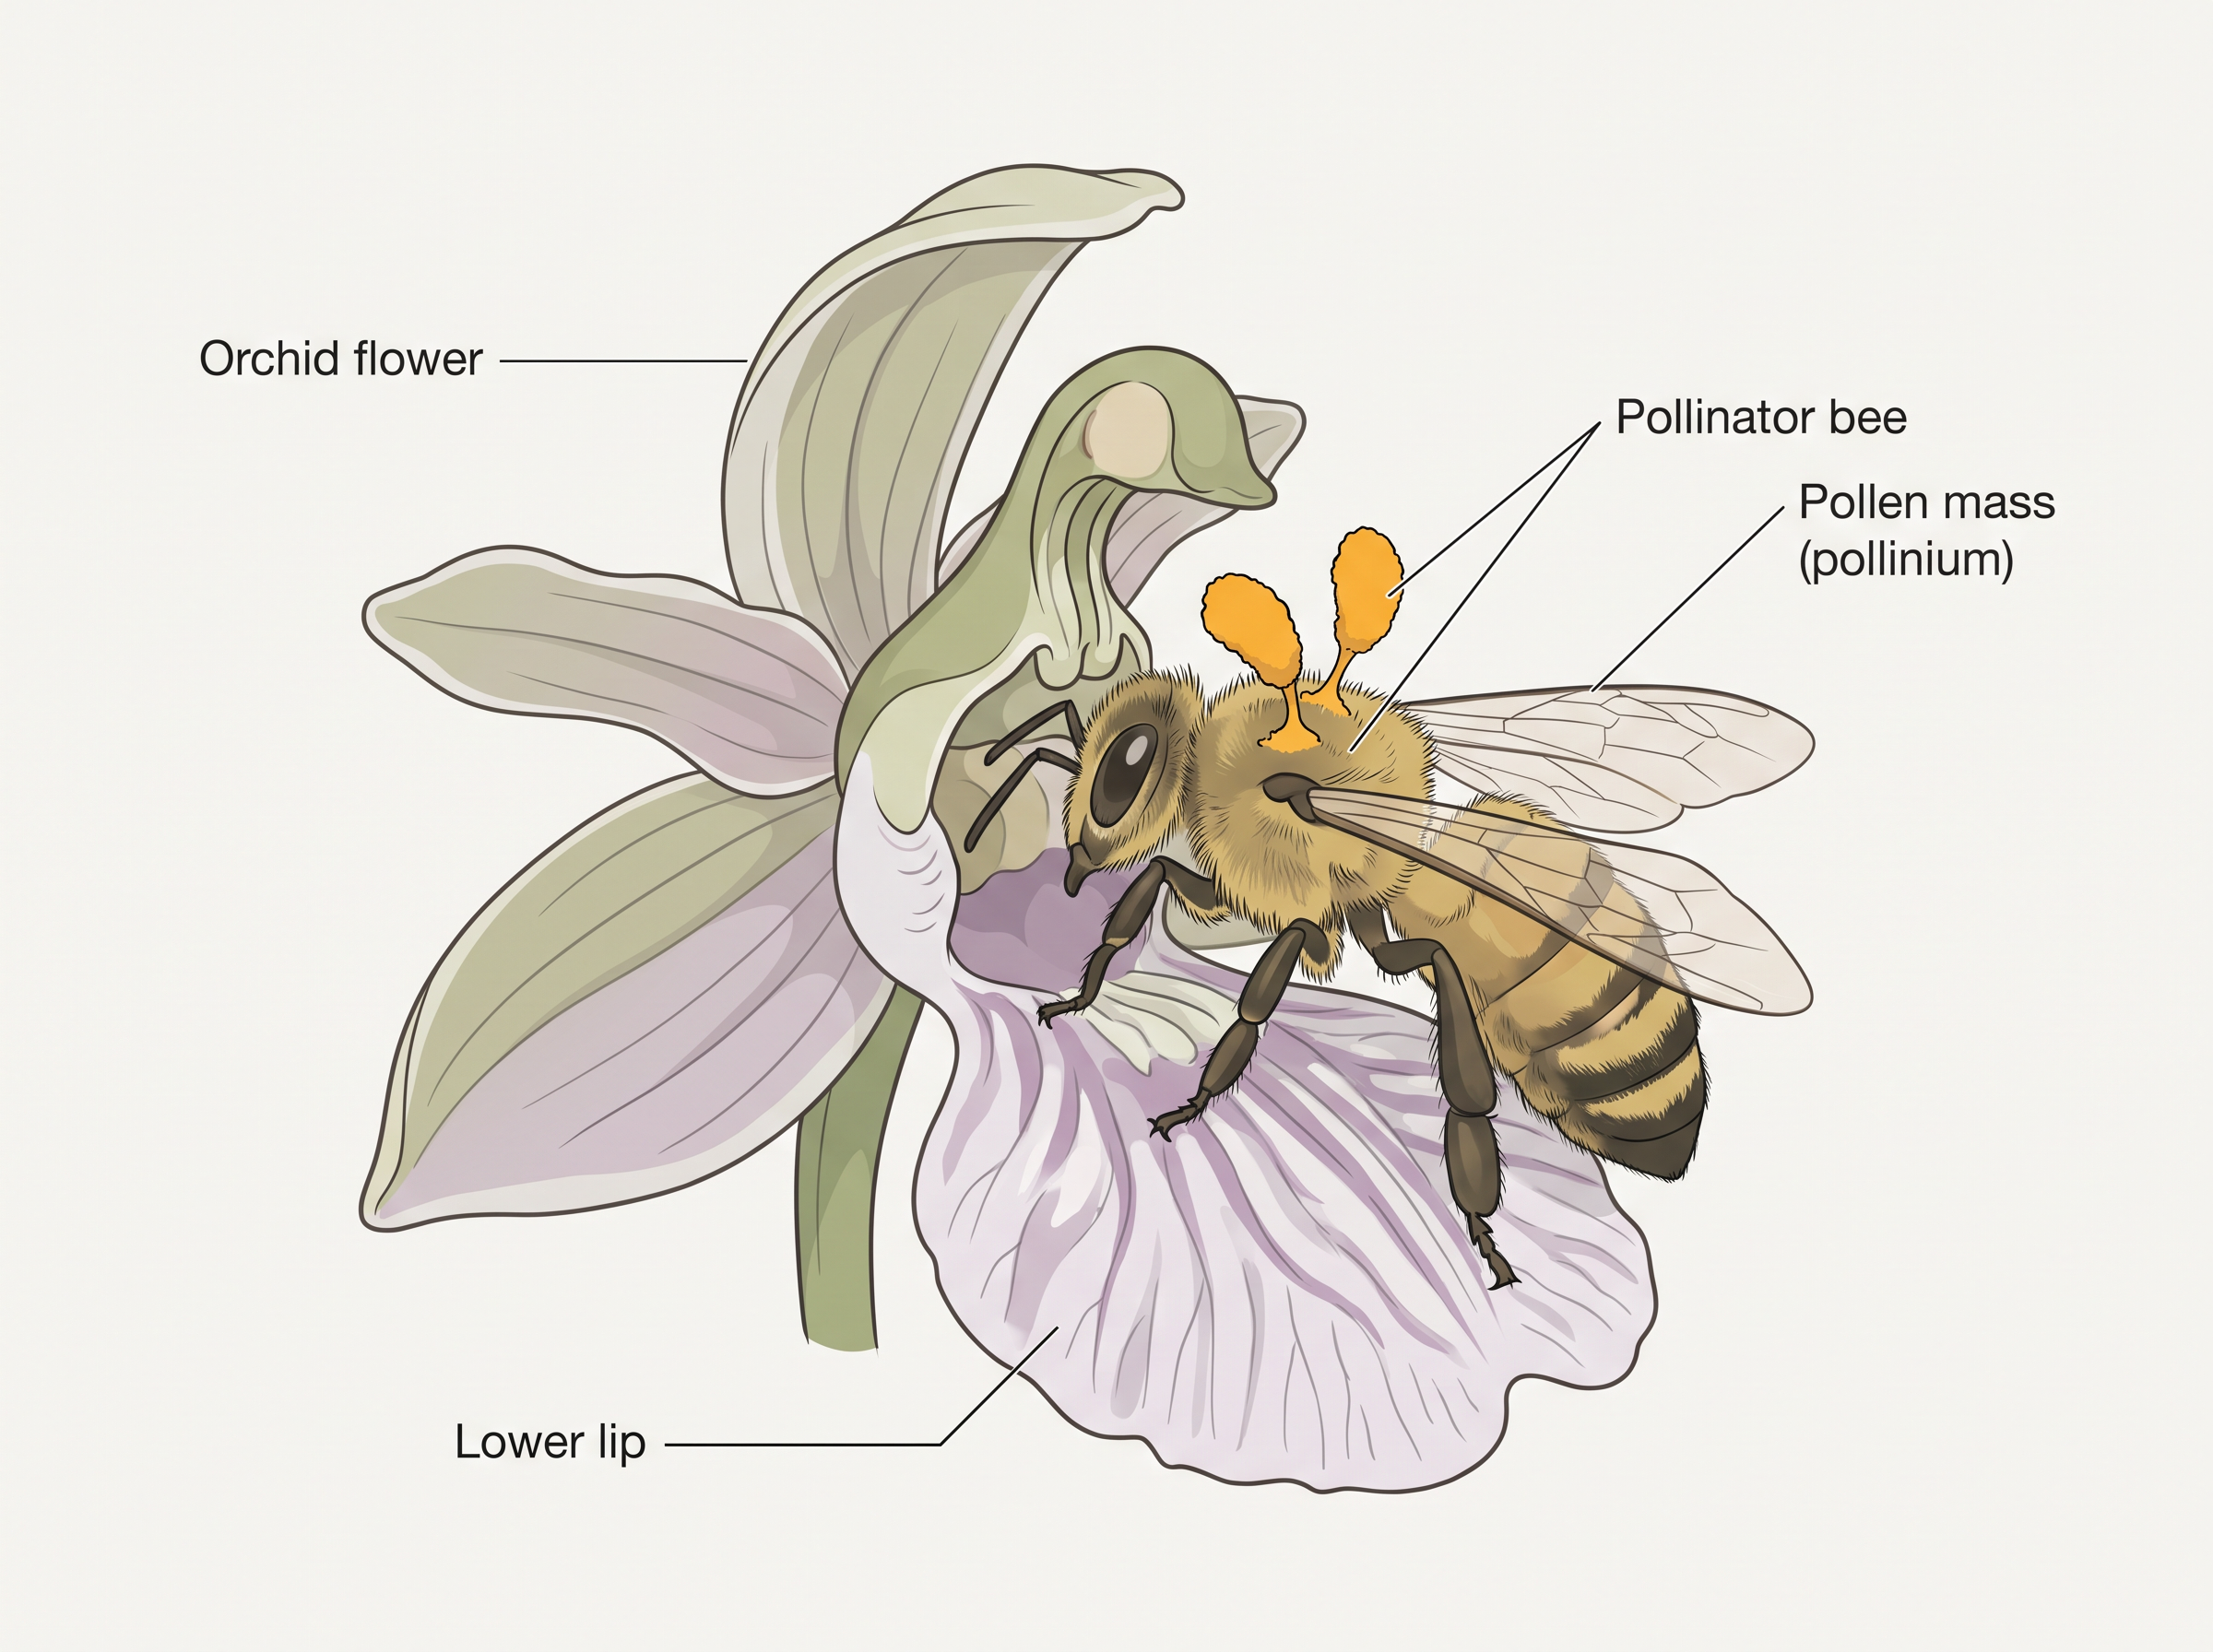
Fig. 11.5 – A bee pollinating an orchid flower.
This case beautifully shows how co-evolution works. If, for any reason, the female bee’s colour patterns were to change even slightly during evolution, the orchid’s pollination success would drop — unless the orchid flower co-evolved to keep its petal resembling the changed female bee. Partner tracks partner, generation after generation.
11.2 Summary
- Ecology is the branch of biology that studies the relationships of living organisms with the abiotic (physico-chemical) factors and the biotic (other species) components of their environment. It is studied at four levels of biological organisation — organisms, populations, communities and biomes.
- Because evolutionary change through natural selection acts at the population level, population ecology is an important area of ecology. A population is a group of individuals of a given species that share or compete for similar resources in a defined geographical area.
- Populations have attributes that individual organisms do not: birth rates, death rates, sex ratio and age distribution. The proportion of the different age groups of males and females is often shown graphically as an age pyramid, whose shape reveals whether the population is stationary, growing or declining.
- The ecological effect of any factor on a population is generally seen as a change in its size (population density). Density may be expressed in different ways — as numbers, biomass, per cent cover and so on — depending on the species.
- Populations grow through births and immigration and shrink through deaths and emigration. When resources are unlimited, growth is usually exponential (J-shaped); when resources become progressively limiting, growth becomes logistic (S-shaped). In either case, growth is ultimately capped by the carrying capacity (K) of the environment. The intrinsic rate of natural increase (r) measures a population’s inherent potential to grow.
Flowchart
FC 11.5 – The population story at a glance: individuals form a population → its density (N) changes through natality/immigration (increase) and mortality/emigration (decrease) → under unlimited resources growth is exponential (J-shaped) → under limited resources growth is logistic (S-shaped), levelling off at carrying capacity K.
- In nature, populations of different species do not live in isolation but interact in many ways. Depending on the outcome for each species, these interactions are classified as competition (both suffer), predation and parasitism (one benefits, the other suffers), commensalism (one benefits, the other is unaffected), amensalism (one is harmed, the other unaffected) and mutualism (both benefit).
- Predation is an important process through which trophic energy is transferred to higher levels, and some predators help control their prey populations. Plants have evolved diverse morphological and chemical defences against herbivory.
- In competition, the superior competitor is presumed to eliminate the inferior one (the Competitive Exclusion Principle), but many closely related species have evolved mechanisms — such as resource partitioning — that let them co-exist.
- Some of the most fascinating examples of mutualism in nature are seen in plant–pollinator interactions.
11.3 Points to Ponder
- The r value for the human population of India was 0.0205 in 1981. Find out what India’s current r value is. To work it out, what two pieces of information about the population would you need?
- Gather the population figures for India from Government Census data over the last 100 years, plot them against time, and decide which growth pattern — exponential or logistic — the graph most resembles. What might this suggest about India’s approach to its carrying capacity?
- Some organisms breed only once in a lifetime and pour everything into that single event, while others breed many times and invest less each time. Which strategy is “better” for maximising fitness — or does the answer depend entirely on the kind of habitat the organism lives in?
- We often assume a truly “ideal” parasite would live inside its host without harming it at all. Then why has natural selection not simply produced perfectly harmless parasites everywhere?
- Predators in nature are said to be “prudent,” rarely wiping out their prey. What would happen, over time, to a predator that was not prudent and over-exploited its prey?
- When an exotic species is introduced into a new region without its natural predators, it can turn invasive and spread out of control. What does this tell us about the hidden role predators play in keeping their home ecosystems in balance?
- In co-evolving mutualisms such as the fig and its wasp, or the orchid and its bee, each partner depends utterly on the other. What risks does such a tightly linked, one-to-one relationship carry if one partner’s population were to suddenly decline?
11.4 NCERT Questions
- List the attributes that populations possess but not individuals.
- If a population growing exponentially doubles in size in 3 years, what is the intrinsic rate of increase (r) of the population?
- Name important defence mechanisms in plants against herbivory.
- An orchid plant is growing on the branch of a mango tree. How would you describe this interaction between the orchid and the mango tree?
- What is the ecological principle behind the biological control method of managing pest insects?
- Define population and community.
- Define the following terms and give one example for each:
- Commensalism
- Parasitism
- Camouflage
- Mutualism
- Interspecific competition
- With the help of a suitable diagram, describe the logistic population growth curve.
- Select the statement which best explains parasitism.
- One organism is benefited.
- Both the organisms are benefited.
- One organism is benefited, the other is not affected.
- One organism is benefited, the other is affected.
- List any three important characteristics of a population and explain each.
11.5 Check Your Concepts
- Assertion–Reason. Assertion: A single individual organism cannot have a birth rate or a death rate. Reason: Birth rate and death rate are per capita rates that emerge only when many individuals are counted together. State whether the assertion and the reason are true, and whether the reason correctly explains the assertion.
- Why is per cent cover or biomass often a more meaningful measure of population density than a simple headcount when comparing a single large banyan tree with 200 carrot grass plants in an area?
- The tiger census in national parks is based on pug marks and faecal pellets rather than direct counting. What does this tell you about how ecologists measure the density of large, elusive animals, and why is such an indirect method necessary?
- Arrange the four phases of logistic (S-shaped) population growth in the correct sequence: acceleration, asymptote, lag phase, deceleration.
- In the logistic growth equation \(\\frac{dN}{dt} = rN\\left(\\frac{K-N}{K}\\right)\), explain what happens to the growth rate when (a) N is very small and (b) N becomes equal to K. Why does the curve level off?
- Diagram-based. Draw and label the three types of age pyramids for a human population, and state for each whether the population is expanding, stable or declining. What feature of the pyramid did you use to decide?
- Match the following interaction with the correct sign combination for the two species involved:
| Interaction | Signs |
|---|---|
| a. Mutualism | i. − − |
| b. Competition | ii. + 0 |
| c. Predation | iii. + + |
| d. Commensalism | iv. − 0 |
| e. Amensalism | v. + − |
- Why can two closely related species competing for the same limiting resource not co-exist indefinitely? Name the principle involved and one mechanism by which such species may still manage to co-exist.
- A clown fish living among the stinging tentacles of a sea anemone gains protection, while the anemone appears to gain nothing. Name this interaction and explain how it differs from the mutualism seen between a fig tree and its wasp.
- Assertion–Reason. Assertion: The female mosquito is not considered a parasite even though it needs our blood. Reason: A parasite maintains a close, sustained dependence on a single host, whereas the mosquito only takes a brief blood meal from many hosts. State whether the assertion and reason are true and whether the reason correctly explains the assertion.
- Many parasites have lost their sense organs and digestive system but have a very high reproductive capacity. Explain how each of these features is an adaptation that suits the parasitic way of life.
- What happened when all the starfish (Pisaster) were experimentally removed from an intertidal patch, and what does this reveal about the role of a predator in maintaining species diversity?
- The Monarch butterfly is distasteful to birds, yet it does not manufacture the protective chemical itself. Explain where this chemical comes from and how this is an example of a prey defence against predation.
- Distinguish between ectoparasites and endoparasites, giving one example of each.
- In the Mediterranean orchid Ophrys, the flower’s petal mimics a female bee. Explain how “sexual deceit” achieves pollination, and why the orchid and the bee must co-evolve for this system to keep working.
- Using the equation \(N\_{t+1} = N\_t + \[(B + I) - (D + E)]\), state the condition under which a population’s density will increase. Which two of the four processes are usually the most important under normal conditions?
11.6 Practice With Numericals
- In a pond there were 40 water-hyacinth plants last year. Through reproduction, 12 new plants were added this year. Calculate the birth rate of the population, expressed as offspring per plant per year.
- In a laboratory culture of 250 fruitflies, 15 individuals died during one week. Calculate the death rate of the population for that period.
- A population of beetles has a per capita birth rate (b) of 0.45 and a per capita death rate (d) of 0.10 per year. Calculate the intrinsic rate of natural increase (r) for this population.
- A bacterial population starts with \(N\_0 = 100\) cells and grows exponentially with an intrinsic rate of natural increase \(r = 0.5\) per hour. Using \(N\_t = N\_0,e^{rt}\), calculate the population size after 4 hours. (Take \(e = 2.71828\).)
- In a given habitat, over one breeding season a bird population records 60 births (B), 25 deaths (D), 10 immigrants (I) and 8 emigrants (E). If the population at the start of the season was 200, calculate its size at the end of the season using \(N\_{t+1} = N\_t + \[(B + I) - (D + E)]\).
- A population growing exponentially triples in size in 5 years. Set up the equation you would use to find its intrinsic rate of increase (r), and identify each term in it. (You are not required to compute the final decimal value.)