Chapter 11: Photosynthesis in Higher Plants
Almost four hundred years ago, a Flemish physician named Jan Baptista van Helmont set out to answer a deceptively simple question: what does a growing plant actually feed on? Most people of his time assumed a plant slowly “ate” the soil it stood in. To test this, van Helmont planted a small willow branch weighing about 5 pounds (roughly 2.3 kg) in a large pot holding a carefully weighed amount of dried soil. For five years he watered it with nothing but rainwater, and let it grow.
When he finally lifted the willow out and weighed it again, it had swelled to about 169 pounds. Yet the soil in the pot had lost only a couple of ounces. Where had all that new wood, bark and leaf come from? Van Helmont concluded — reasonably, but incorrectly — that the plant had been built almost entirely out of water.
He was only half right. He had correctly ruled out the soil, but he had missed an invisible ingredient drifting all around his willow: the air itself, and the sunlight falling on its leaves. Unmasking that hidden ingredient, and the quiet chemistry that turns thin air and water into food, is the story of this chapter.
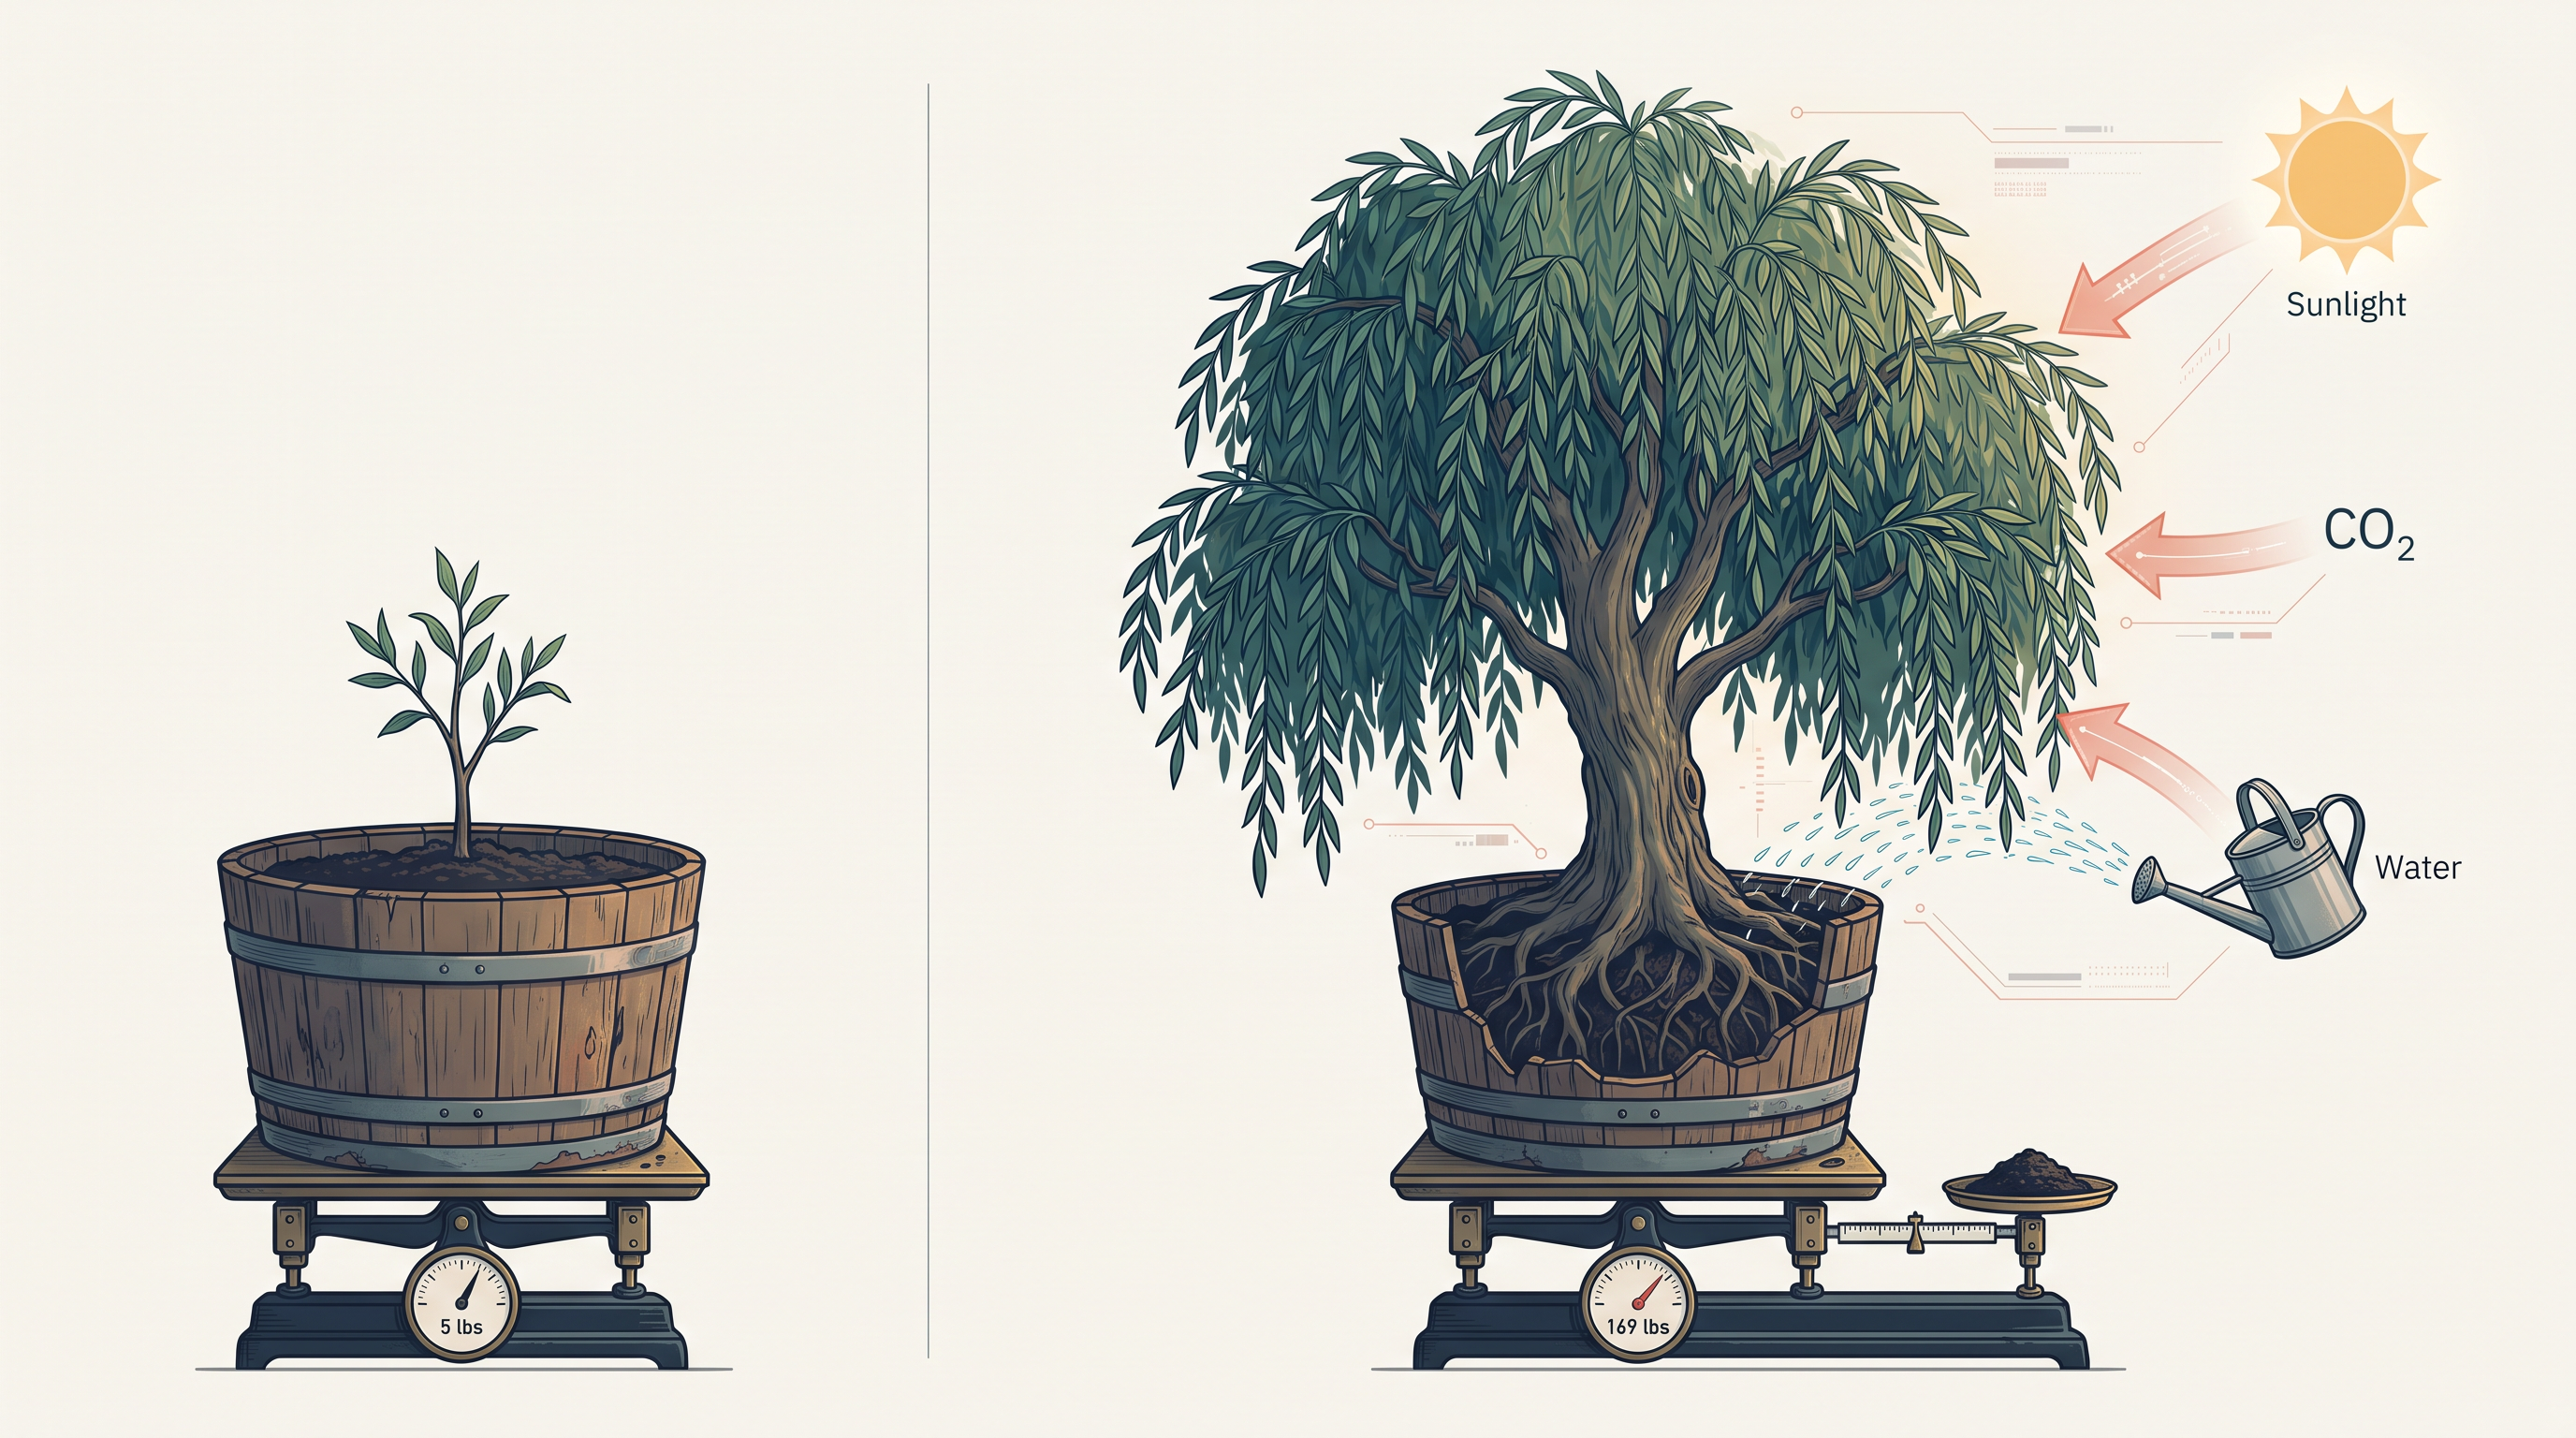
Fig. 11.0 – Van Helmont’s willow tree experiment.
Keep these questions in mind as you read — by the end of the chapter you will be able to answer every one of them.
11.1 What do we Know?
The Food Factories of the Living World
Every animal, including human beings, depends on plants for food — directly, by eating them, or indirectly, by eating other animals that themselves feed on plants. Have you ever wondered where the plants themselves get their food? Unlike animals, green plants do not go looking for a meal; they build one from scratch. Using simple raw materials and the energy of sunlight, they manufacture their own organic food.
Because they nourish themselves in this way, green plants are called autotrophs (auto = self, troph = nourishment). Every other organism that cannot make its own food, and must obtain it from plants or from other organisms, is a heterotroph (hetero = other). You have already learnt that autotrophic nutrition of this kind is found only in green plants and a few other organisms.
The process by which green plants make this food is called photosynthesis — literally, “putting together (synthesis) with the help of light (photo).” It is described as a physico-chemical process: physical, because it captures light energy, and chemical, because it uses that energy to build organic compounds.
Since the food made in photosynthesis stores captured sunlight as chemical energy, every meal you eat can be traced back to a green leaf somewhere. Ultimately, all living forms on earth depend on sunlight for their energy, and this dependence is exactly why photosynthesis is regarded as the basis of life on earth.
This chapter focuses on two things: the structure of the photosynthetic machinery inside the plant, and the various reactions that transform light energy into stored chemical energy.
Clues from Simple Experiments
Let us begin by gathering what we already know about photosynthesis from simple experiments done in earlier classes. Those experiments pointed to three requirements: chlorophyll (the green pigment of the leaf), light, and carbon dioxide (CO₂). A pigment is simply a coloured substance that absorbs light; chlorophyll is the green pigment that traps the light energy photosynthesis runs on.
One classic experiment tests for starch, the storage form of the sugar made in photosynthesis. If a leaf has been photosynthesising, it stores starch — and starch turns blue-black when iodine solution is added, giving us a simple chemical test. Two versions of this experiment are especially revealing, as shown in Fig. 11.1.
In the first version, a variegated leaf (one that is partly green and partly white) — or a green leaf that has been partly covered with black paper — is left in light and then tested for starch. Only the green regions that received light test positive; the white patches and the covered regions test negative. This tells us that starch, and therefore photosynthesis, forms only where both chlorophyll and light are present together.
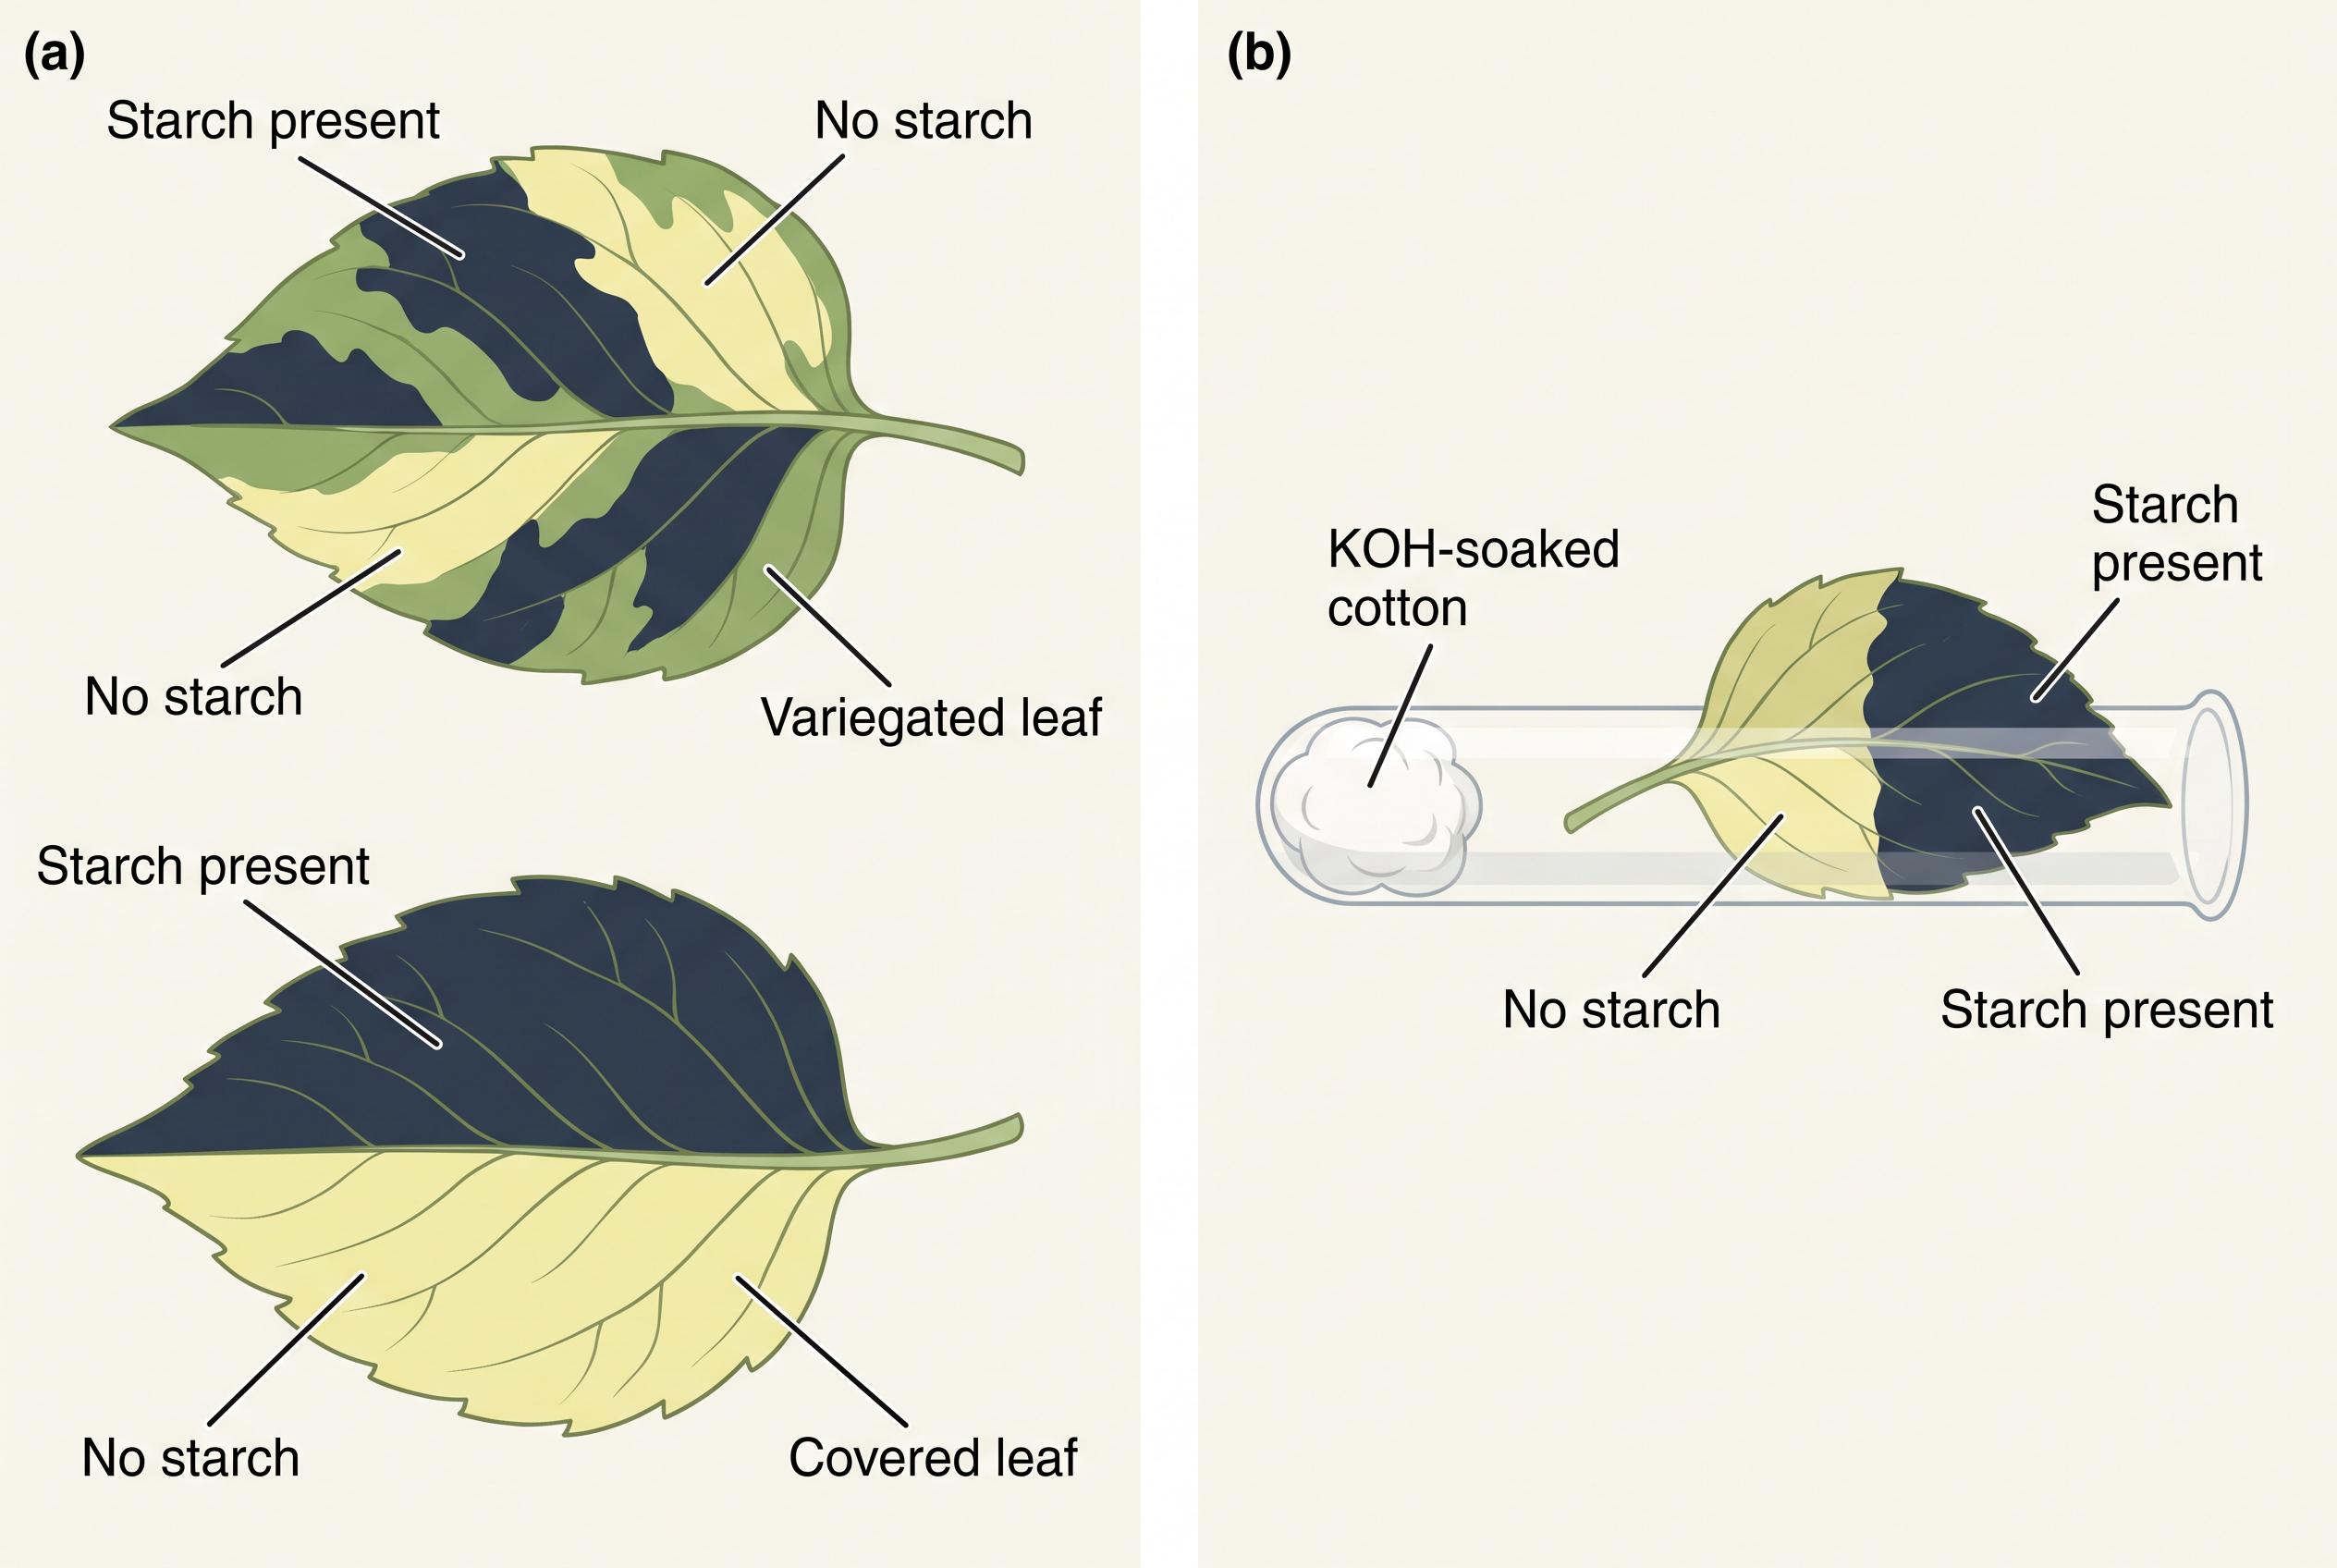
Fig. 11.1 – Leaf experiments testing for starch.
In the second version, part of a leaf is enclosed in a test tube containing cotton soaked in potassium hydroxide (KOH), which absorbs the CO₂ from the air trapped inside the tube, while the other half of the same leaf stays out in open air. After some time in light, both parts are tested for starch. The exposed half tests positive, but the half sealed away from CO₂ tests negative. Since the only thing that differed between the two halves was the supply of CO₂, this shows that CO₂ is required for photosynthesis.
Together, these everyday experiments give us the “ingredient list” for photosynthesis — chlorophyll, light and CO₂. What they do not yet tell us is how these ingredients are combined, or exactly where inside the plant the work is done. Those are the questions the rest of the chapter sets out to answer.
11.2 Early Experiments
Our modern understanding of photosynthesis did not appear all at once. It was pieced together over almost two centuries, one clever experiment at a time. Following that trail is worthwhile, because each experiment answered one small question and set up the next. The overall build-up of ideas is summarised in FC 11.1.
Flowchart
FC 11.1 – Growth of our understanding of photosynthesis: Priestley (1770): plants restore air fouled by candles and animals → Ingenhousz: sunlight is essential, and only green parts release O₂ → von Sachs (~1854): green parts make glucose, stored as starch, inside chloroplasts → Engelmann: blue and red light drive photosynthesis most (first action spectrum) → van Niel: hydrogen comes from an oxidisable donor, and O₂ comes from H₂O, not CO₂ → overall equation established: 6CO₂ + 12H₂O → C₆H₁₂O₆ + 6H₂O + 6O₂.
Priestley: Air Can Be “Damaged” and “Restored”
The English scientist Joseph Priestley (1733–1804), who discovered oxygen in 1774, was among the first to reveal the essential role of air in the life of green plants. In 1770 he noticed that a candle burning inside a sealed bell jar soon goes out, and that a mouse trapped in the same closed space soon suffocates, as illustrated in Fig. 11.2. From this he concluded that both a burning candle and a breathing animal somehow “damage” the air.
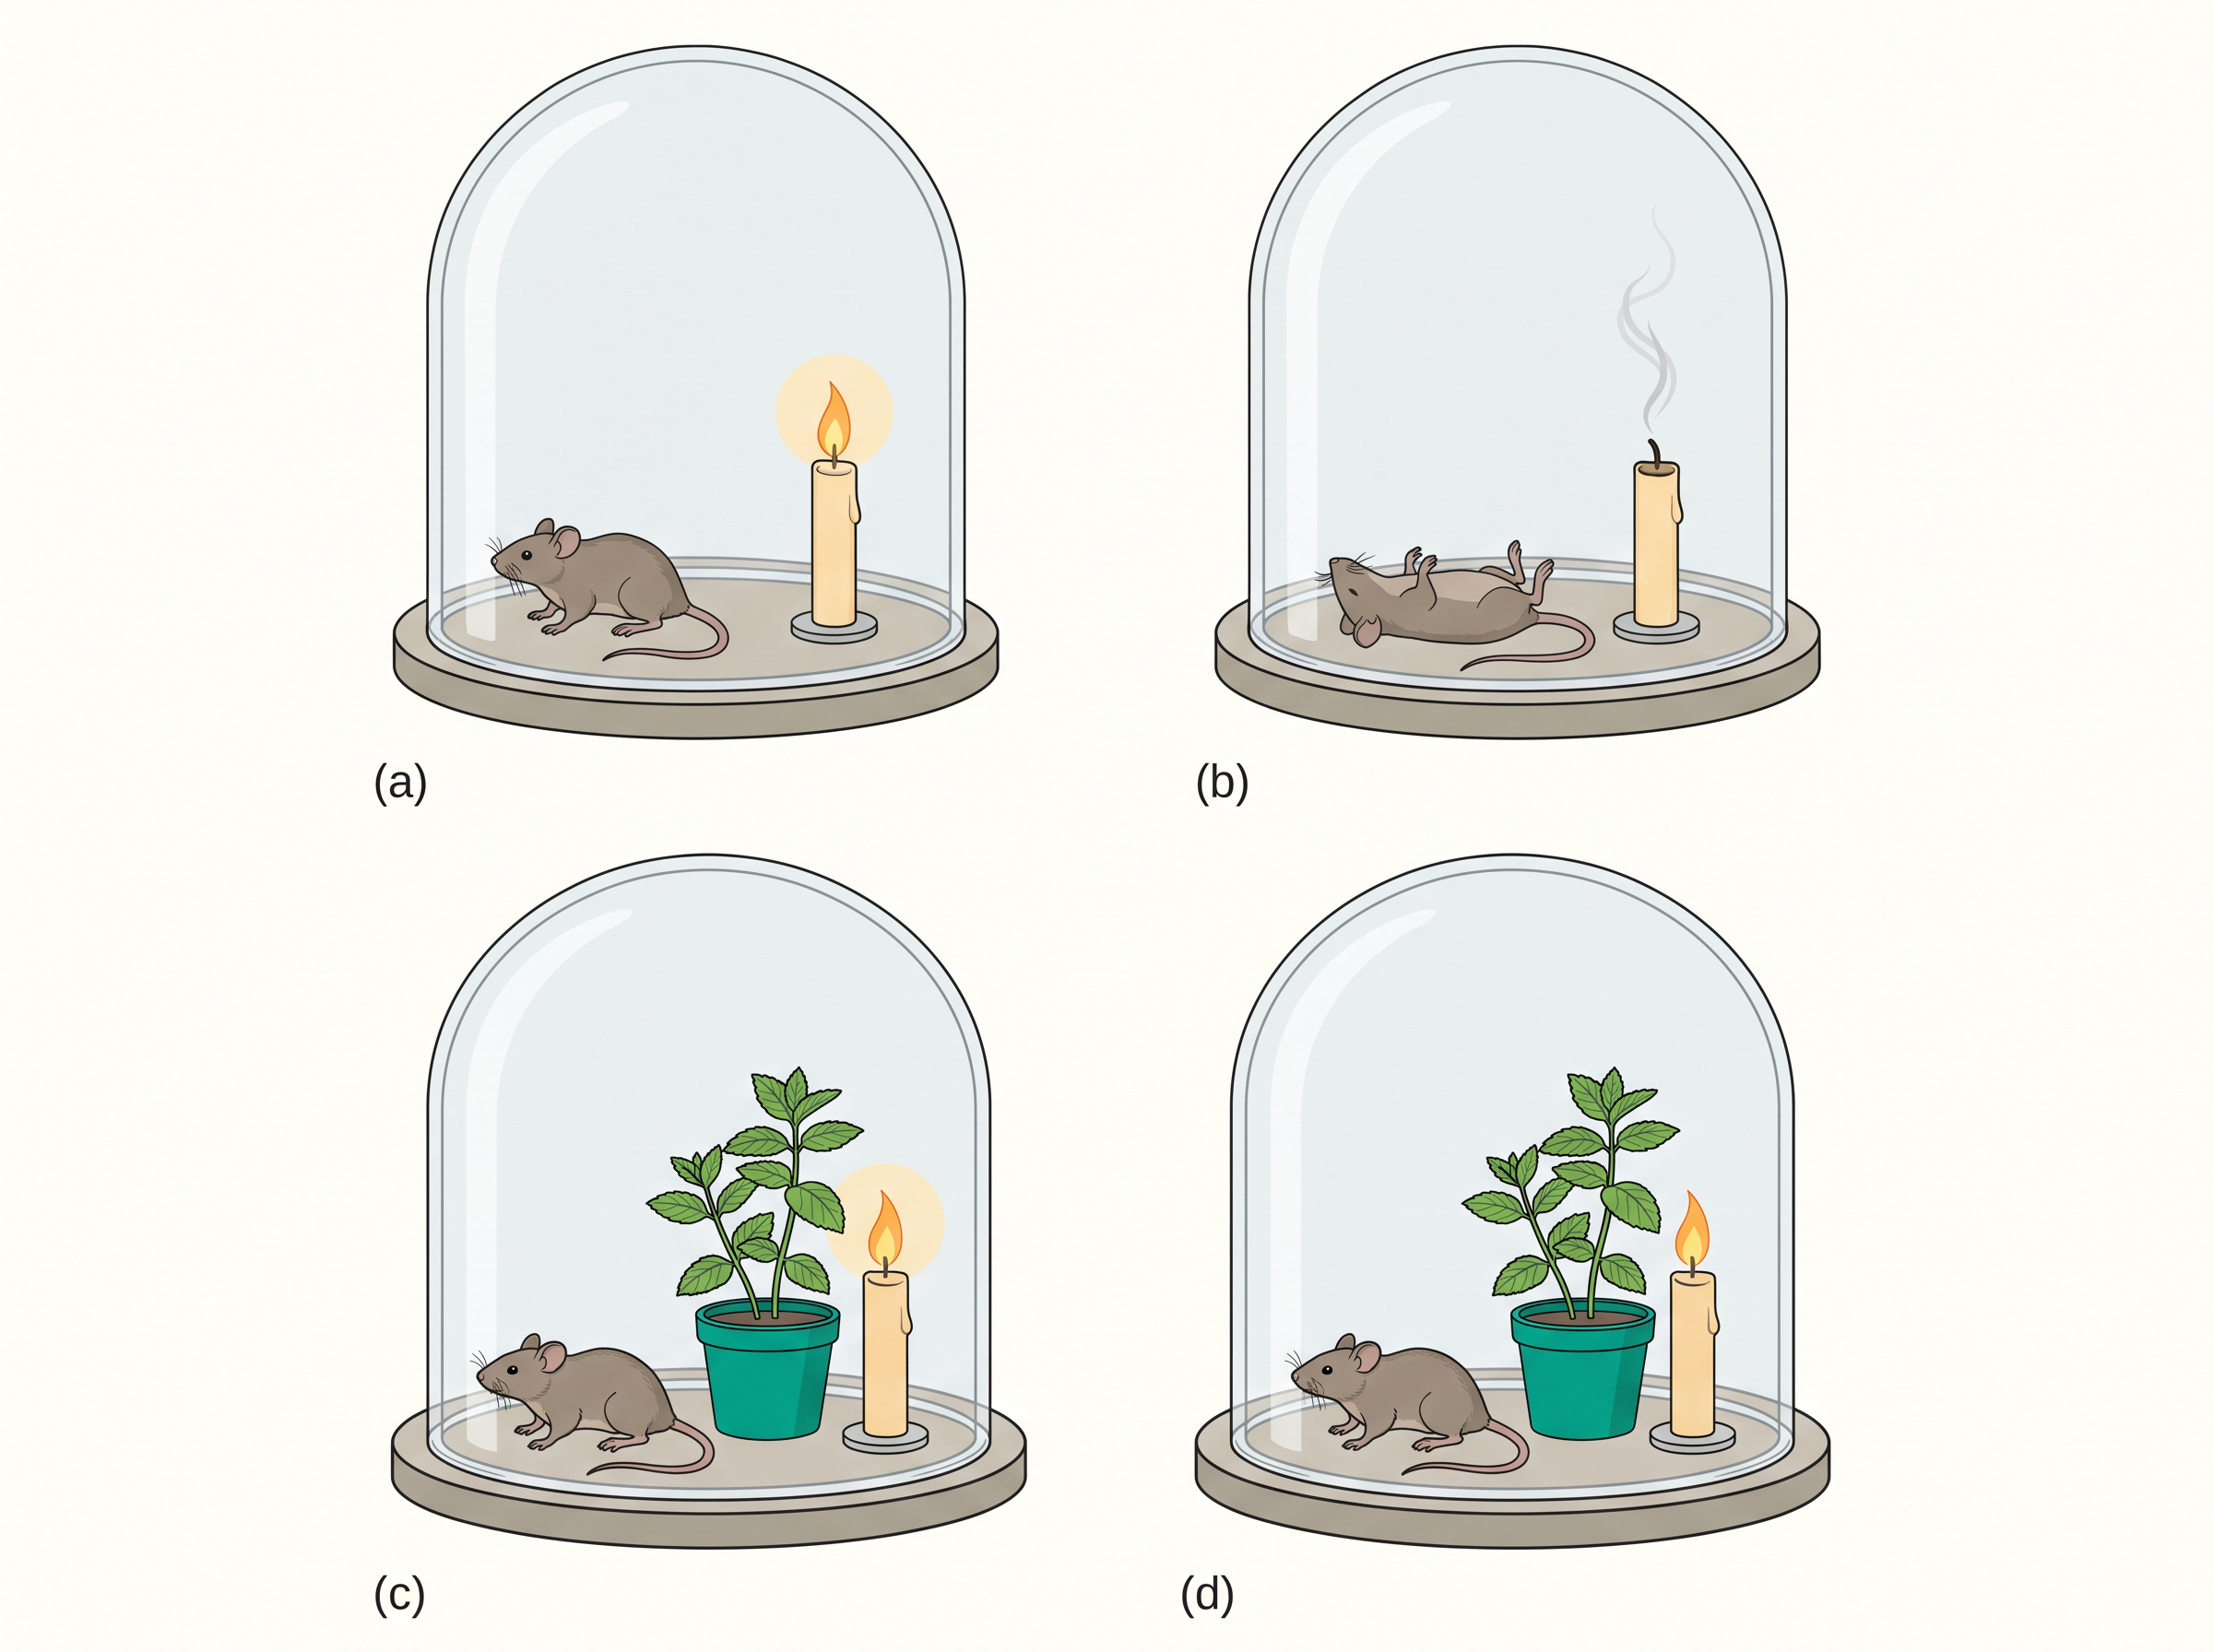
Fig. 11.2 – Priestley’s bell-jar experiment.
Priestley then made the crucial addition: he placed a mint plant inside the same bell jar. Now the mouse stayed alive and the candle kept burning. He proposed a simple, powerful idea — that plants restore to the air whatever breathing animals and burning candles remove from it. In today’s language, the animals and candle used up oxygen, and the plant put it back.
Ingenhousz: Sunlight and the Green Parts Matter
Priestley’s set-up had one gap: it did not reveal whether the plant needed anything special to do its air-restoring job. The Dutch scientist Jan Ingenhousz (1730–1799) filled that gap. Using a similar arrangement, but placing it once in the dark and once in sunlight, he showed that sunlight is essential for the plant process that purifies the fouled air. In the dark, the plant did not help at all.
In an elegant follow-up, Ingenhousz worked with an aquatic plant. In bright sunlight, tiny bubbles gathered around the green parts of the plant, while in the dark no bubbles appeared. He later identified these bubbles as oxygen. This showed two things at once: that light is required, and that it is only the green parts of a plant that release oxygen.
von Sachs: Glucose, Starch and the Green Bodies
By about 1854, the German botanist Julius von Sachs provided the first clear evidence that plants actually produce glucose as they grow, and that this glucose is usually stored as starch (glucose molecules linked into a storage carbohydrate). His later work showed that the green colouring matter of plants — what we now call chlorophyll — is not spread everywhere but is packed inside special bodies within the cells, later named chloroplasts. He established that the green parts are where glucose is made, and where it is stored as starch.
Engelmann: Which Colours of Light Drive Photosynthesis?
The next question was subtler: does every colour of sunlight drive photosynthesis equally, or only some? The German scientist T.W. Engelmann (1843–1909) designed a beautifully indirect experiment to find out, shown in Fig. 11.3. Using a prism, he split a beam of light into its spectrum of colours and shone it across a filament of the green alga Cladophora. He then surrounded the alga with a suspension of aerobic bacteria — bacteria that gather wherever oxygen is most plentiful.
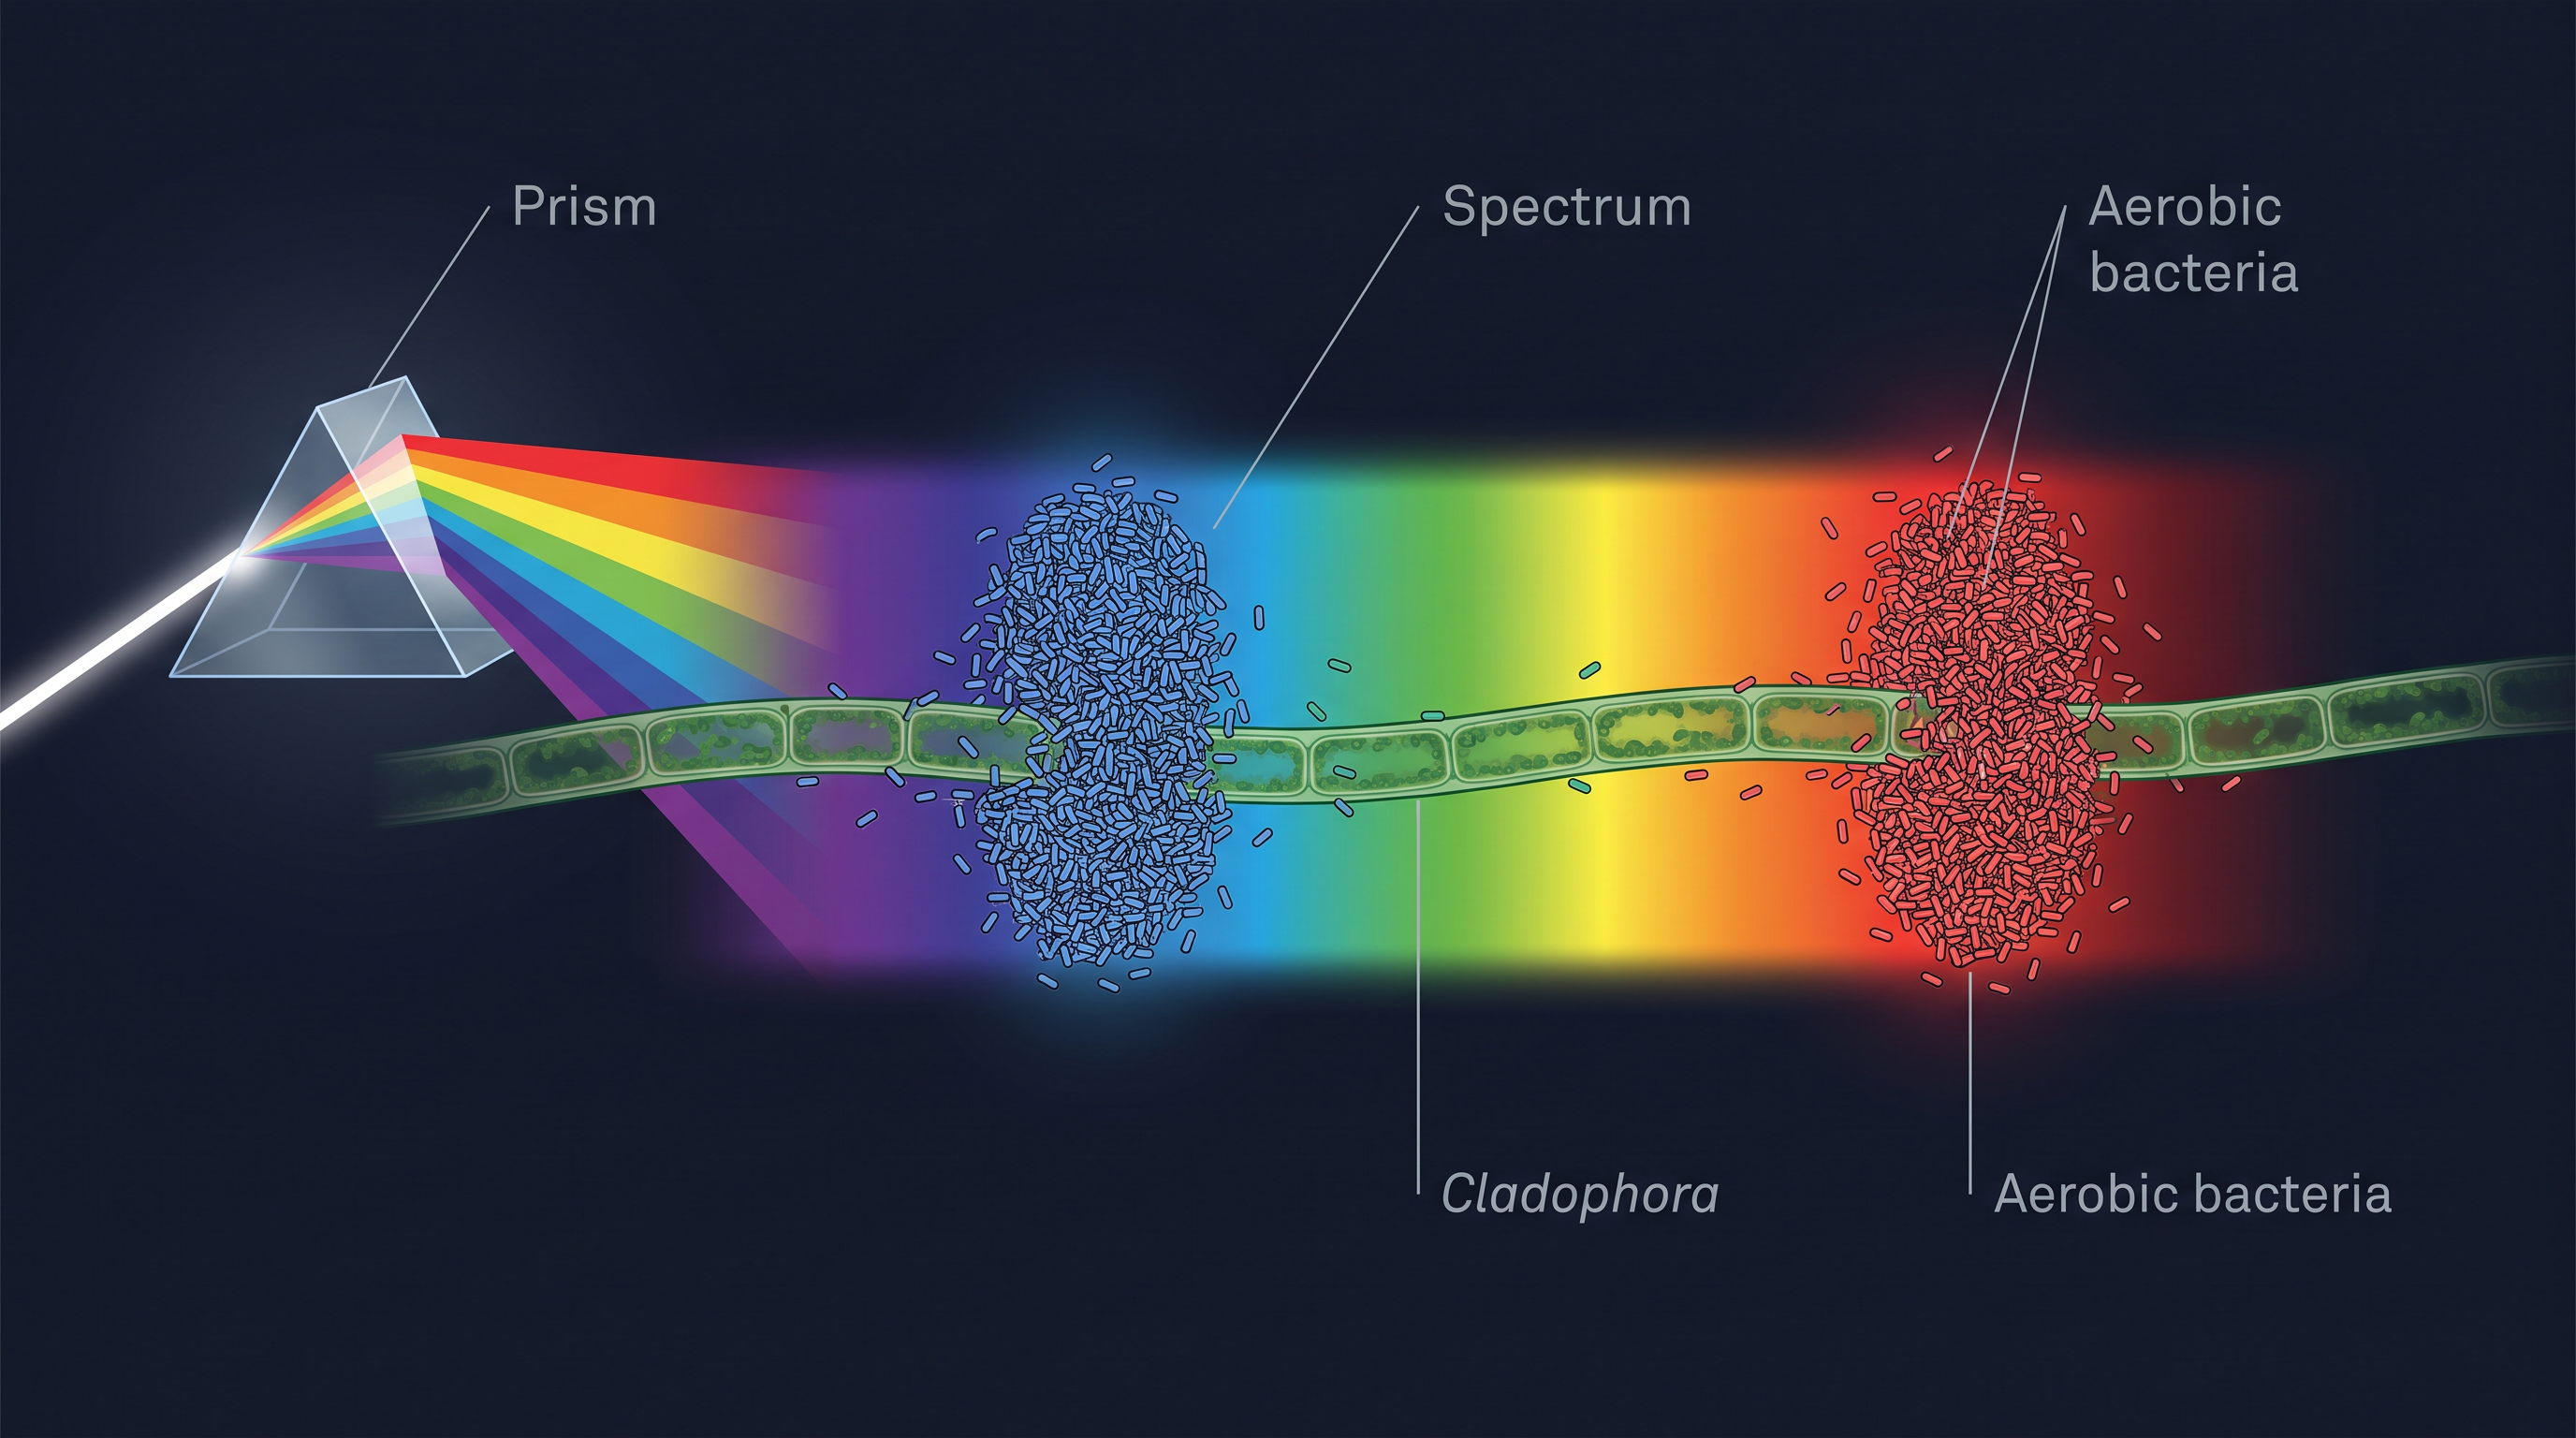
Fig. 11.3 – Engelmann’s experiment mapping the action spectrum.
Since photosynthesis releases oxygen, the bacteria acted as living oxygen-detectors: they crowded most thickly wherever the alga was releasing the most oxygen. Engelmann observed the bacteria accumulating mainly in the blue and red regions of the split spectrum. In this way he mapped out the first action spectrum of photosynthesis — a graph of how effectively different wavelengths of light drive the process. It roughly matches the absorption spectra of chlorophyll a and b, which we will study in Section 11.4.
Writing the Equation for Photosynthesis
By the middle of the nineteenth century the key idea was clear: plants use light energy to make carbohydrates from CO₂ and water. The overall change could be written as a simple empirical equation:
\[CO\_2 + H\_2O \\xrightarrow{\\text{Light}} \[CH\_2O] + O\_2\]
Here \(\[CH\_2O]\) is a shorthand for one unit of carbohydrate (for example, glucose, a six-carbon sugar, can be thought of as six such \(\[CH\_2O]\) units linked together). The equation captures the inputs and outputs, but it hides an important question that had not yet been settled: where exactly does the released oxygen come from?
van Niel: Where Does the Oxygen Come From?
That question was answered by the microbiologist Cornelius van Niel (1897–1985). Studying purple and green bacteria, he showed that photosynthesis is essentially a light-dependent reaction in which hydrogen from a suitable oxidisable compound is used to reduce carbon dioxide to carbohydrate. He captured this as a general equation:
\[2H\_2A + CO\_2 \\xrightarrow{\\text{Light}} 2A + CH\_2O + H\_2O\]
In this equation \(H\_2A\) stands for any hydrogen (electron) donor, and \(A\) is what remains once its hydrogen has been removed. The insight is that different organisms use different donors. In green plants, the donor \(H\_2A\) is water (\(H\_2O\)), which is oxidised, releasing \(O\_2\). But some organisms release no oxygen at all: in purple and green sulphur bacteria the donor is hydrogen sulphide (\(H\_2S\)), and the “oxidation” product is sulphur or sulphate — not oxygen.
Comparing these cases, van Niel reasoned that the \(O\_2\) given off by a green plant must come from the water it splits, not from the carbon dioxide it fixes. This was later confirmed directly using radioisotope techniques (by supplying water labelled with a heavy isotope of oxygen and finding that label in the released \(O\_2\)).
The Corrected Overall Equation
Putting this together, the correct overall equation for photosynthesis in green plants is:
\[6CO\_2 + 12H\_2O \\xrightarrow{\\text{Light}} C\_6H\_{12}O\_6 + 6H\_2O + 6O\_2\]
where \(C\_6H\_{12}O\_6\) represents glucose. Twelve molecules of water are shown reacting on the left, and six molecules are shown re-formed on the right — a detail that reflects the fact that the released oxygen comes from water. Because the \(O\_2\) traces back to water, more water must be supplied than the net amount consumed.
It is important to note that this equation is not a single reaction. It is a compact summary of a long, multistep process — a whole sequence of reactions that together make up photosynthesis, which the rest of this chapter unpacks.
11.3 Where does Photosynthesis take Place?
More than Just Leaves
Asked where photosynthesis happens, you would probably answer “in the green leaf” or “in the chloroplasts” — and you would be right, as you learnt in Chapter 8. But leaves are not the only place. Photosynthesis also occurs in other green parts of a plant wherever chloroplasts are present.
Recall from the earlier unit that the mesophyll cells — the main tissue in the interior of a leaf — contain large numbers of chloroplasts. These chloroplasts usually line up along the walls of the mesophyll cells so that they receive the best possible amount of incident light. Their position is not fixed; the chloroplasts can shift depending on how strong the light is.
Inside the Chloroplast: A Division of Labour
You studied the structure of the chloroplast in Chapter 8. Within it lies a membranous system made of three parts: the grana, the stroma lamellae, and the stroma (the matrix), as shown in Fig. 11.4. Each granum (plural: grana) is a stack of flat, disc-shaped membrane sacs called thylakoids, and the stroma lamellae are membrane sheets that connect one granum to another. The stroma is the fluid ground substance in which these membranes are suspended.
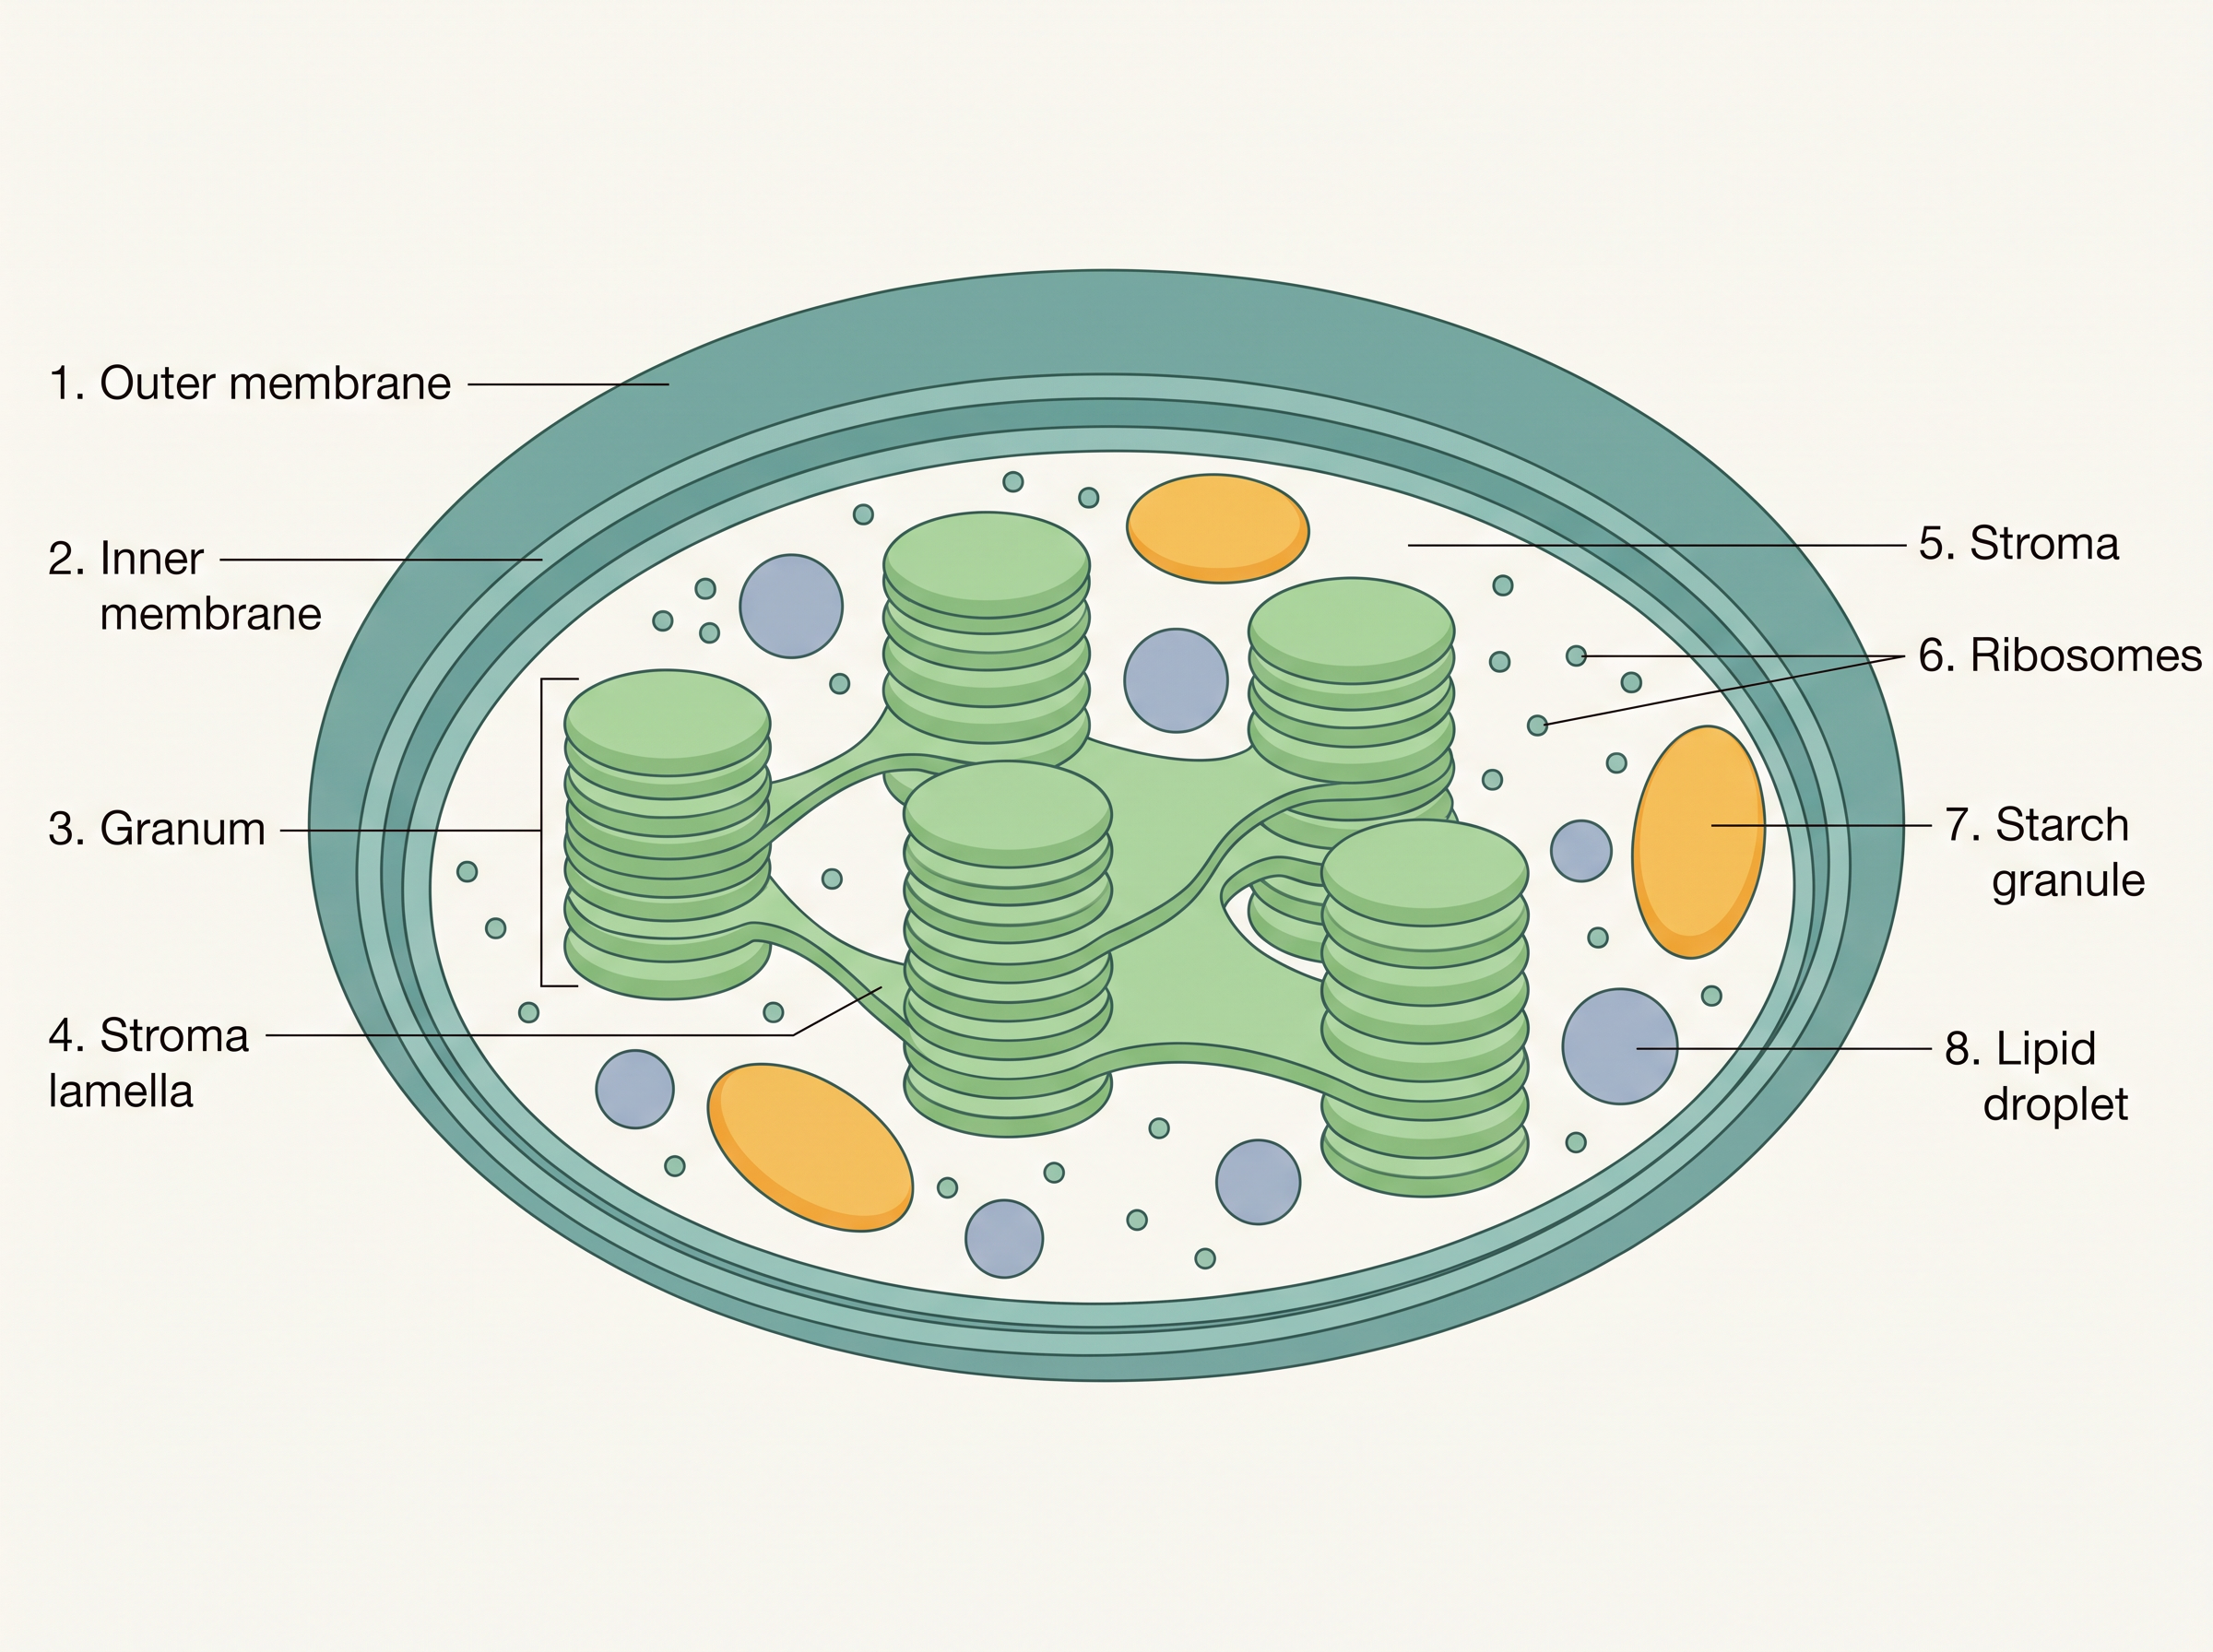
Fig. 11.4 – Sectional view of a chloroplast.
There is a clear division of labour inside the chloroplast. The membrane system (the grana and stroma lamellae) is responsible for trapping light energy and for making the energy-rich molecules ATP (the cell’s energy currency) and NADPH (a carrier of high-energy electrons, or reducing power). In the stroma, a different set of enzyme-driven reactions uses these molecules to build sugar, which is then stored as starch. This split is summarised in FC 11.2.
Flowchart
FC 11.2 – Division of labour in the chloroplast: Chloroplast → branches into (1) Membrane system (grana + stroma lamellae): traps light → light reactions → produces ATP + NADPH + O₂; and (2) Stroma (matrix): dark reactions → fixes CO₂ → sugar → starch. ATP and NADPH pass from the membrane system to the stroma to drive the second branch.
Light Reactions and Dark Reactions
The two sets of reactions are named for their relationship to light. Because the reactions in the membrane system are driven directly by light, they are called the light reactions (also called photochemical reactions). The reactions in the stroma are not driven directly by light; instead they depend on the ATP and NADPH produced by the light reactions. To distinguish them, they are called, by convention, the dark reactions (also called carbon reactions).
This name, however, is misleading and must be read carefully. Calling them “dark reactions” does not mean they occur in darkness, nor that they are independent of light. It only means they are not directly powered by light — they still depend on the light reactions to keep supplying ATP and NADPH.
With the “where” now settled, the chapter turns next to the pigments that actually capture the light, and then to the light and dark reactions themselves.
11.4 How many Types of Pigments are Involved in Photosynthesis?
Four Pigments, Not One
Look closely at plants and you will notice many different shades of green — sometimes even on the same plant. Why should a single “green” colour come in so many tones? The answer is that the green of a leaf is not produced by one pigment at all.
We can separate the pigments of a leaf using paper chromatography, a technique that spreads a mixture of coloured substances into separate bands according to how far each travels up a strip of paper. When leaf pigments are separated this way, the single green colour splits into four distinct pigments: chlorophyll a (which appears bright or blue-green in the chromatogram), chlorophyll b (yellow-green), xanthophylls (yellow), and carotenoids (yellow to yellow-orange).
A pigment is a substance that absorbs light at specific wavelengths. Each of these four pigments absorbs a slightly different range of light, which is why several of them working together let a leaf make the most of sunlight.
Absorption Spectrum: Which Colours Does Chlorophyll a Absorb?
To see how a pigment behaves, we study its absorption spectrum — a graph showing how strongly the pigment absorbs each wavelength (colour) of light across the visible spectrum, the familiar VIBGYOR. The absorption spectrum of chlorophyll a, along with chlorophyll b and the carotenoids, is shown in Fig. 11.5a.
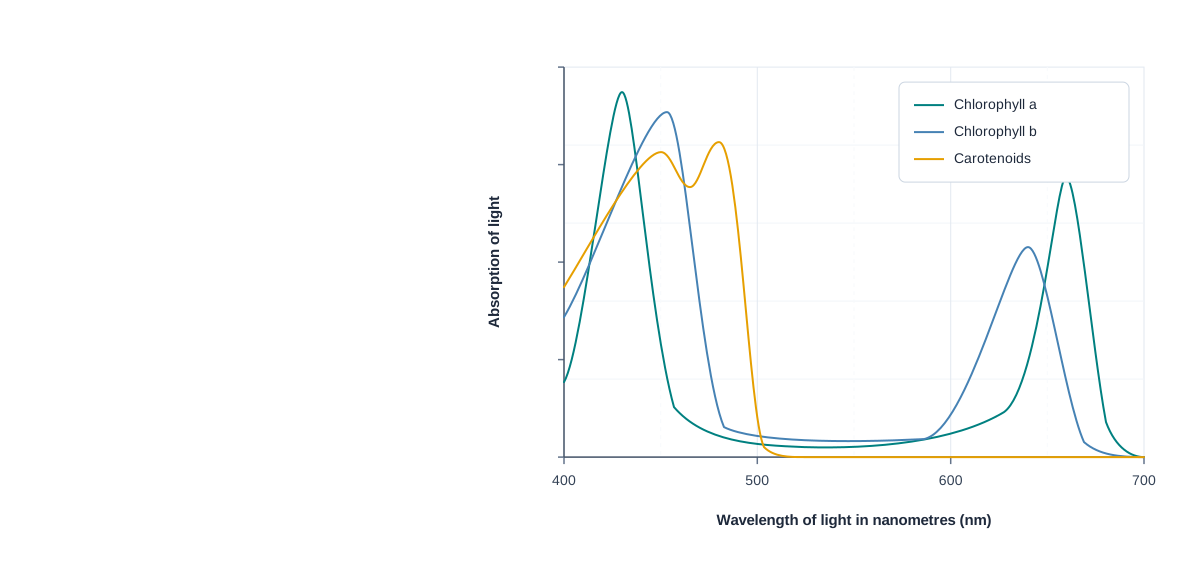
Fig. 11.5a – Absorption spectrum of photosynthetic pigments.
Action Spectrum: Which Colours Drive Photosynthesis?
Knowing which colours a pigment absorbs is one thing; knowing which colours actually make photosynthesis go fastest is another. For that we use an action spectrum — a graph of the rate of photosynthesis (measured, for example, by O₂ release) against wavelength, shown in Fig. 11.5b.
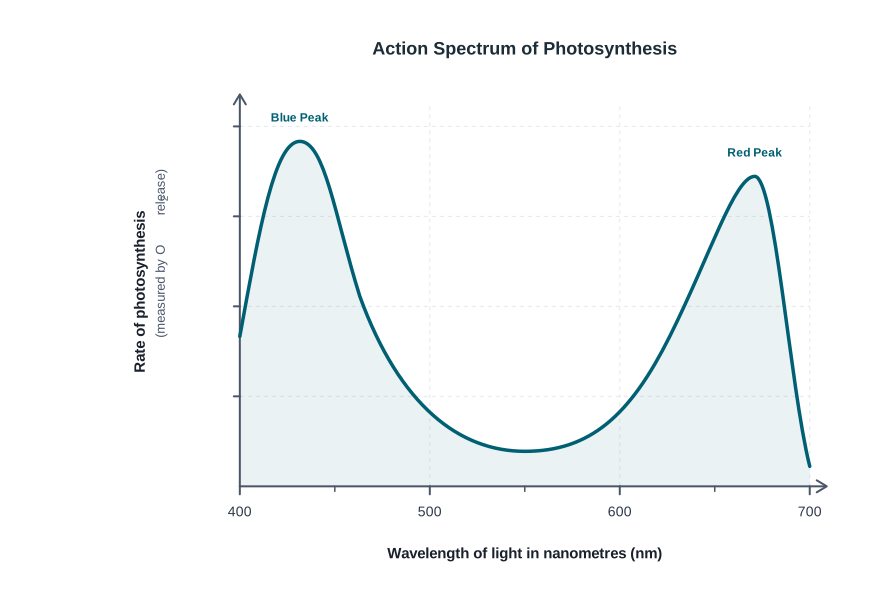
Fig. 11.5b – Action spectrum of photosynthesis.
Compare the two graphs and a pattern appears: the same wavelengths at which chlorophyll a absorbs most — the blue and the red regions — are also the wavelengths at which photosynthesis runs fastest. From this we can conclude that chlorophyll a is the chief pigment associated with photosynthesis.
But the match is not perfect. When the action spectrum is laid on top of chlorophyll a’s absorption spectrum (Fig. 11.5c), the two curves follow each other closely but do not overlap exactly — photosynthesis occurs at some wavelengths where chlorophyll a alone absorbs only weakly.
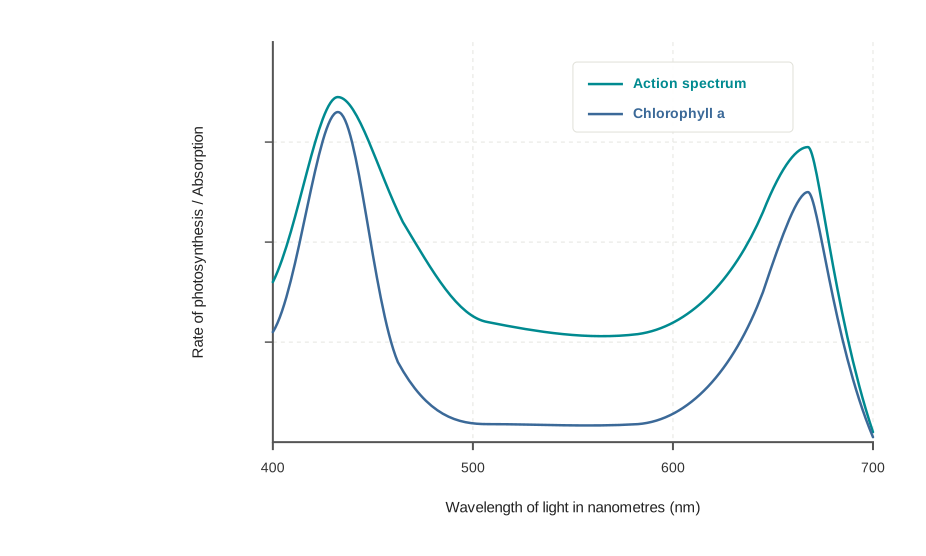
Fig. 11.5c – Action spectrum superimposed on chlorophyll a absorption.
Accessory Pigments and Why They Matter
Together these graphs show that most photosynthesis happens in the blue and red regions, though some occurs at other wavelengths of the visible spectrum too. How can photosynthesis occur at wavelengths chlorophyll a barely absorbs?
The answer lies with the other pigments in the thylakoids. Chlorophyll is the major light-trapping pigment, but chlorophyll b, the xanthophylls and the carotenoids — collectively called accessory pigments — also absorb light and hand the captured energy over to chlorophyll a. They do two valuable jobs. First, they widen the range of wavelengths of incoming light that a plant can put to use, capturing colours chlorophyll a would otherwise miss. Second, they protect chlorophyll a from photo-oxidation — damage caused by excess light energy — by safely absorbing and dissipating some of it.
11.5 What is Light Reaction?
The light reactions — the “photochemical” phase of photosynthesis — are the light-driven events that take place in the thylakoid membranes. Four things happen here: light is absorbed, water is split, oxygen is released, and the high-energy intermediates ATP and NADPH are formed. Several protein complexes work together to make this possible.
Two Photosystems: PS I and PS II
The pigments are not scattered loosely across the membrane. They are organised into two distinct groups called light harvesting complexes (LHC), which lie within two units named Photosystem I (PS I) and Photosystem II (PS II).
Their names carry a small trap. They were numbered in the order in which they were discovered, not in the order in which they act during the light reaction. As we will see shortly, PS II actually works before PS I.
Antenna and Reaction Centre
Each light harvesting complex is built from hundreds of pigment molecules bound to proteins. Together these pigments form a light-gathering system called the antenna. Every photosystem contains all the pigment types — except for one special molecule of chlorophyll a — and the antenna’s task is to absorb many different wavelengths of light, which makes photosynthesis far more efficient, as shown in Fig. 11.6.
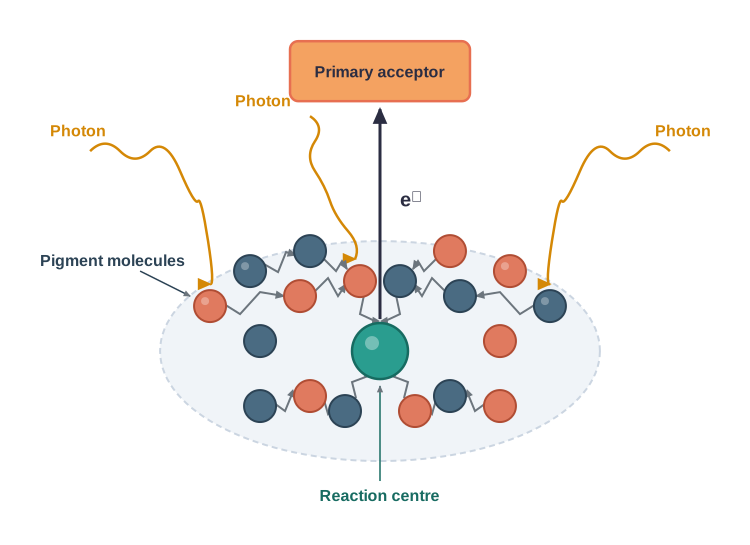
Fig. 11.6 – The light harvesting complex.
That single special chlorophyll a molecule forms the reaction centre — the exact spot where the trapped light energy is finally put to work. The antenna pigments capture light over a wide area and across many colours, then funnel the energy inward to this one reaction centre, as summarised in FC 11.3.
Flowchart
FC 11.3 – Light harvesting: light (photon) absorbed by antenna pigment molecules → energy funnelled inward to the reaction-centre chlorophyll a → reaction-centre electron excited → electron handed on to the primary acceptor.
P700 and P680
The reaction centre is different in the two photosystems, because each uses a chlorophyll a molecule that absorbs light best at a slightly different wavelength. In PS I the reaction-centre chlorophyll a has an absorption peak at 700 nm, so it is called P700. In PS II the reaction-centre chlorophyll a has its absorption maximum at 680 nm, so it is called P680.
11.6 The Electron Transport
Once light has been captured, its trapped energy must be turned into a usable form — and photosynthesis does this by setting electrons in motion. Following the path of these electrons, from PS II through a chain of carriers to PS I and finally onto NADP⁺, is the heart of the light reaction. The whole route is shown in Fig. 11.7 and summarised in FC 11.4.
From PS II into the Electron Transport Chain
In photosystem II, the reaction-centre chlorophyll a (P680) absorbs red light of 680 nm. The energy excites its electrons, boosting them “uphill” into an orbit farther from the nucleus — a higher-energy, less stable state. These excited electrons are at once picked up by an electron acceptor, which passes them on to an electron transport system made of carriers called cytochromes.
To picture what “uphill” and “downhill” mean here, imagine all the carriers arranged on a redox potential scale — a ladder that measures how strongly each carrier holds on to electrons. Light lifts an electron up the ladder; from there the electron slides downhill from one carrier to the next, releasing a little energy at each step. Importantly, the electrons are not used up along the way — they are simply handed on, carrier to carrier, until they reach the pigments of photosystem I.

Fig. 11.7 – The Z scheme of the light reaction.
Flowchart
FC 11.4 – The Z scheme: light → P680 (PS II) excited → primary acceptor → electron transport chain (cytochromes), downhill → PS I → light → P700 (PS I) excited → acceptor of greater redox potential → downhill → NADP⁺ → NADPH + H⁺.
Through PS I to NADPH
Meanwhile, in photosystem I, the reaction-centre chlorophyll a (P700) is also being excited — this time by red light of 700 nm. Its electrons are lifted uphill and passed to another acceptor molecule, one with an even greater redox potential. From there the electrons move downhill once more, this time onto a molecule of energy-rich NADP⁺.
The arrival of these electrons, together with H⁺, reduces NADP⁺ to NADPH + H⁺ — a stable, energy-rich product that the plant will later use to build sugar in the stroma.
Why “Z”?
This entire scheme — starting at PS II, up to an acceptor, down the transport chain to PS I, up again on excitation, across to another acceptor, and finally down to NADP⁺ — is called the Z scheme, named for its characteristic shape.
One question now stands out: if PS II keeps losing electrons to this chain, where does it get replacements? That is exactly what the next part takes up — the splitting of water.
11.6.1 Splitting of Water
If PS II keeps handing electrons to the transport chain, it must somehow get replacements — otherwise it would quickly run empty. How, then, does PS II supply electrons continuously? The answer is the splitting of water.
The splitting of water is associated with PS II. Water is split into protons (2H⁺), oxygen [O], and electrons. The electrons released refill PS II, replacing those it lost. And because PS II, in turn, refills PS I through the electron transport chain, water is ultimately the source that replaces the electrons removed from photosystem I as well. The oxygen produced here is one of the net products of photosynthesis — this is the very step that releases the O₂ we traced back to water in Section 11.2.
The reaction can be written as:
\[2H\_2O \\rightarrow 4H^+ + O\_2 + 4e^-\]
Here, two molecules of water yield four protons (H⁺), one molecule of oxygen (O₂), and four electrons (e⁻) that re-enter the photosystem.
There is an important point about where this happens. The water-splitting complex sits on the inner side of the thylakoid membrane — the side facing the inner space of the thylakoid, which is called the lumen. So the protons and oxygen it produces are released into the lumen, as shown in Fig. 11.8.
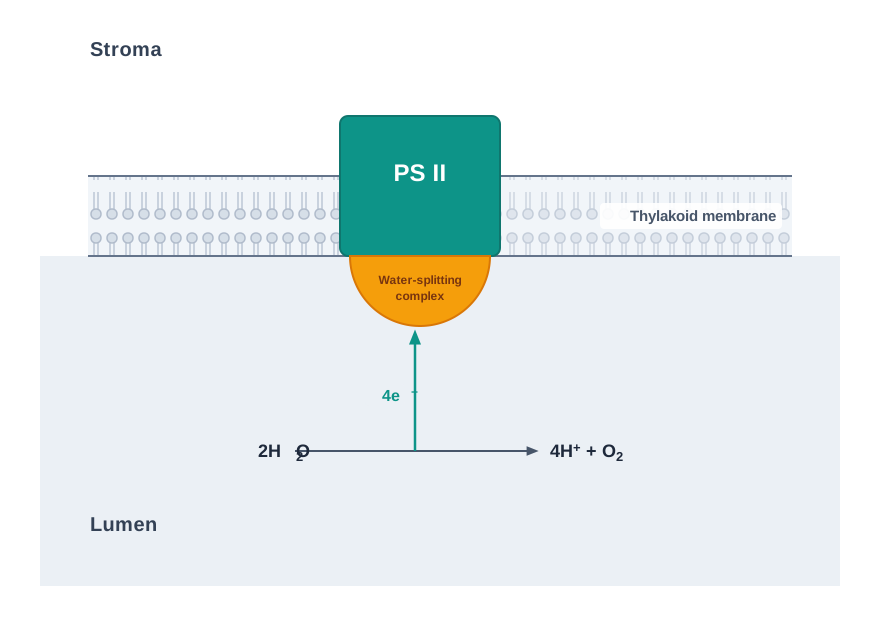
Fig. 11.8 – Location of the water-splitting complex.
11.6.2 Cyclic and Non-cyclic Photophosphorylation
Living organisms are experts at extracting energy from oxidisable substances and storing it as bond energy, and the molecule ATP carries this energy in its chemical bonds. The process by which cells make ATP — in mitochondria and in chloroplasts — is called phosphorylation. When it happens in the chloroplast and is powered by light, it earns a special name: photophosphorylation.
There are two ways this occurs in the light reaction, depending on how the electrons flow.
Non-cyclic Photophosphorylation
When the two photosystems work together in a series — first PS II, then PS I — the process is called non-cyclic photophosphorylation. The two photosystems are connected by the electron transport chain, exactly the arrangement we met as the Z scheme (Fig. 11.7). Because the electrons travel one-way — from water, through both photosystems, to NADP⁺ — this flow produces both ATP and NADPH + H⁺, and, from the water-splitting step, oxygen as well.
Cyclic Photophosphorylation
Sometimes only PS I is at work. Then the excited electron is not sent onward to NADP⁺; instead it is circulated back into the same photosystem, and phosphorylation occurs from this cyclic flow of electrons (Fig. 11.9).
A likely site for this is the stroma lamellae. The membranes of the grana contain both PS I and PS II, but the stroma lamellae membranes lack PS II and also lack the NADP reductase enzyme. Without these, the excited electron cannot be handed to NADP⁺; instead it cycles back to the PS I complex through the electron transport chain. As a result, cyclic flow makes only ATP — no NADPH + H⁺, and no oxygen, since there is no water splitting. Cyclic photophosphorylation also occurs when only light of wavelengths beyond 680 nm is available, because then only PS I (P700) can be excited.
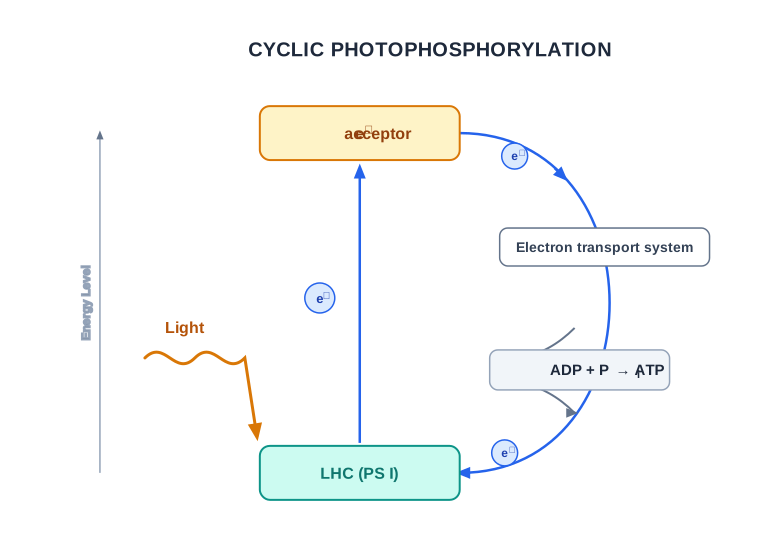
Fig. 11.9 – Cyclic photophosphorylation.
Flowchart
FC 11.5 – Cyclic electron flow: light → P700 (PS I) excited → primary acceptor → electron transport chain (ATP formed here) → back to P700 (cycle repeats). No NADPH and no O₂ are produced.
11.6.3 Chemiosmotic Hypothesis
We have seen that the light reaction makes ATP — but not yet how. The explanation is the chemiosmotic hypothesis. Its central idea is that ATP synthesis is linked to a proton gradient across a membrane. This is the same principle at work in respiration (Chapter 12), with one key difference in where the protons pile up.
In photosynthesis, the membrane involved is the thylakoid membrane, and the protons accumulate towards the inside — in the lumen. In respiration, by contrast, protons accumulate in the intermembrane space of the mitochondria as electrons move through the ETS.
How the Proton Gradient Builds Up
To see what creates the gradient, we look again at the steps of electron activation and transport (Fig. 11.10). Protons collect in the lumen for three reasons.
First, water splitting takes place on the inner side of the membrane, so the protons (H⁺) released when water is split are dumped straight into the lumen.
Second, as electrons move through the photosystems, protons are ferried across the membrane. The primary electron acceptor lies on the outer (stroma) side of the membrane, and it hands its electron not to an ordinary electron carrier but to an “H carrier.” This carrier picks up a proton from the stroma while transporting the electron across the membrane; when it passes the electron to the next carrier on the inner side, it releases that proton into the lumen. So every such trip removes a proton from the stroma and adds one to the lumen.
Third, the NADP reductase enzyme sits on the stroma side of the membrane. Reducing NADP⁺ to NADPH + H⁺ consumes protons, and these protons too are taken from the stroma.
The combined effect is clear: protons in the stroma fall in number while protons in the lumen rise. This builds a proton gradient across the thylakoid membrane, along with a measurable drop in pH inside the lumen (more H⁺ means more acidic).
Flowchart
FC 11.6 – Building and using the proton gradient: (1) water split in lumen → adds H⁺ to lumen; (2) H-carrier ferries H⁺ from stroma → releases it into lumen; (3) NADP reductase uses stroma H⁺ to make NADPH → removes H⁺ from stroma. Result: high H⁺ in lumen, low H⁺ in stroma → gradient → H⁺ flow back through CF₀ of ATP synthase → CF₁ changes shape → ATP synthesised.
How the Gradient Makes ATP
Why care so much about a proton gradient? Because it is the breakdown of this gradient that powers ATP synthesis. Protons cannot leak freely back across the membrane; they can only return to the stroma through a special channel — the CF₀ part of the enzyme ATP synthase.
ATP synthase has two parts. The CF₀ portion is embedded in the thylakoid membrane and forms a transmembrane channel that allows the facilitated diffusion of protons back across the membrane. The CF₁ portion protrudes on the outer surface of the membrane, on the side facing the stroma. As protons rush back through CF₀, down their gradient, the energy released causes a conformational change (a change in shape) in the CF₁ particle, and this shape change makes the enzyme synthesise several molecules of energy-packed ATP.
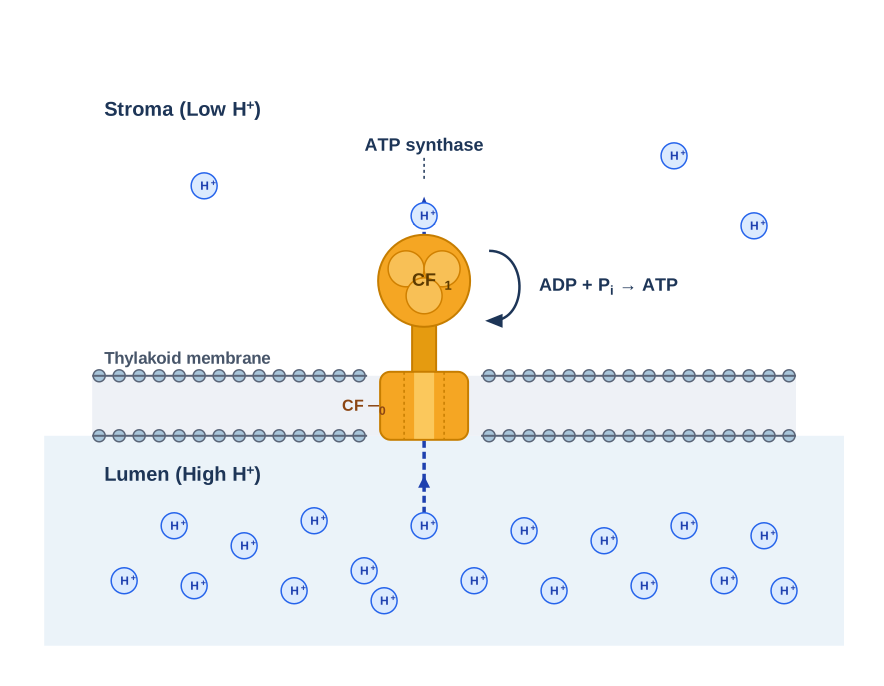
Fig. 11.10 – ATP synthesis through chemiosmosis.
What Chemiosmosis Needs
Notice that the whole scheme needs four things working together.
Energy is used to pump protons across the membrane, creating a high concentration of protons in the thylakoid lumen; ATP synthase then provides a channel through which those protons diffuse back, releasing enough energy to drive the formation of ATP.
Finally, the products come together for the next phase. Along with the NADPH made by the movement of electrons, the ATP made here will be used immediately in the biosynthetic reactions of the stroma — the reactions that fix CO₂ and synthesise sugars, which we turn to next.
11.7 Where are the ATP and NADPH Used?
The Biosynthetic Phase
The light reaction leaves the plant with three products: ATP, NADPH and O₂. The oxygen simply diffuses out of the chloroplast. The ATP and NADPH, however, are put straight to work — they drive the reactions that actually build food, more precisely, sugars. This sugar-building stage is the biosynthetic phase of photosynthesis.
This phase does not depend directly on light. What it does depend on are the products of the light reaction — ATP and NADPH — along with CO₂ and water.
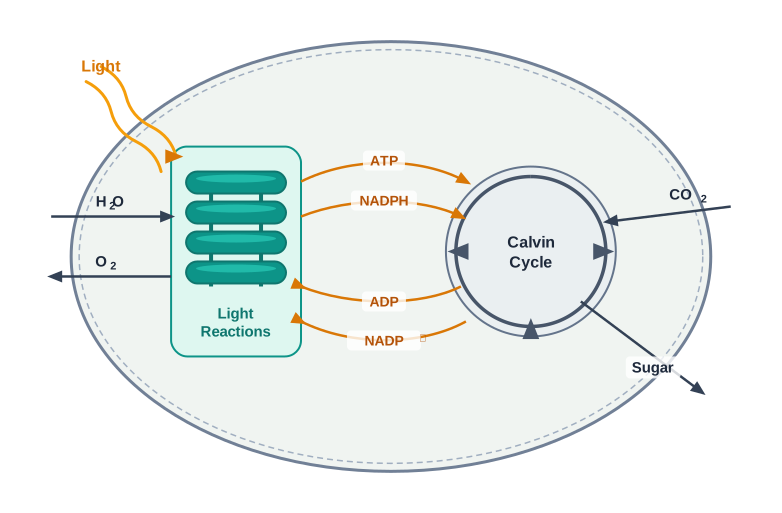
Fig. 11.11 – Linking the light and dark reactions.
Calvin’s Radioactive Clue: PGA
How does CO₂ actually get built into sugar, and what is the very first molecule formed when CO₂ is “fixed”?
So the first detectable product of CO₂ fixation in these plants is PGA — a 3-carbon acid, as its “C₃” label tells you.
Two Types of CO₂ Fixation: C₃ and C₄
Scientists next asked whether every plant makes PGA first, or whether some make something else. Experiments across a wide range of plants uncovered a second group, in which the first stable product of CO₂ fixation was also an organic acid — but one with 4 carbon atoms, identified as oxaloacetic acid (OAA).
This gave two main types of CO₂ assimilation, summarised in FC 11.7. Plants whose first fixation product is the 3-carbon PGA follow the C₃ pathway; plants whose first product is the 4-carbon OAA follow the C₄ pathway. These two groups differ in several other ways too, which we will study later.
Flowchart
FC 11.7 – Two types of CO₂ fixation: CO₂ fixed → if the first stable product is 3-carbon PGA → C₃ pathway; if the first stable product is 4-carbon OAA → C₄ pathway.
Both pathways still rely on the ATP and NADPH from the light reaction — the difference lies only in how CO₂ is first captured. The next parts look inside the C₃ pathway: first the molecule that accepts CO₂, then the full Calvin cycle.
11.7.1 The Primary Acceptor of CO₂
Before CO₂ can become sugar, something must first catch it — a primary acceptor. The scientists working on the dark reaction reasoned about what this acceptor had to be. If fixing one CO₂ gives PGA with its 3 carbons, then surely, they thought, the acceptor should be a 2-carbon molecule (2 + 1 = 3).
That reasonable guess turned out to be wrong. The acceptor is not a 2-carbon molecule at all, but a 5-carbon ketose sugar called ribulose bisphosphate (RuBP).
How can a 5-carbon acceptor lead to a 3-carbon product? RuBP (5-C) combines with one CO₂ (1-C) to give an unstable 6-carbon molecule, which immediately breaks apart into two molecules of 3-carbon PGA. The arithmetic then works out perfectly, as shown in Fig. 11.12.
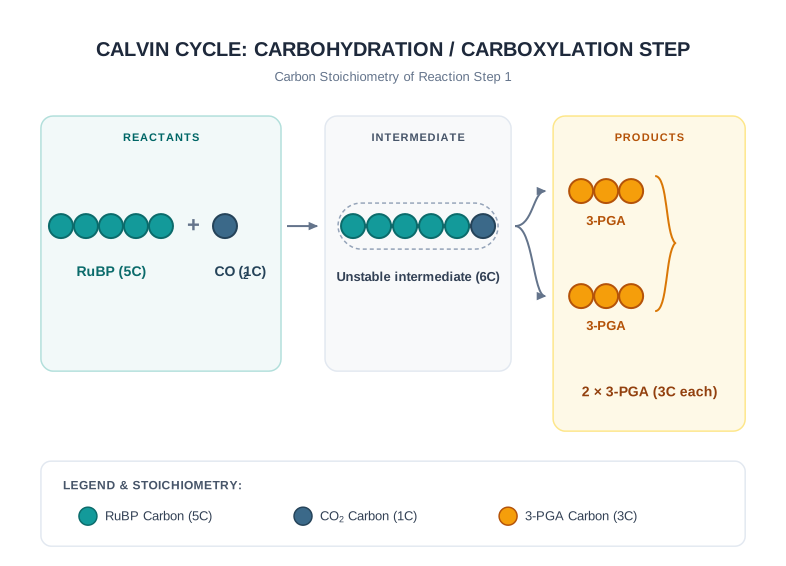
Fig. 11.12 – The carboxylation of RuBP.
11.7.2 The Calvin Cycle
Calvin and his co-workers worked out the whole pathway and showed that it runs in a cyclic manner — the acceptor RuBP is used up and then regenerated, so the cycle can keep turning. Before going further, note one important point: the Calvin pathway occurs in all photosynthetic plants, whether they are C₃, C₄, or any other type (Fig. 11.13).
For ease of understanding, the Calvin cycle is described in three stages: carboxylation, reduction and regeneration. Their sequence is shown in FC 11.8.
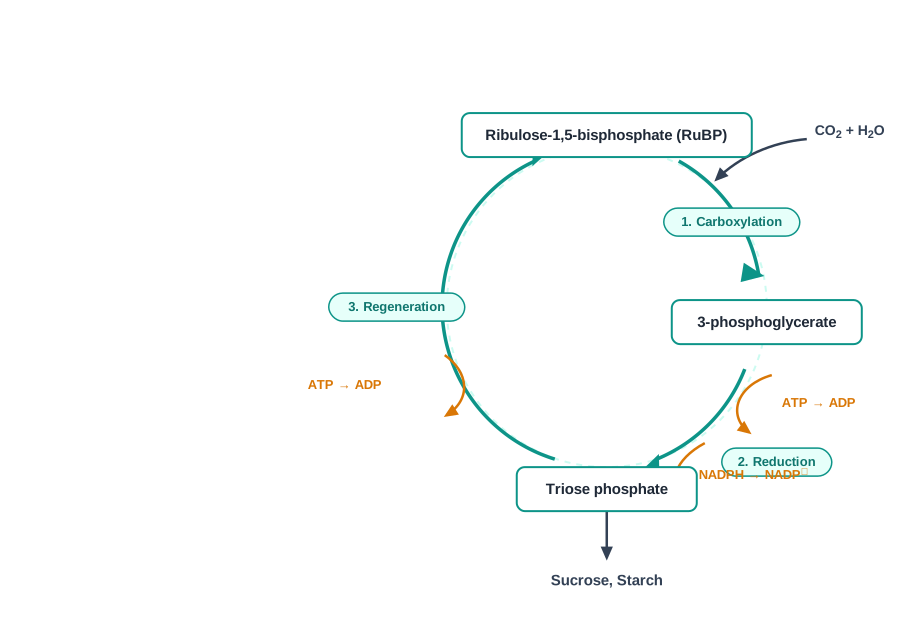
Fig. 11.13 – The Calvin cycle.
Flowchart
FC 11.8 – The Calvin cycle: RuBP (5-C) + CO₂ → (carboxylation by RuBisCO) → 2 × PGA (3-C) → (reduction using ATP + NADPH) → triose phosphate → some triose phosphate leaves to form sugar (glucose → sucrose, starch), the rest → (regeneration using ATP) → RuBP → cycle repeats.
Stage 1: Carboxylation
Carboxylation is the fixation of CO₂ into a stable organic intermediate, and it is the most crucial step of the whole cycle. Here CO₂ is joined to RuBP — the “carboxylation of RuBP” — producing two molecules of 3-PGA.
The reaction is catalysed by the enzyme RuBP carboxylase. Because this same enzyme can also carry out an oxygenation reaction (which will matter later, in photorespiration), its fuller and more correct name is RuBP carboxylase-oxygenase, shortened to RuBisCO.
Stage 2: Reduction
Reduction is a series of reactions leading towards the formation of glucose. For every CO₂ molecule fixed, these steps use 2 molecules of ATP (for phosphorylation) and 2 molecules of NADPH (for reduction). The product is a triose phosphate sugar; some of it is exported to build glucose — and then sucrose and starch — while the rest stays in the cycle. To build one complete molecule of glucose, six molecules of CO₂ must be fixed, which means the cycle must turn six times.
Stage 3: Regeneration
For the cycle to continue uninterrupted, the CO₂ acceptor RuBP must be regenerated. This regeneration uses 1 molecule of ATP (for phosphorylation) per CO₂ fixed, restoring RuBP so it can catch another CO₂.
Counting the Cost
Adding up the two energy-consuming stages: for every CO₂ molecule entering the Calvin cycle, 3 molecules of ATP (2 for reduction + 1 for regeneration) and 2 molecules of NADPH are required. Notice the mismatch — more ATP is needed than NADPH. It is probably to make up this extra ATP that cyclic photophosphorylation (Section 11.6.2) runs alongside.
Since one glucose needs six turns of the cycle, the totals work out as:
| In | Out |
|---|---|
| Six CO₂ | One glucose |
| 18 ATP | 18 ADP |
| 12 NADPH | 12 NADP |
11.8 The C₄ Pathway
Some plants — especially those adapted to dry, tropical regions — fix CO₂ using the C₄ pathway, in which the first product is the 4-carbon acid OAA. Yet even these plants ultimately use the Calvin cycle (the C₃ pathway) to make their sugars. So if they still run the Calvin cycle, in what way are C₄ plants really different from C₃ plants? That is the question this section answers.
What Makes C₄ Plants Special
C₄ plants stand out in five linked ways. They have a special type of leaf anatomy; they tolerate higher temperatures; they respond well to high light intensities; they lack a wasteful process called photorespiration; and they achieve a greater productivity of biomass. We will meet the anatomy and the pathway now, and take up photorespiration and temperature in the sections that follow.
Kranz Anatomy: A Leaf Built Differently
If you cut and compare vertical sections of a C₃ leaf and a C₄ leaf under a microscope, the difference is striking (Fig. 11.14). Around the vascular bundles (the veins) of a C₄ leaf sit unusually large cells called bundle sheath cells. Leaves with this arrangement are said to have Kranz anatomy — ‘Kranz’ means ‘wreath’, describing how these cells wreathe around the vascular bundle.
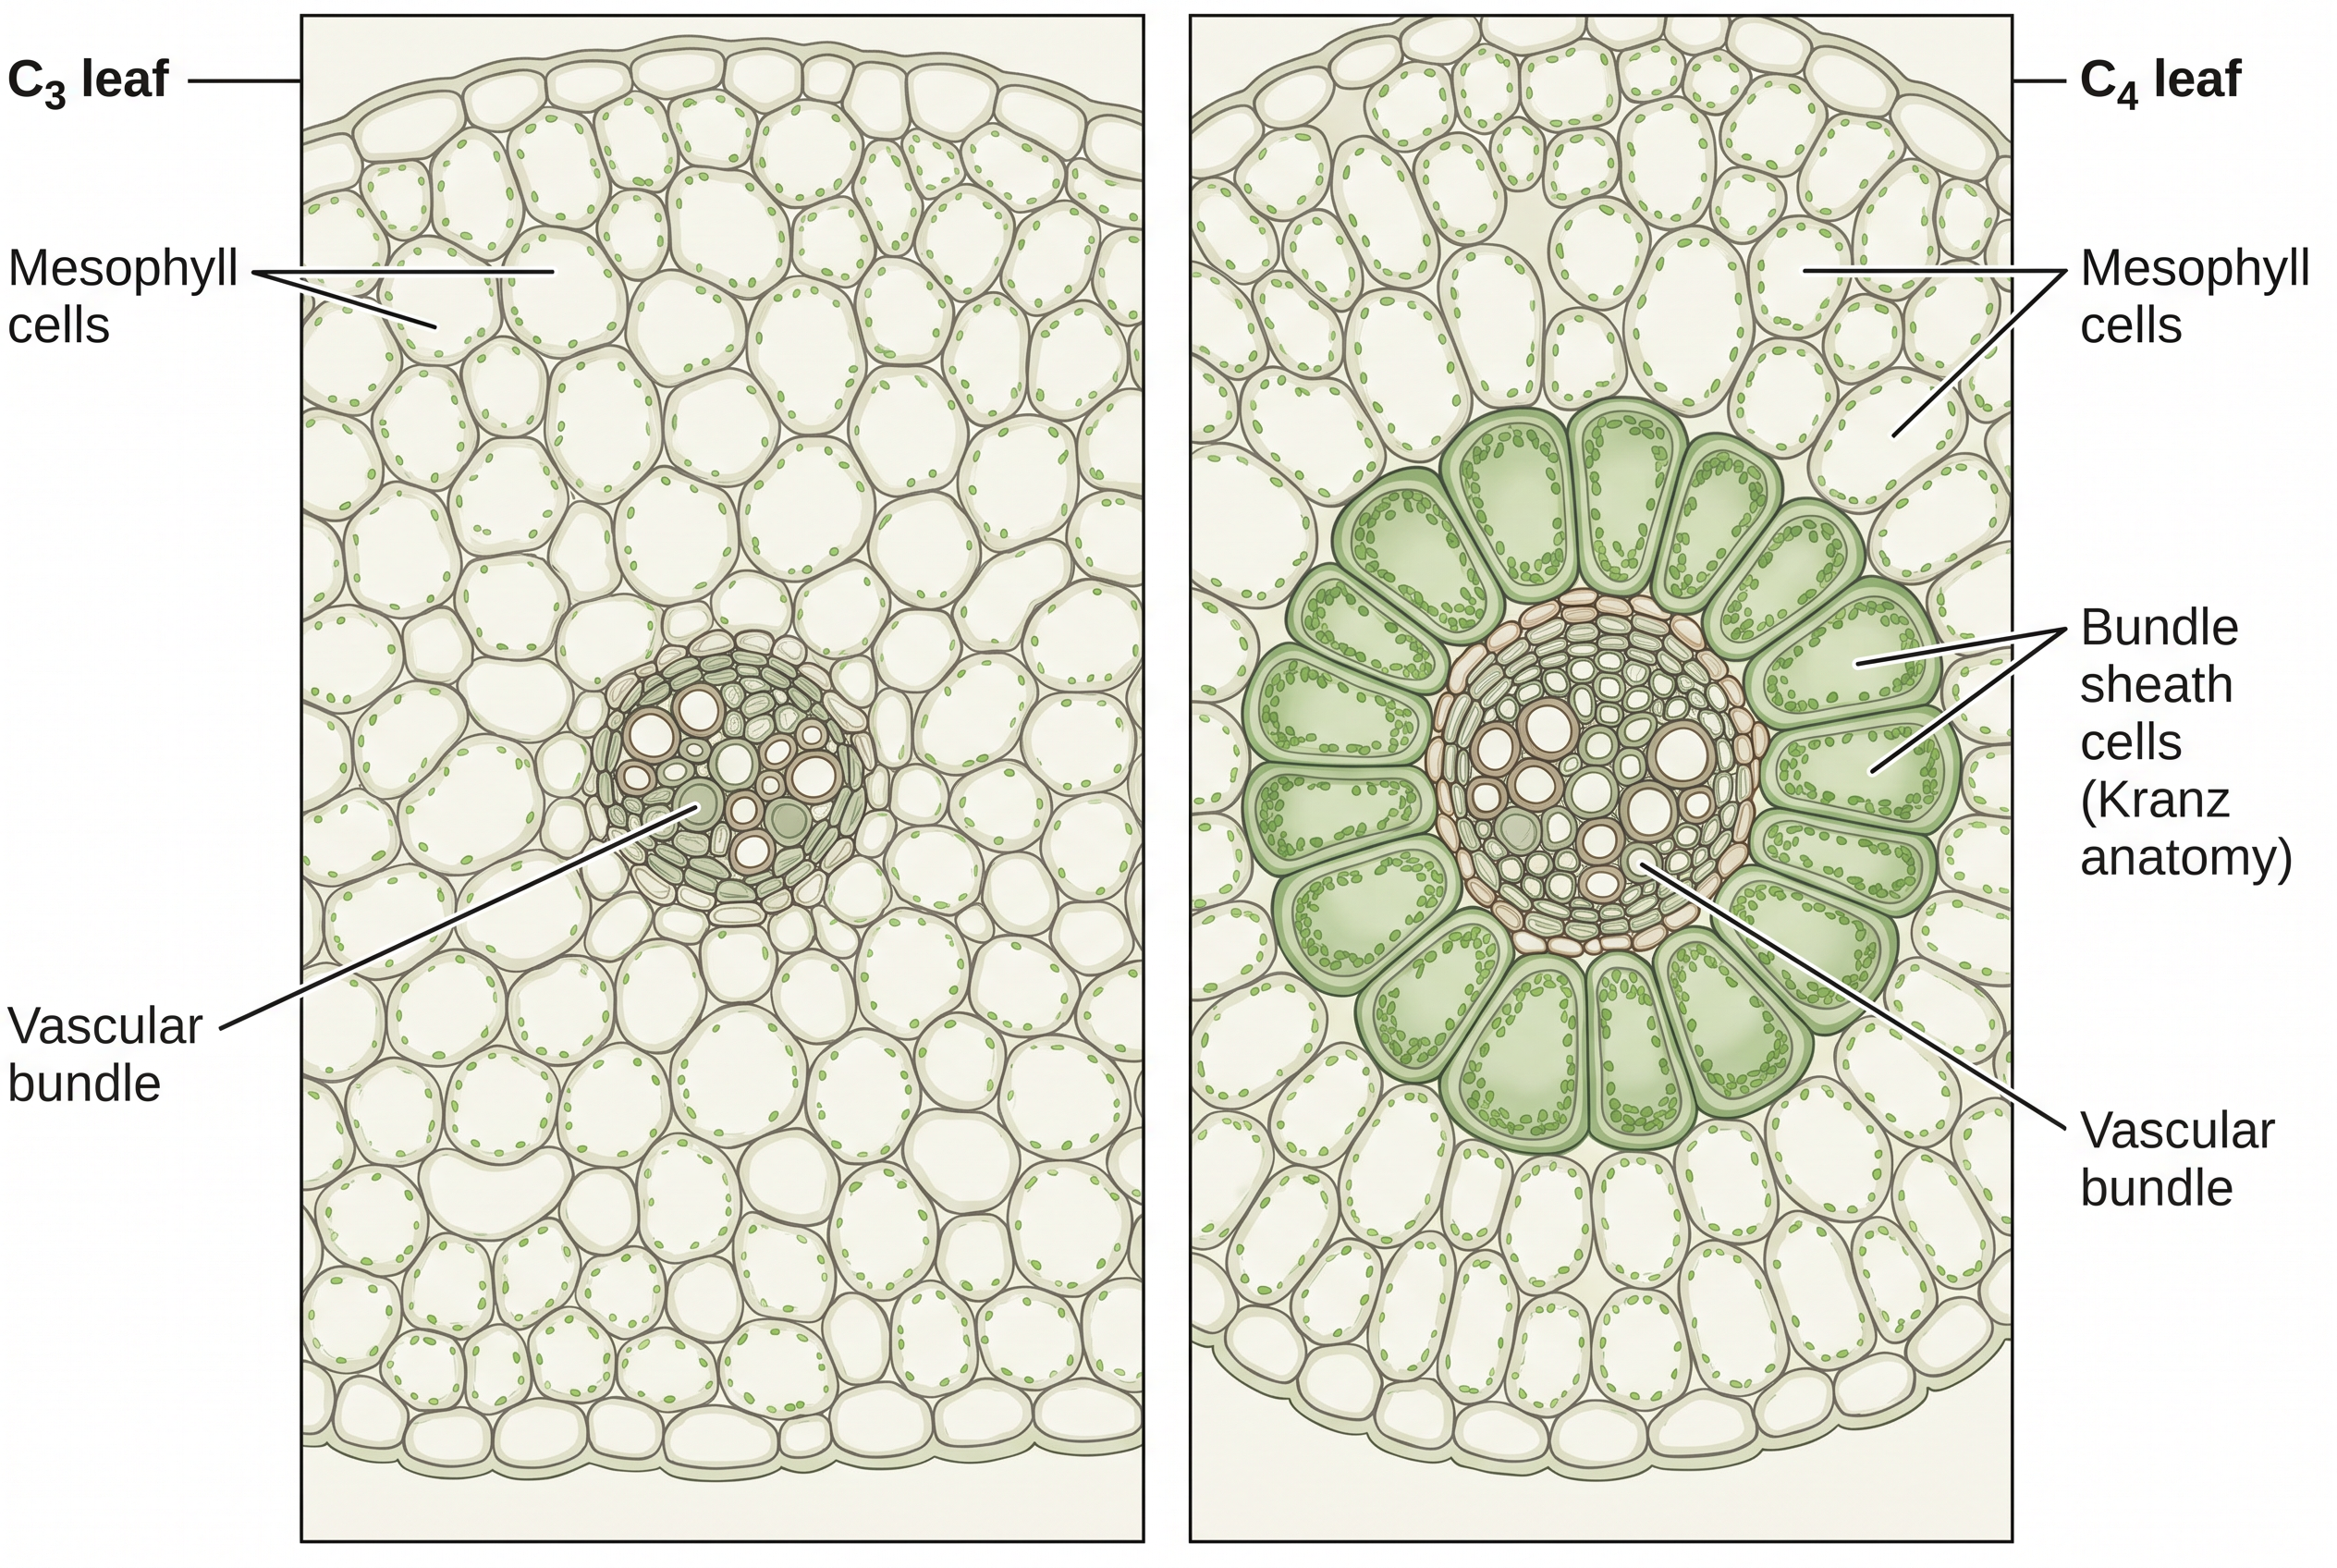
Fig. 11.14 – Cross-sections of C₃ and C₄ leaves.
The bundle sheath cells may form several layers around each vascular bundle. They have three telltale features: a large number of chloroplasts, thick walls that are impervious to gases, and no intercellular spaces between them. The presence of this bundle sheath is exactly what you would look for under the microscope to identify a C₄ plant — maize and sorghum are good specimens to examine.
The Hatch and Slack Pathway
The C₄ route is a cyclic process named the Hatch and Slack Pathway, shown in Fig. 11.15 and summarised in FC 11.9. Let us list its steps.
The primary CO₂ acceptor is a 3-carbon molecule, phosphoenolpyruvate (PEP), present in the mesophyll cells. The enzyme that fixes CO₂ onto PEP is PEP carboxylase (PEPcase). It is important to register that the mesophyll cells of C₄ plants lack RuBisCO. Fixing CO₂ onto PEP forms the 4-carbon acid OAA in the mesophyll cells.
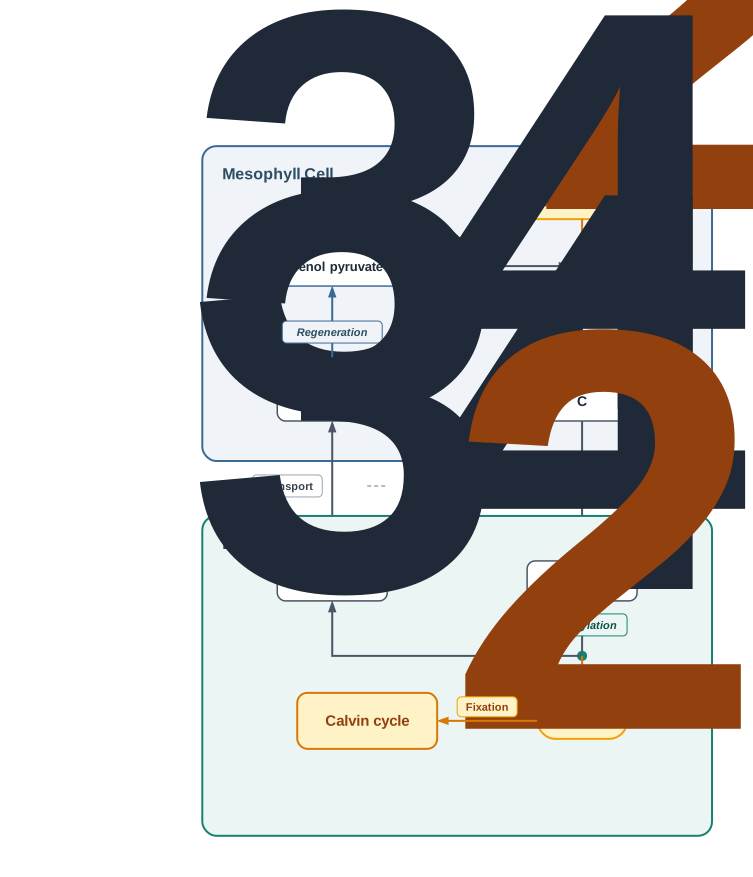
Fig. 11.15 – The Hatch and Slack (C₄) pathway.
The OAA is then converted to other 4-carbon compounds such as malic acid or aspartic acid, still within the mesophyll. These C₄ acids are transported to the bundle sheath cells. There, the C₄ acids are broken down to release CO₂ plus a 3-carbon molecule.
The 3-carbon molecule travels back to the mesophyll, where it is converted to PEP once more — completing the cycle so it can accept another CO₂.
Meanwhile, the CO₂ released inside the bundle sheath cells enters the C₃ (Calvin) pathway, which is common to all plants. This is why the bundle sheath cells are rich in RuBisCO — the enzyme that runs the Calvin cycle — while lacking PEPcase.
Flowchart
FC 11.9 – C₄ (Hatch–Slack) pathway: MESOPHYLL: CO₂ + PEP (3-C) → (PEP carboxylase) → OAA (4-C) → malic/aspartic acid (4-C) → transported to BUNDLE SHEATH → broken down → CO₂ + 3-C molecule; CO₂ → Calvin cycle (RuBisCO) → sugar; the 3-C molecule → back to mesophyll → regenerates PEP → cycle repeats.
Two Cell Types, Two Enzymes
So the labour is divided between two kinds of cells. Notice where the Calvin cycle actually runs: in C₃ plants it operates in all the mesophyll cells, but in C₄ plants it does not run in the mesophyll at all — it runs only in the bundle sheath cells. The Calvin (C₃) pathway that finally makes the sugars is therefore common to both C₃ and C₄ plants; only the “delivery system” for CO₂ differs.
11.9 Photorespiration
Photorespiration is one more process that sets C₃ and C₄ plants apart — and to understand it we must look again at the very first step of the Calvin cycle: the fixation of CO₂ onto RuBP, catalysed by RuBisCO, forming two molecules of 3-PGA.
\[RuBP + CO\_2 \\xrightarrow{\\text{RuBisCO}} 2 \\times 3PGA\]
RuBisCO’s Two Faces
RuBisCO is the most abundant enzyme in the world, and it has a peculiar feature: its active site can bind not only CO₂ but also O₂ — which is exactly why its full name includes “oxygenase.” The two gases compete for the same site, so it is the relative concentration of O₂ and CO₂ that decides which one binds. Helpfully, RuBisCO has a much greater affinity for CO₂ when the CO₂ : O₂ ratio is close to equal.
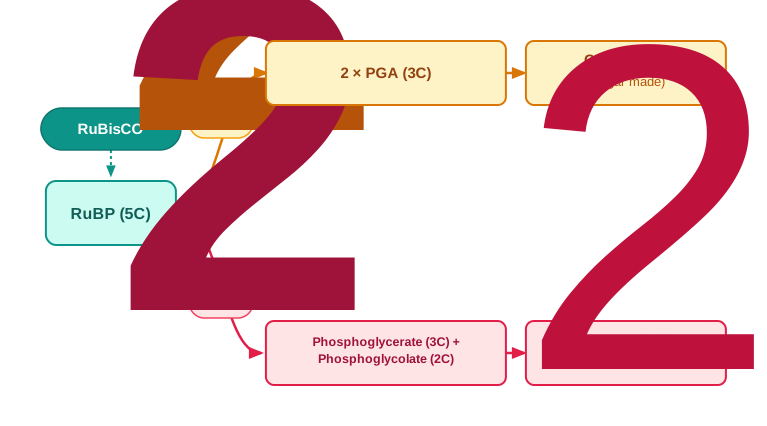
Fig. 11.16 – Carboxylation vs oxygenation by RuBisCO.
What Happens in Photorespiration
In C₃ plants, some O₂ inevitably binds to RuBisCO, and when it does, CO₂ fixation drops. Instead of RuBP being converted to two molecules of PGA, it combines with O₂ to form one molecule of phosphoglycerate (3-carbon) and one molecule of phosphoglycolate (2-carbon). This pathway is called photorespiration.
Photorespiration is wasteful. In this pathway there is no synthesis of sugars, and no synthesis of ATP or NADPH. Worse, it actually releases CO₂ while consuming ATP. As of now, the biological function of photorespiration is not known.
Flowchart
FC 11.10 – The fate of RuBP depends on what binds RuBisCO: RuBP → if CO₂ binds → 2 PGA → Calvin cycle → sugar (useful); if O₂ binds → phosphoglycerate (3-C) + phosphoglycolate (2-C) → photorespiration → CO₂ released, ATP used up, no sugar/ATP/NADPH made (wasteful).
Why C₄ Plants Escape Photorespiration
C₄ plants avoid photorespiration almost entirely, and the reason is the CO₂-concentrating mechanism we met in Section 11.8. When the C₄ acid arriving from the mesophyll is broken down inside the bundle sheath cells, it releases CO₂ right where RuBisCO is — pushing the local CO₂ concentration very high. With so much CO₂ around, RuBisCO works as a carboxylase, and its oxygenase (photorespiratory) activity is minimised.
This single advantage explains a lot. Because C₄ plants lose little or no carbon to photorespiration, their productivity and yields are higher, and they also tolerate higher temperatures — conditions under which C₃ plants would photorespire heavily.
Comparing C₃ and C₄ Plants
Pulling the last few sections together, we can lay the two groups side by side.
11.10 Factors affecting Photosynthesis
The rate of photosynthesis matters a great deal, because it largely decides the yield of plants — including the crop plants we depend on for food. That rate is shaped by many factors, which fall into two groups: internal (belonging to the plant) and external (belonging to the environment).
Internal and External Factors
The internal, or plant, factors include the number, size, age and orientation of the leaves, the mesophyll cells and chloroplasts, the internal CO₂ concentration, and the amount of chlorophyll. These are set by the plant’s genetic make-up and by how it has grown.
The external factors are the availability of sunlight, the temperature, the CO₂ concentration, and water.
Blackman’s Law of Limiting Factors
As a plant photosynthesises, all these factors act on its rate at the same time. Yet even though many factors interact simultaneously, usually one of them is the main brake — the one in shortest supply. At any given moment, the rate is set by whichever factor is at a sub-optimal (too-low) level.
This idea was captured long ago by Blackman in 1905.
For example, a leaf may have plenty of light and CO₂, and be perfectly green, yet fail to photosynthesise if the temperature is very low. Here temperature is the limiting factor: give the same leaf its optimal temperature, and it will start photosynthesising at once.
The next four parts examine the main external factors one at a time — light, CO₂, temperature and water.
11.10.1 Light
When we talk about light as a factor, we must separate three things: light quality (its colour or wavelength), light intensity (its brightness), and the duration of exposure (how long the light lasts). Each affects photosynthesis in its own way.
Consider light intensity. At low intensities, there is a linear relationship between incident light and the rate of CO₂ fixation — brighten the light, and the rate rises in step. But at higher intensities the rate levels off and stops increasing, because now some other factor has become limiting (Fig. 11.17). This flattening is called light saturation.
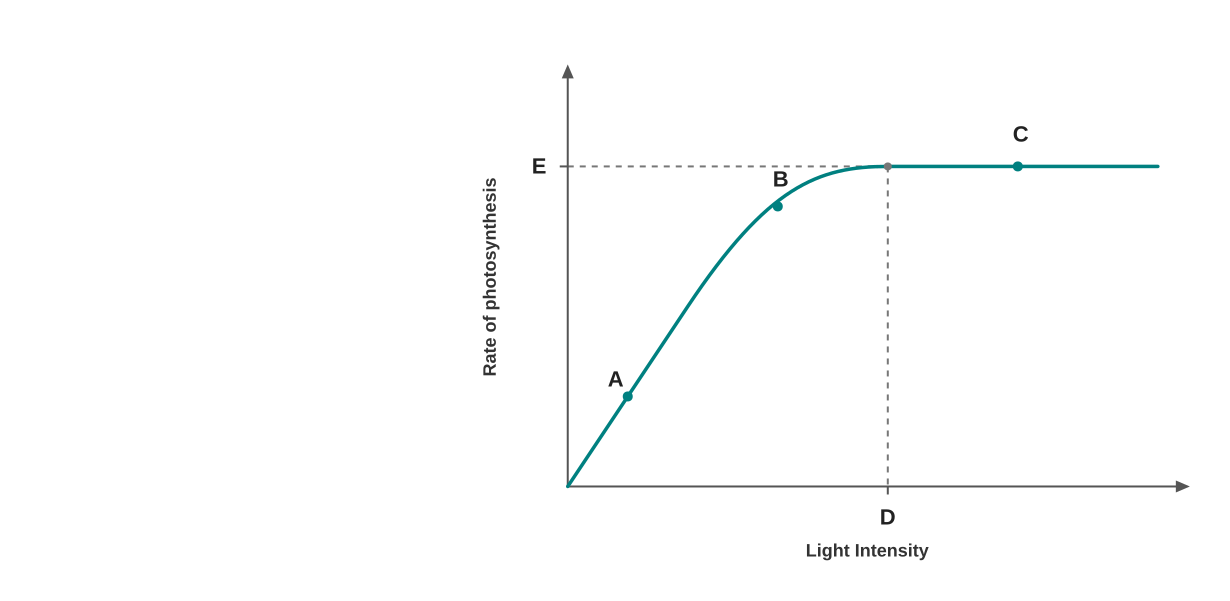
Fig. 11.17 – Rate of photosynthesis versus light intensity.
A striking fact: light saturation is reached at only about 10 per cent of full sunlight. This is why, except for plants growing in shade or in dense forests, light is rarely the limiting factor in nature.
There is also a limit to “more is better.” Increasing incident light beyond a certain point causes the breakdown of chlorophyll, and photosynthesis actually decreases.
11.10.2 Carbon dioxide Concentration
Carbon dioxide is the major limiting factor for photosynthesis. In the atmosphere, CO₂ is present at a very low concentration — between 0.03 and 0.04 per cent. Raising the concentration up to about 0.05 per cent can increase the rate of CO₂ fixation, but beyond this level, prolonged exposure can actually become damaging to the plant.
C₃ and C₄ Respond Differently
C₃ and C₄ plants react to CO₂ in different ways, and the effect also depends on light. At low light, neither group responds to raised CO₂ (light is limiting them instead). At high light intensities, both groups speed up — but they saturate at different CO₂ levels.
Here the units are µL L⁻¹ (microlitres of CO₂ per litre of air, essentially parts per million). C₄ plants reach saturation at about 360 µL L⁻¹, meaning they cannot go much faster even if more CO₂ is added. C₃ plants, however, keep responding to higher CO₂, saturating only beyond 450 µL L⁻¹. So at the CO₂ levels currently available in the atmosphere, CO₂ is limiting for C₃ plants but not really for C₄ plants.
11.10.3 Temperature
Temperature affects the two phases of photosynthesis unequally. The dark reactions are enzyme-driven, and because enzyme activity is strongly temperature-dependent, the dark reactions are largely temperature-controlled. The light reactions are also somewhat temperature-sensitive, but they are affected to a much lesser extent.
Different plant groups have different temperature optima. C₄ plants respond well to higher temperatures and photosynthesise faster in the heat, whereas C₃ plants have a much lower temperature optimum.
The optimum temperature for photosynthesis also depends on the habitat a plant is adapted to. Plants of tropical regions have a higher temperature optimum than plants adapted to cooler, temperate climates.
11.10.4 Water
Water is one of the reactants in the light reaction, so we might expect it to affect photosynthesis directly. In fact, its main influence is indirect — acting on the plant as a whole rather than on the photosynthetic reactions themselves.
When a plant faces water stress (too little water), two things follow. First, the stomata — the tiny pores through which gases enter and leave the leaf — close to conserve water. Closed stomata let in less CO₂, so the CO₂ supply for photosynthesis falls. Second, water stress makes the leaves wilt, reducing their surface area and lowering their metabolic activity. Both effects slow photosynthesis.
Flowchart
FC 11.11 – How water stress lowers photosynthesis: water stress → (1) stomata close → less CO₂ enters the leaf → lower photosynthesis; and (2) leaves wilt → reduced leaf surface area + reduced metabolic activity → lower photosynthesis.
11.11 Summary
Green plants make their own food by photosynthesis. The chapter’s key points, in brief:
- Green plants are autotrophs: they build food — carbohydrates, mainly glucose and starch — from CO₂, water and light.
- CO₂ from the atmosphere enters the leaf through stomata, and photosynthesis occurs only in the green parts, chiefly the leaves.
- Inside the leaf, mesophyll cells hold large numbers of chloroplasts, which carry out CO₂ fixation.
- Within a chloroplast, the membranes (grana and stroma lamellae) are the sites of the light reaction, while the stroma is where the biosynthetic (carbon-fixing) reactions take place.
- Photosynthesis has two stages: the light reaction and the carbon-fixing reactions.
- In the light reaction, light energy is absorbed by the antenna pigments and funnelled to the special chlorophyll a molecules of the reaction centre.
- There are two photosystems: PS I, whose reaction centre P700 absorbs at 700 nm, and PS II, whose reaction centre P680 absorbs red light at 680 nm.
- Excited electrons travel through PS II and PS I and are finally passed to NADP⁺, forming NADPH.
- The splitting of water is associated with PS II, releasing O₂ and protons and supplying the electrons that replace those lost.
- Electron flow builds a proton gradient across the thylakoid membrane; the breakdown of this gradient, as protons move back through the CF₀ part of ATP synthase, releases enough energy to make ATP.
- In the carbon-fixing (Calvin) cycle, the enzyme RuBisCO adds CO₂ to the 5-carbon RuBP, which is converted to two molecules of 3-carbon PGA.
- PGA is then converted to sugar through the Calvin cycle, and RuBP is regenerated — using the ATP and NADPH made in the light reaction.
- In C₃ plants, RuBisCO also catalyses a wasteful oxygenation reaction: photorespiration.
- Some tropical plants use a special C₄ pathway, in which the first product of CO₂ fixation (formed in the mesophyll) is a 4-carbon compound; the Calvin pathway is then carried out in the bundle sheath cells to synthesise carbohydrates.
The whole process is condensed in FC 11.12.
Flowchart
FC 11.12 – Overview of photosynthesis. LIGHT REACTION (thylakoid): light → antenna pigments → reaction centres (PS II P680, PS I P700) → electrons excited → electron transport chain → NADP⁺ → NADPH; water split at PS II → O₂ + H⁺ + e⁻; proton gradient → ATP synthase (CF₀–CF₁) → ATP. → CARBON FIXATION (stroma): ATP + NADPH used; CO₂ + RuBP → (RuBisCO) → 2 PGA → sugar → glucose/starch; RuBP regenerated → cycle continues.
11.12 Points to Ponder
- Van Helmont concluded that a plant is built almost entirely from water. Given what you now know, which part of his conclusion was right, and which single ingredient did his experiment fail to account for — and why was that ingredient so easy to overlook?
- RuBisCO is the most abundant enzyme on Earth, yet it “wastefully” binds oxygen as well as carbon dioxide. If this trait is so costly, why might such an imperfect enzyme have persisted through evolution? Think about the kind of atmosphere in which it first appeared.
- The dark reactions are called “dark,” yet they stop soon after light is switched off. If you were renaming this phase for a textbook, what name would you choose, and what would your name capture that “dark reaction” misses?
- C₄ plants spend extra ATP running their CO₂-concentrating pump, yet they are often more productive than C₃ plants. Under what climatic conditions would this extra cost be worth paying — and under what conditions might a C₃ plant actually do better?
- Blackman’s Law says that, at any moment, a single factor limits the rate of photosynthesis. If a grower keeps adding more and more of just one factor — say, CO₂ — what would you expect to happen to the rate over time, and how might the “limiting factor” keep changing hands?
- The oxygen you breathe was released from the splitting of water, not from carbon dioxide. Imagine following a single oxygen atom from a water molecule inside a leaf all the way to the air in your lungs. What steps would it have to pass through along the way?
- Both cyclic and non-cyclic photophosphorylation make ATP, but only one also makes NADPH. Why might a cell find it useful to have two separate ways of making ATP, rather than relying on a single pathway?
11.13 NCERT Questions
- By looking at a plant externally, can you tell whether it is a C₃ or a C₄ plant? Why, and how?
- By looking at which internal structure of a plant can you tell whether it is a C₃ or a C₄ plant? Explain.
- Even though only a very few cells in a C₄ plant carry out the biosynthetic (Calvin) pathway, these plants are still highly productive. Can you discuss why?
- RuBisCO is an enzyme that acts both as a carboxylase and as an oxygenase. Why do you think RuBisCO carries out more carboxylation in C₄ plants?
- Suppose there were plants that had a high concentration of chlorophyll b but lacked chlorophyll a — would they carry out photosynthesis? Then why do plants have chlorophyll b and other accessory pigments?
- Why does the colour of a leaf kept in the dark frequently become yellow, or pale green? Which pigment do you think is more stable?
- Look at the leaves of the same plant on the shady side and compare them with the leaves on the sunny side (or compare potted plants kept in sunlight with those kept in shade). Which of them has leaves that are darker green? Why?
- Figure 11.17 shows the effect of light on the rate of photosynthesis. Based on the graph, answer the following:
- At which point(s) — A, B or C — in the curve is light a limiting factor?
- What could be the limiting factor(s) in region A?
- What do C and D represent on the curve?
- Give a comparison between the following:
- C₃ and C₄ pathways
- Cyclic and non-cyclic photophosphorylation
- Anatomy of the leaf in C₃ and C₄ plants
11.14 Check Your Concepts
- Assertion (A): The oxygen released during photosynthesis comes from water, not from carbon dioxide. Reason (R): In green plants, water acts as the hydrogen donor and is oxidised. — Are both statements true, and does R correctly explain A?
- Assertion (A): During the light reaction, PS II functions before PS I. Reason (R): The two photosystems were numbered in the order of their discovery, not the order in which they act. — State whether both statements are true and whether R correctly explains A.
- Why is calling the biosynthetic phase the “dark reaction” considered a misnomer? Give two reasons.
- The primary CO₂ acceptor is a 5-carbon molecule, yet the first stable product of fixation has only 3 carbons. Using a carbon count, explain how this is possible.
- What would happen to the supply of electrons in the light reaction if the water-splitting complex stopped working? Trace the consequences through the Z scheme.
- Match each scientist with their contribution:
| Scientist | Contribution |
|---|---|
| a. Priestley | i. O₂ of photosynthesis comes from water, not CO₂ |
| b. Ingenhousz | ii. Plants restore air fouled by candles and animals |
| c. Engelmann | iii. Described the first action spectrum of photosynthesis |
| d. van Niel | iv. Mapped the path of carbon fixation (Calvin cycle) |
| e. Calvin | v. Sunlight is essential; only green parts release O₂ |
- Match each pigment with its colour in a chromatogram:
| Pigment | Colour in chromatogram |
|---|---|
| a. Chlorophyll a | i. Yellow |
| b. Chlorophyll b | ii. Yellow to yellow-orange |
| c. Xanthophylls | iii. Bright / blue-green |
| d. Carotenoids | iv. Yellow-green |
- Arrange the three stages of the Calvin cycle in their correct order: reduction, regeneration, carboxylation. Then state which stage fixes CO₂ and which regenerates RuBP.
- Arrange the following in the sequence that an electron follows during non-cyclic flow: NADP⁺, P680, primary acceptor of PS I, electron transport chain (cytochromes), P700, water.
- What happens to the rate of photorespiration in a C₃ plant when its stomata close on a hot, dry afternoon? Explain your answer in terms of the O₂ : CO₂ ratio at RuBisCO.
- Redraw the outline of a chloroplast (as in Fig. 11.4) and label the following: outer membrane, inner membrane, grana, stroma lamella, stroma, and starch granule. Beside “grana” and “stroma”, note which set of reactions occurs at each.
- “Cyclic photophosphorylation produces only ATP.” Explain why no NADPH and no O₂ are formed in this pathway.
- Distinguish between an absorption spectrum and an action spectrum. Why do the two not overlap perfectly for chlorophyll a?
- In the chemiosmotic mechanism, name the three processes that raise the proton concentration inside the thylakoid lumen. On which side of the membrane does the CF₁ head of ATP synthase face?
- Where do protons accumulate during ATP synthesis in a chloroplast, and where do they accumulate in a mitochondrion? What single principle is common to both?
- Assertion (A): C₄ plants show little or no photorespiration. Reason (R): The bundle sheath cells of C₄ plants keep the CO₂ concentration around RuBisCO high. — Are both statements true, and does R correctly explain A?
11.15 Practice With Numericals
- Using Calvin cycle stoichiometry, how many molecules of ATP and NADPH are required to synthesise 5 molecules of glucose?
- A chloroplast fixes 24 molecules of CO₂ through the Calvin cycle. (a) How many turns of the cycle does this represent? (b) How many molecules of glucose can be formed? (c) How many molecules of ATP and NADPH are consumed?
- A leaf cell has 90 molecules of ATP and 70 molecules of NADPH available for the Calvin cycle, with no other limitation. (a) How many molecules of CO₂ can be fixed before one of these is exhausted? (b) Which one runs out first?
- The Calvin cycle requires 3 ATP and 2 NADPH per CO₂ fixed. (a) Write the ATP : NADPH requirement in its simplest ratio. (b) Given that 6 turns of the cycle build one molecule of glucose, verify that the totals come to 18 ATP and 12 NADPH.
- A plant needs to synthesise 2 molecules of glucose. Calculate (a) the number of CO₂ molecules fixed, (b) the number of turns of the Calvin cycle, and (c) the total ATP and NADPH consumed.