Chapter 2: The World Population: Distribution, Density And Growth
Look at a photograph of the Earth taken at night from space. The planet is not evenly lit. Great sweeps of light pick out some places, while enormous stretches stay almost black. The lit patches trace the river valleys and the flat, watered plains. The dark stretches are the high mountains, the great deserts and the coldest lands, where few people have ever chosen to settle.
That single image carries the central fact of this chapter. Human beings are spread across the Earth’s surface very unevenly. Most of us are crowded onto a small share of the land, while much of the planet is left almost empty. The lights are not scattered by chance. Each cluster sits where water was easy, the ground was level, the climate was kind or work was to be had.
But a photograph freezes one instant. The pattern is not still. In some of the bright clusters, families are shrinking and the population is barely rising. In others, it is climbing fast. Where a society sits on that path — from many births and many deaths to few of each — decides whether its lights will spread further or hold steady.
This chapter reads both the map and the movement behind it.
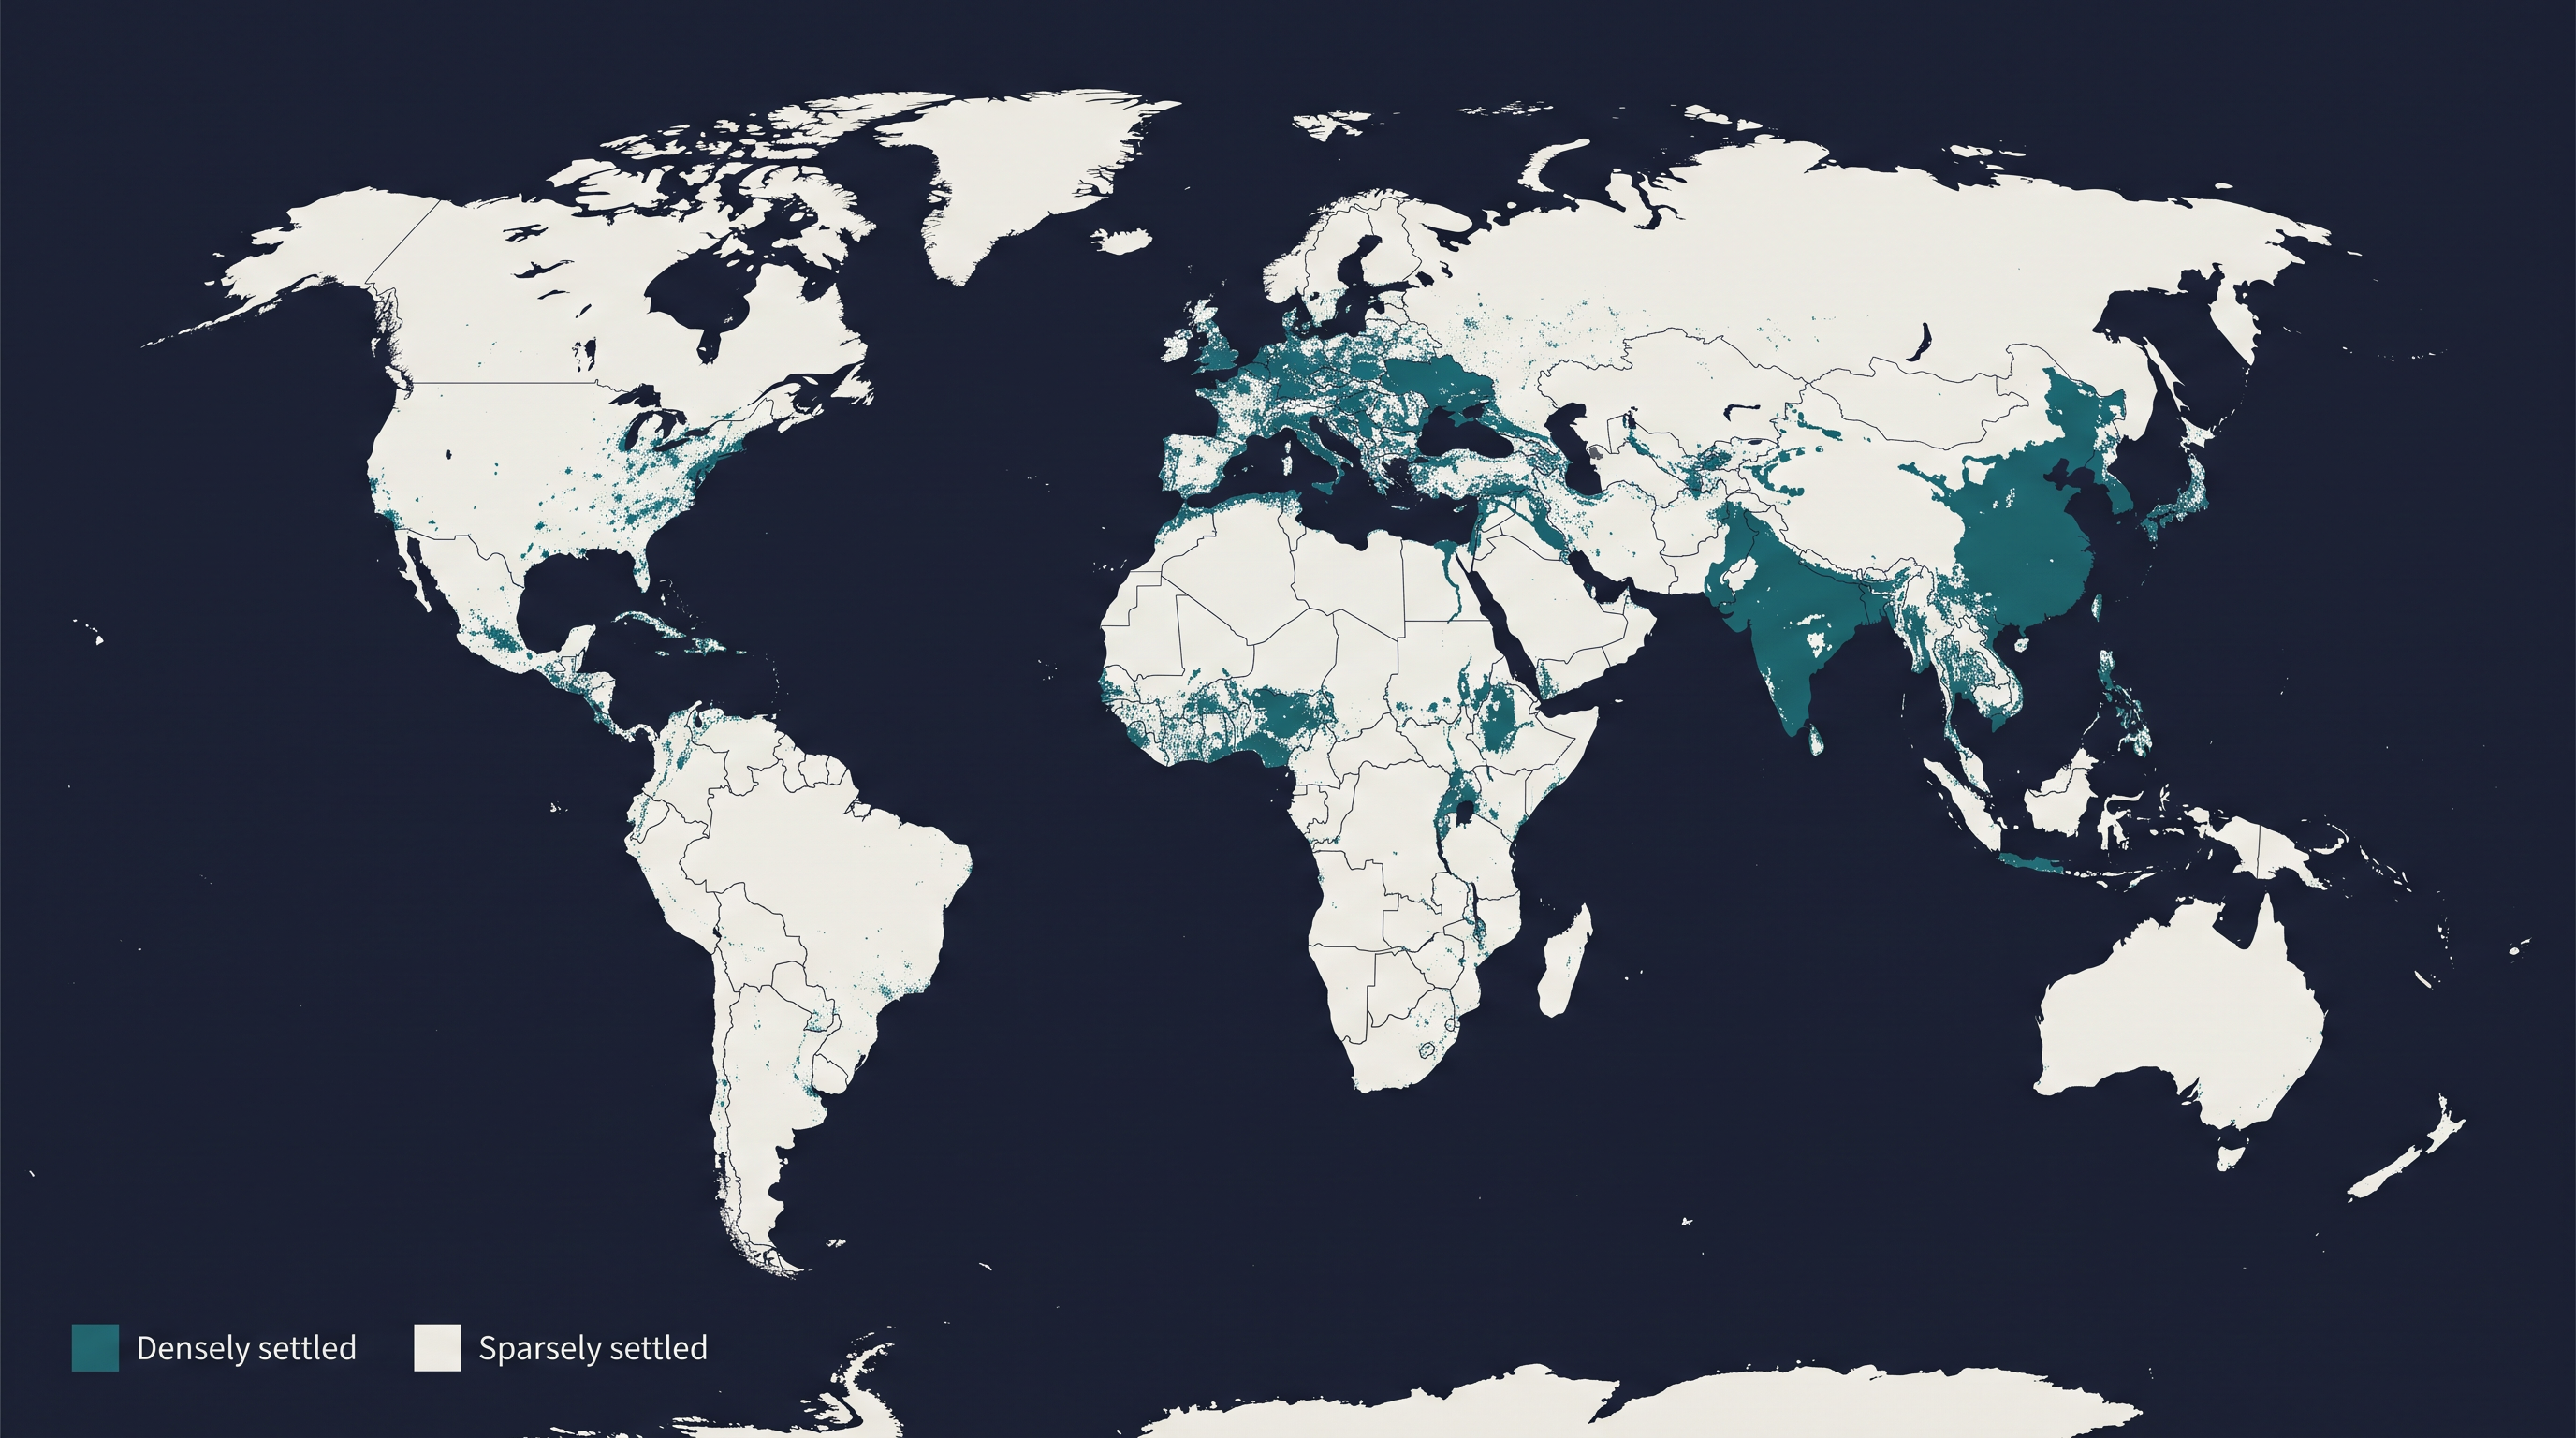
Fig. 2.0 – World population distribution.
2.1 Patterns Of Population Distribution In The World
The people of a country are its real wealth. They are the resource that puts every other resource to use — the land, the water, the minerals — and they decide how the country is run. In the end, a country is known by its people.
To understand a population, we begin with a few plain questions about it. How many women and men does a country have? How many children are born each year, and how many people die? Do people live in cities or in villages, can they read and write, and what work do they do? These questions run through the whole of this chapter.
At the beginning of the twenty-first century, the world already held more than 6 billion people — that is, more than six thousand million. But those billions are not spread evenly across the globe.
Population distribution is the way people are spaced out over the Earth’s surface. Together with density — how tightly they are packed, which the next section pins down as a number — it gives us the first picture of any region’s demographic character.
The geographer George B. Cressey once observed that Asia has many places where people are few and a few places where people are very many. The same holds for the world as a whole: the spread is strikingly uneven, and that unevenness is the pattern this section sets out to describe.
The Uneven Spread
Just how uneven is it? About 90 per cent of the world’s population live on roughly 10 per cent of its land area. Nine of every ten human beings are gathered onto a small fraction of the surface, while the rest of the planet lies thinly settled or all but empty.
The same lopsidedness shows up among countries. The ten most populous countries together hold about 60 per cent of the world’s population, and six of those ten lie in Asia. Look at Fig. 2.1, read off the longest bars, and pick out the six Asian countries among the ten.
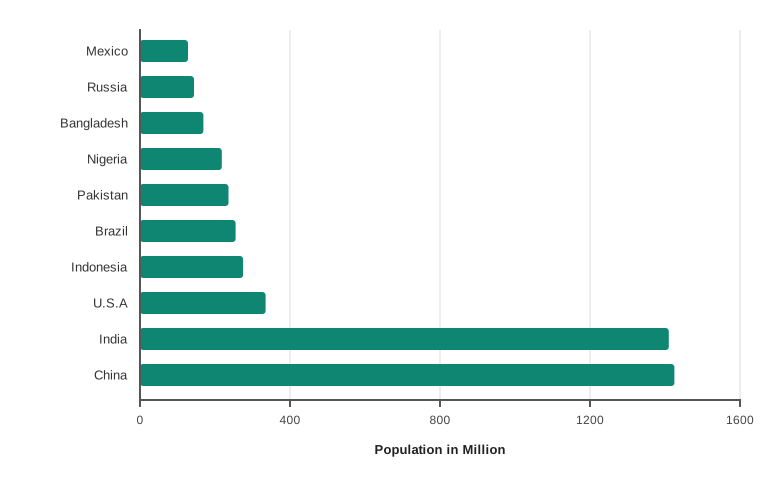
Fig. 2.1 – The ten most populous countries.
2.2 Density Of Population
Every piece of land can support only so many people. Its soil, water and space set a limit, so it makes sense to compare the number of people living on a piece of land with the size of that land. That comparison is what density measures.
Density of population is the ratio between the number of people and the area of land they occupy. It is usually measured in persons per square kilometre — that is, the number of people sharing each square kilometre of ground. A square kilometre is a patch of land one kilometre long on each side.
Working Out A Density
The density of any region is found with a single formula:
\[\text{Density of population} = \frac{\text{Total population}}{\text{Total area}} \quad (\text{persons per km}^2)\]
Here the total population is simply the number of people in the region, and the total area is the land they live on, measured in square kilometres. Divide the first by the second and the answer comes out in persons per square kilometre.
Take a worked example. Suppose a region — call it Region X — covers 100 square kilometres and holds 1,50,000 people.
So on average, 1,500 people share every square kilometre of Region X. That is a fairly crowded figure — the land is carrying a large number of people for its size. But read the number carefully. It is an average across the whole 100 square kilometres. The people might be packed into a few busy corners and leave the rest almost empty, and the density figure on its own cannot tell the two apart. It says how many people the land holds, not whether they live comfortably.
2.3 Factors Influencing The Distribution Of Population
People do not settle at random across the Earth. Whether a place fills up or stays nearly empty depends on a set of factors — some rooted in the land itself, some in the economy, and some in society and culture. This section sorts them into those three groups.
2.3.1 Geographical Factors
The first geographical factor is the availability of water, and it is the most important of all. Water is needed for life — for drinking, bathing and cooking — and also for cattle, for crops, for industries and for moving goods by boat. Because so much depends on it, river valleys are among the most densely populated areas of the world.
The second factor is landforms. People prefer to live on flat plains and gentle slopes, because such land is easy to farm, and easy to lay roads and build factories on. Mountainous and hilly areas hold back the growth of transport networks and do not favour farming or industry, so they tend to be thinly settled. This is why the Ganga plains of northern India, a broad lowland built up by the river, are among the most densely populated areas of the world, while the mountain zones of the Himalayas just to the north are scarcely peopled.
The third factor is climate. An extreme climate — a very hot or a very cold desert — is uncomfortable to live in, and areas with very heavy rainfall or harsh weather carry few people. A comfortable climate, without much seasonal swing, draws people in. The lands around the Mediterranean Sea, in southern Europe and the neighbouring shores of Africa and the near east, were settled from early times precisely because their climate is pleasant.
The fourth factor is soil. Fertile soils matter because farming and the activities tied to it depend on them. Areas with rich, loamy soil support intensive agriculture and therefore hold more people. Turn this around, and you can begin to name the parts of India that are thinly settled because their soils are poor.
2.3.2 Economic Factors
Minerals draw people. Where there are mineral deposits, industries follow, and mining and factory work generate employment, so skilled and semi-skilled workers move in and the area grows crowded. The Katanga–Zambia copper belt in south-central Africa is one such case, where the ore in the ground has pulled a dense working population around it.
The next factor is urbanisation. Urbanisation is the movement of people from villages into towns and cities and the growth of the share of a population that lives in urban places. Cities offer better jobs, schooling and medical care, better transport and communication, and good civic amenities, and the pull of city life keeps drawing people in. This sets off migration from the countryside to the city, cities swell in size, and the very largest of them — the mega cities, meaning cities of many millions — take in large numbers of newcomers every year.
A closely related factor is industrialisation. Industrial belts offer jobs and pull in large numbers of people, and not just factory workers. Around an industry gather transport operators, shopkeepers, bank employees, doctors, teachers and every other kind of service provider, so one factory belt can support a whole crowd of livelihoods. The Kobe–Osaka region of central Japan is thickly populated for exactly this reason — the sheer number of industries packed into it.
2.4 Population Growth
Population growth, also called population change, is the change in the number of people living in a territory over a fixed stretch of time. That change can be positive, when the number rises, or negative, when it falls. It may be stated as an absolute number of people, or as a percentage. How a region’s population is changing is one of the clearest signs of its economic development, its social progress, and its historical and cultural background.
The scale of this change over history is striking. The human population has grown more than ten times over the past five hundred years, and in the twentieth century alone it multiplied about four times.
Ways Of Measuring Growth
The growth of population is simply the change between two points in time. Measured in plain numbers, it is a count of how many more, or fewer, people there now are. A crore, the unit the next example uses, is ten million people.
That 18.15 crore is the growth in absolute terms — the sheer number of people added in a decade. Expressed instead as a percentage of where India started, the same change becomes the growth rate of population, which is what lets us compare the pace of growth across countries of very different sizes.
Growth also comes in two forms depending on what is counted. Natural growth counts only the difference between births and deaths in a region between two points of time:
\[\text{Natural growth} = \text{Births} - \text{Deaths}\]
Actual growth goes further and adds the movement of people in and out:
\[\text{Actual growth} = \text{Births} - \text{Deaths} + \text{In-migration} - \text{Out-migration}\]
From this, positive growth of population happens when the birth rate stays above the death rate, or when people migrate in permanently from other countries. Negative growth happens when a population shrinks — either because the birth rate slips below the death rate, or because people move away to other countries.
The full chain of what adds to a population and what takes away from it can be read off as a single flow, shown in Fig. 2.2.

Fig. 2.2 – Components of population change.
2.4.1 Components Of Population Change
There are three components that change a population — births, deaths and migration. The first two are measured as rates so that places of different sizes can be compared fairly.
The crude birth rate is the number of live births in a year for every thousand people. It is worked out as:
\[\text{CBR} = \frac{B}{P} \times 1000\]
Here B is the number of live births during the year, P is the estimated mid-year population of the area, and the answer comes out as live births per thousand people.
Deaths matter just as much, because a population can grow not only when more babies are born but also when fewer people die. The crude death rate measures mortality as the number of deaths in a year for every thousand people:
\[\text{CDR} = \frac{D}{P} \times 1000\]
Here D is the number of deaths during the year and P is again the estimated mid-year population, giving deaths per thousand people. The birth rate and the death rate are mirror measures — one counts entries into a population, the other counts exits — and the gap between them drives natural growth. By and large, death rates depend on a region’s demographic make-up, its social advancement and its level of economic development.
2.4.2 Migration
Besides birth and death, there is a third way a population changes its size: people move. Migration is the movement of people from one place to another to live. The place of origin is the place a person moves away from, and the place of destination is the place they move to. The origin loses population while the destination gains it, and migration can be read as a natural attempt to strike a better balance between people and the resources available to them.
Migration takes many forms. It may be permanent, temporary or seasonal, and it may run from rural to rural areas, rural to urban, urban to urban, or urban to rural. The same person is seen from two sides: immigrants are those who move into a new place, while emigrants are those who move out of one — so a single migrant is an immigrant at the destination and an emigrant at the origin at the very same time.
People migrate in search of a better economic and social life, and two sets of factors pull the decision in opposite directions. Push factors make the place of origin seem less attractive — unemployment, poor living conditions, political turmoil, unpleasant climate, natural disasters, epidemics and general socio-economic backwardness. Pull factors make the destination seem more attractive — better jobs and living conditions, peace and stability, security of life and property, and a pleasant climate. Migration is usually the result of both acting together: something driving a person out, and something drawing them on.
2.5 Demographic Transition
The theory of demographic transition is a way of both describing and predicting how a region’s population will change over time. It says that a population moves from high births and high deaths to low births and low deaths as the society around it changes — from rural, farming and largely illiterate, to urban, industrial and literate. Because the change happens in a set order of stages, the whole sequence is called the demographic cycle, carrying a society from a rural, agrarian world to an urban, industrial one.
The heart of the theory is a three-stage model, drawn out in Fig. 2.3.
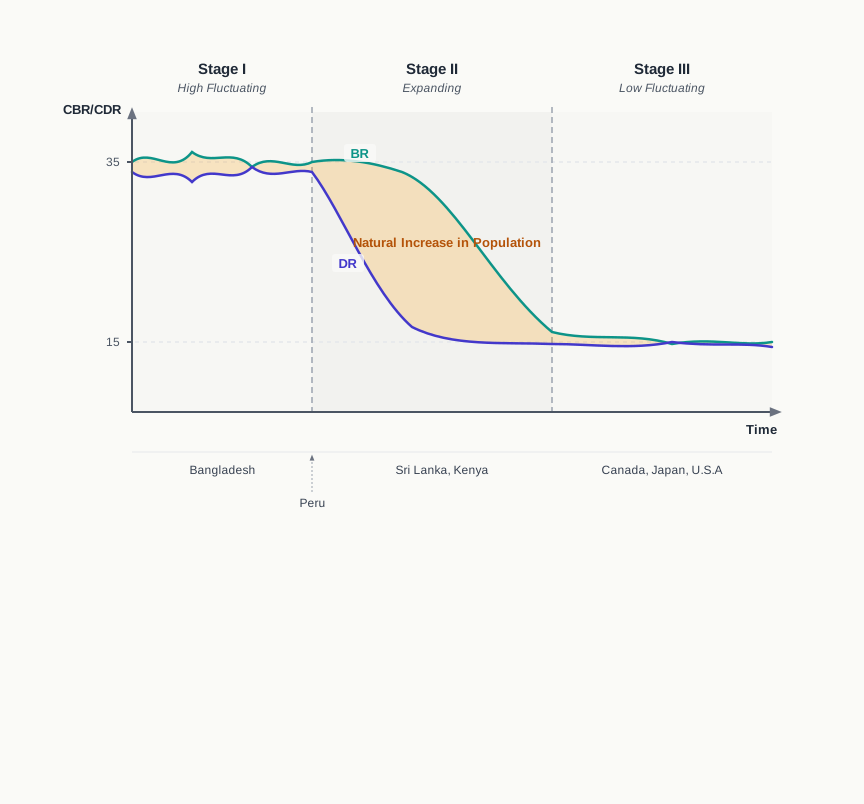
Fig. 2.3 – The three-stage model of demographic transition.
The Three Stages
The three stages form a sequence, each flowing into the next, as Fig. 2.4 sets out.
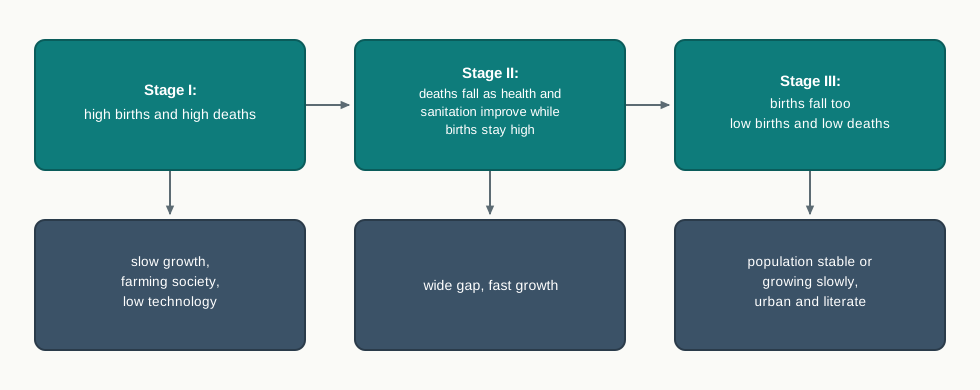
Fig. 2.4 – The sequence of demographic transition.
In the first stage, both fertility — the rate at which children are born — and mortality are high. People have many children to make up for the many who die from epidemics and an unreliable food supply, so the population grows only slowly. Most people work in agriculture, where a large family is an asset of extra hands. Life expectancy, the average number of years a person can expect to live, is low, most people are illiterate, and technology is simple. Two hundred years ago, every country in the world sat in this stage.
In the second stage, fertility stays high at first but slowly begins to fall. At the same time, mortality drops, as better sanitation and health care keep more people alive. Because births still outrun deaths by a wide margin during this gap, the net addition to the population is large — this is the stage of fastest growth.
In the last stage, both fertility and mortality settle at low levels. The population becomes stable or grows only slowly. Society is now urban and literate, with strong technical know-how, and families are deliberately kept small.
All of this shows how flexible human beings are: they adjust the number of children they have as their conditions change. And because societies reached these conditions at different times, in the present day the world’s countries are scattered across all the stages of demographic transition at once.
2.6 Population Control Measures
Family planning is the spacing out, or the preventing, of the birth of children. Giving people proper access to family planning services is one of the most effective ways of slowing population growth, and it improves women’s health at the same time, since it lets a woman decide when and how often to have children. Among the measures that help are public awareness campaigns, the free supply of contraceptives, and tax disincentives that discourage very large families.
Malthus And The Limits Of Growth
The concern behind these measures is an old one. The English scholar Thomas Malthus, writing in 1798, argued that the number of people would rise faster than the supply of food. Once population outran food, he said, any further increase would end in a population crash brought on by famine, disease and war.
Malthus drew a distinction between two kinds of check on population. Preventive checks are the deliberate ones — limiting births before they happen, as family planning does today. Physical checks, which he also called positive checks, are the brutal ones that cut a population back after it has already grown too large: hunger, sickness and war. Malthus held that the preventive checks were the better path. His warning still frames the modern argument: if our resources are to last, the world will have to bring its rapid population increase under control.
2.7 Summary
- The people of a country are its real wealth, so studying a population means asking how many there are, where they live, and how their numbers change.
- Population is spread very unevenly across the Earth — about 90 per cent of people live on roughly 10 per cent of the land.
- Density of population is the total population divided by the total area, measured in persons per square kilometre; it is an average for the whole area.
- Where people settle is shaped by geographical factors (water, landforms, climate and soil), economic factors (minerals, urbanisation and industrialisation), and social and cultural factors.
- A population changes through three components — births, deaths and migration.
- Births and deaths are measured as rates per thousand people: the crude birth rate and the crude death rate.
- Natural growth is births minus deaths; actual growth also adds in-migration and subtracts out-migration.
- Migration is pulled by two sets of forces — push factors that drive people from the origin, and pull factors that draw them to the destination.
- The theory of demographic transition describes a society passing through three stages, from high births and high deaths to low births and low deaths.
- Population control rests on family planning, while Malthus’s old warning holds that unchecked growth outruns the food supply.
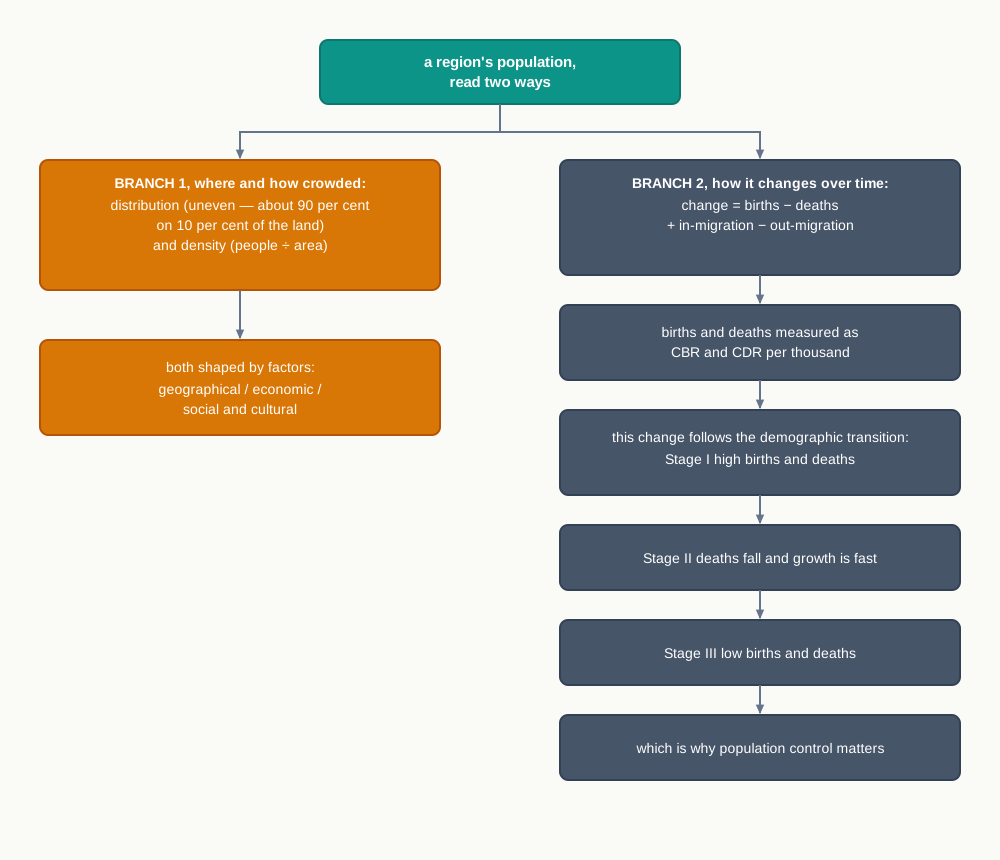
Fig. 2.5 – Chapter summary: distribution, density and growth.
What This Chapter Cannot Tell You
A density figure or a national growth number is an average — it hides how unevenly people are packed within a region, and how one district can swell while another empties. The demographic transition is a general model; it cannot fix the year a country will move from one stage to the next, or promise that it will. And the chapter’s figures, like the 2001 and 2011 population counts, belong to particular years, and say nothing about what has happened since.
2.8 NCERT Questions
- Which one of the following continents has the highest growth of population?
- Africa
- South America
- Asia
- North America
- Which one of the following is not an area of sparse population?
- The Atacama
- South-east Asia
- Equatorial region
- Polar regions
- Which one of the following is not a push factor?
- Water shortage
- Medical/educational facilities
- Unemployment
- Epidemics
- Which one of the following is not a fact?
- Human population increased more than ten times during the past 500 years.
- Population growth is high in the first stage of demographic transition.
- The world’s population is very unevenly distributed over the earth’s surface.
- Death rates fall before birth rates in the second stage of demographic transition.
- Name three geographical factors that influence the distribution of population. (about 30 words)
- There are a number of areas with high population density in the world. Why does this happen? (about 30 words)
- What are the three components of population change? (about 30 words)
- Distinguish between:
- Birth rate and death rate.
- Push factors and pull factors of migration.
- Discuss the factors influencing the distribution and density of population in the world. (about 150 words)
- Discuss the three stages of demographic transition. (about 150 words)
- Map Skill. On the outline map of the world, show and name the following.
- Countries of Europe and Asia with negative growth rate of population.
2.9 Check Your Concepts
- Look at Fig. 2.1. Which is the single most populous country shown, and what does the sharp drop in bar length after the top two countries tell you about how the world’s population is shared?
- Explain how the same person can be both an immigrant and an emigrant at the same time.
- Under what conditions does a region show negative growth of population?
- How does the actual growth of a population differ from its natural growth? Write both in the form of what is added and what is subtracted.
- In Fig. 2.3, what does the shaded area between the birth-rate and death-rate curves stand for, and in which of the three stages is it widest?
- Two regions are found to have exactly the same population density. Can you be sure that people are equally crowded in both? Explain your answer using what density does and does not measure.
- What did Malthus mean by preventive checks, and why did he hold them to be better than the physical checks of famine, disease and war?
2.3.3 Social And Cultural Factors
Some places attract people because they carry religious or cultural importance. In the same way, people tend to move away from places troubled by social and political unrest. Governments, too, shape the pattern: they sometimes offer incentives to draw people into sparsely settled areas, or to ease them out of overcrowded ones. You can probably think of examples of both from your own region.
Q1. Why do people crowd into some regions and leave others almost empty?
A. Because some places make living and working easier. Fresh water, flat land, a kind climate and fertile soil draw people in; so do minerals, cities and industry. Harsh deserts, cold lands and steep mountains, short of water or level ground, are left thinly settled.