Chapter 3: Land Resources And Agriculture
Stand at the edge of almost any growing Indian city and you can watch a change that this chapter is about. Ten years ago, a field here carried a standing crop — wheat in winter, perhaps, drying to gold before the harvest. Today the same rectangle of land carries a row of half-built houses, a lane of fresh concrete, and a board advertising plots for sale.
Nothing about the land itself has changed. The soil is the same, the rainfall is the same, the area of the field has not grown or shrunk by a single square metre. What has changed is the demand pressing on it. As a city’s economy grows, its people, its incomes and its need for space grow with it — and land, unlike almost everything else the economy uses, cannot be manufactured. Its total area is fixed. So every new demand must be met by taking land away from some older use.
That is the quiet arithmetic beneath the whole chapter. Land in India is not being created or destroyed; it is being re-sorted, category by category, as farms give way to settlements, wastelands are reclaimed, and forests are marked on the record. Read that field again. It is not just a plot for sale. It is a country deciding how to use a resource it cannot make more of.
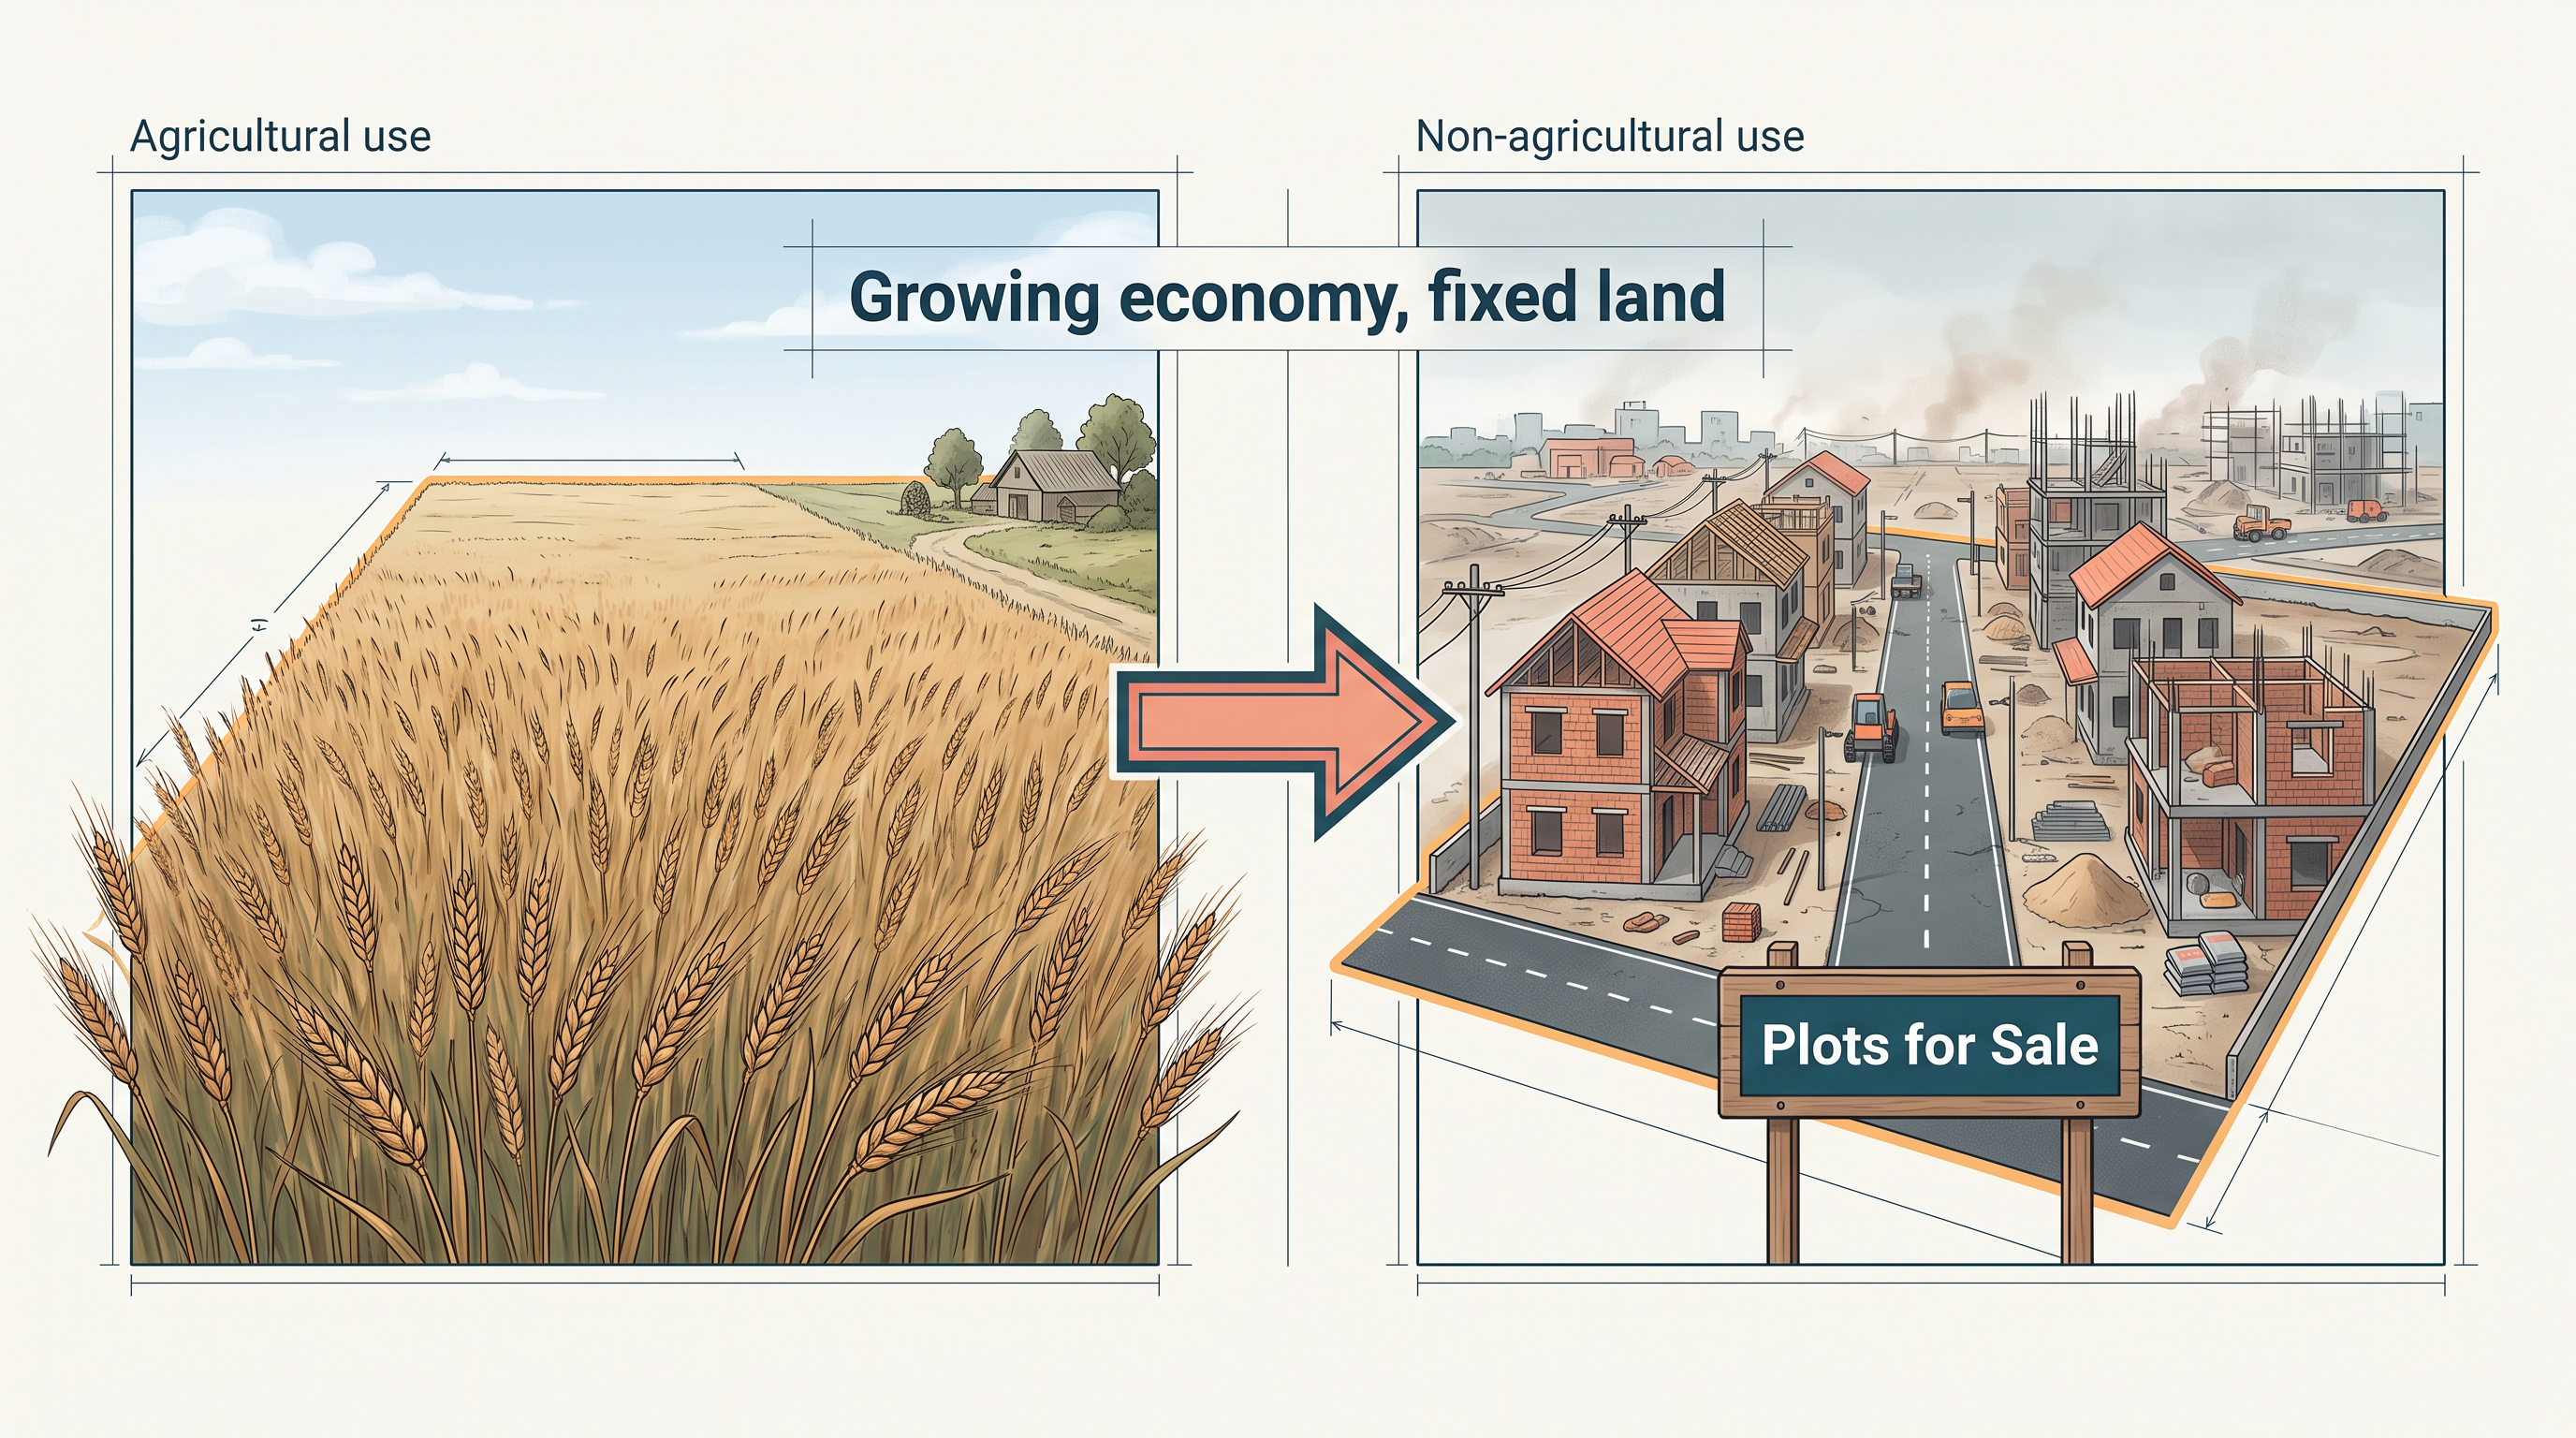
Fig. 3.0 – Agricultural to non-agricultural land use shift.
3.1 Land Use Categories
Look at the land around you and you will see it doing many different jobs at once. A river runs across some of it; trees stand on another part; roads and buildings cover a third. The school you attend, the road you travel on, the park you play in, the fields where crops are grown and the pastures where animals graze are all the same resource — land — put to different uses.
This is the first idea to hold on to. Human beings use land not for one purpose but for several: as a base for production, as a place to live, and as space for recreation. Because these uses compete for the same fixed surface, someone has to keep a record of how much land goes to each. That record is where this chapter begins.
Two Ways To Measure The Land
Land-use records in India are maintained by the land revenue department, the office that keeps account of land for the purpose of collecting revenue from it. When you add up all its land-use categories, the total is called the reporting area — the area for which land-use has actually been reported in the records.
The reporting area is not quite the same as the geographical area, which is the true surface area of a place as measured on the ground. The Survey of India, the national body responsible for mapping the country, measures the geographical area of India’s administrative units. The two figures differ, and it is worth being clear about why.
The geographical area is fixed. It does not change, because it is a measured fact of the land itself, held constant by Survey of India measurements. The reporting area, on the other hand, shifts a little from year to year, because it depends on the estimates entered in the land revenue records, and those estimates are revised. You have already met these land-use categories once before, in your Class X Social Science textbook; here we look at them more closely.
The Nine Categories
The land revenue records sort all land into nine categories. Each is a different answer to the question ‘what is this land being used for?’
Forests are land classified as forest — but note carefully what that means. The area classified as forest is the area the Government has identified and demarcated for forest growth, and the records follow this official definition. This is not the same as the area actually under tree cover. Because the record counts demarcated land rather than living forest, this category can rise even when no new trees have grown at all.
Barren and wastelands are lands that cannot normally be cultivated with the technology available — barren hilly terrain, desert lands and ravines fall here. Land put to non-agricultural uses covers everything built over: rural and urban settlements, infrastructure such as roads and canals, industries and shops. As a country’s secondary and tertiary activities — its industry and services — expand, this category grows with them.
Area under permanent pastures and grazing lands is mostly owned by the village panchayat, the elected local council, or by the Government, with only a small share in private hands. The land the panchayat holds falls under ‘Common Property Resources’, a term the next section takes up. Area under miscellaneous tree crops and groves, which is kept separate from net sown area, is the land under orchards and fruit trees, much of it privately owned.
The last four categories are all about land that is cultivable but not currently cropped, and they are distinguished by one thing: how long the land has been left idle. Culturable wasteland is land left fallow — uncultivated — for more than five years; it can be brought back into cultivation after being improved through reclamation. Current fallow is land left without a crop for one agricultural year or less. Fallowing is a deliberate practice: the land is rested so that it recoups the fertility it has lost, through natural processes, before it is sown again.
Fallow other than current fallow sits between the two — cultivable land left idle for more than a year but less than five. Stay idle beyond five years and it is reclassified as culturable wasteland. Finally, net area sown is the physical extent of land on which crops are actually sown and harvested — the working farmland of the country.
Fallow And Wasteland: A Question Of Time
The three idle-land categories are easy to confuse, because they describe the same thing — cultivable land not being cropped — separated only by the length of the rest. Reading them as a single branching decision makes the boundaries clear.
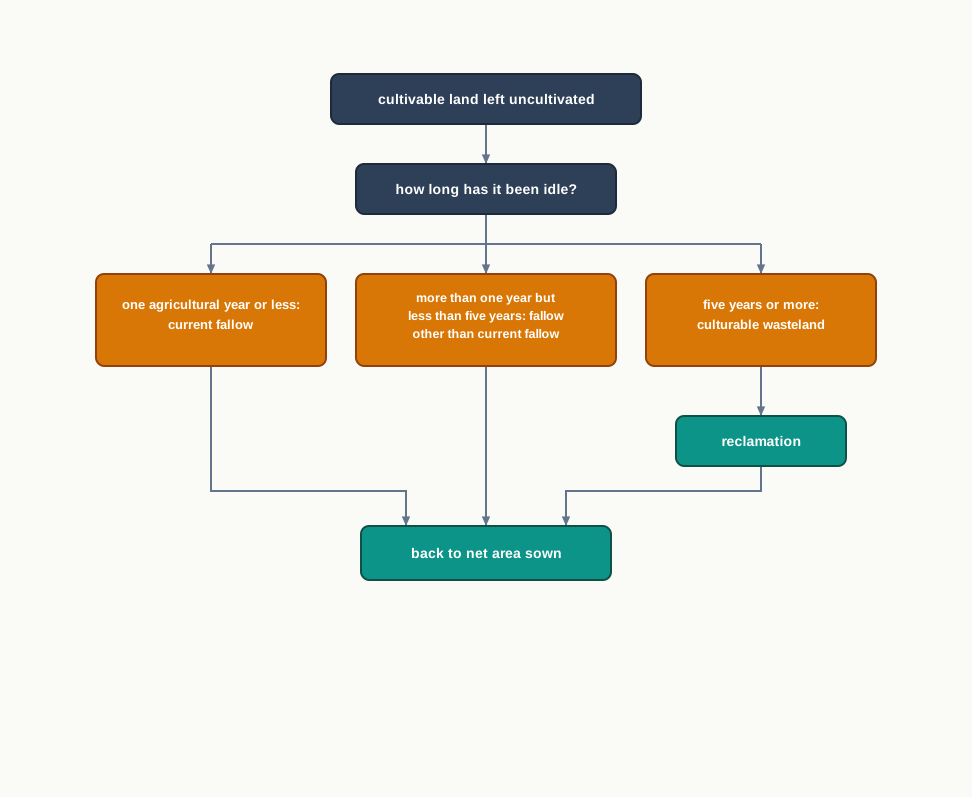
Fig. 3.1 – Classification of idle cultivable land.
The flowchart also shows the way back. Culturable wasteland is not lost land — reclaim and improve it, and it can rejoin the net area sown, which is exactly the movement that keeps the categories from being fixed once and for all.
3.2 Land-use Changes In India
How land is used in any region depends heavily on the economic activities carried out there. But there is a catch. Economic activity keeps changing over time, while land, like many natural resources, is fixed in its total area. New demands therefore cannot be met by making more land; they can only be met by re-sorting the land there already is. To see how this re-sorting happens, we have to follow three kinds of change that an economy passes through.
Three Changes That Move The Land
The first is a change in the size of the economy — the total value of all the goods and services it produces. This grows over time as population rises, incomes rise, and technology improves. As the economy grows, the pressure on land grows with it, and marginal lands — land that was too poor or too costly to use before — are drawn into use.
The second is a change in the composition of the economy — the balance between its sectors. Over time the secondary sector (industry) and the tertiary sector (services) usually grow much faster than the primary sector, which includes agriculture. This shift is common in developing countries like India. As it happens, land moves gradually out of agricultural use and into non-agricultural use, and the movement is sharpest around large urban areas, where farmland is steadily taken over for building.
The third change is subtler. Even though agriculture’s share of the economy falls over time, the pressure on agricultural land does not fall with it. Two reasons explain this. In developing countries, the share of the population that depends on farming for a living declines much more slowly than agriculture’s share of the economy. And the number of people the farm sector must feed keeps rising day by day. Fewer people leave the land than the economic figures suggest, and there are more mouths to feed than before.
Reading The Shift, 1950–51 To 2019–20
India’s economy has changed enormously over the past four or five decades, and its land-use has changed with it. Fig. 3.2 sets the shares of each land-use category side by side for two years — 1950–51 and 2019–20 — so the shift can be read at a glance.
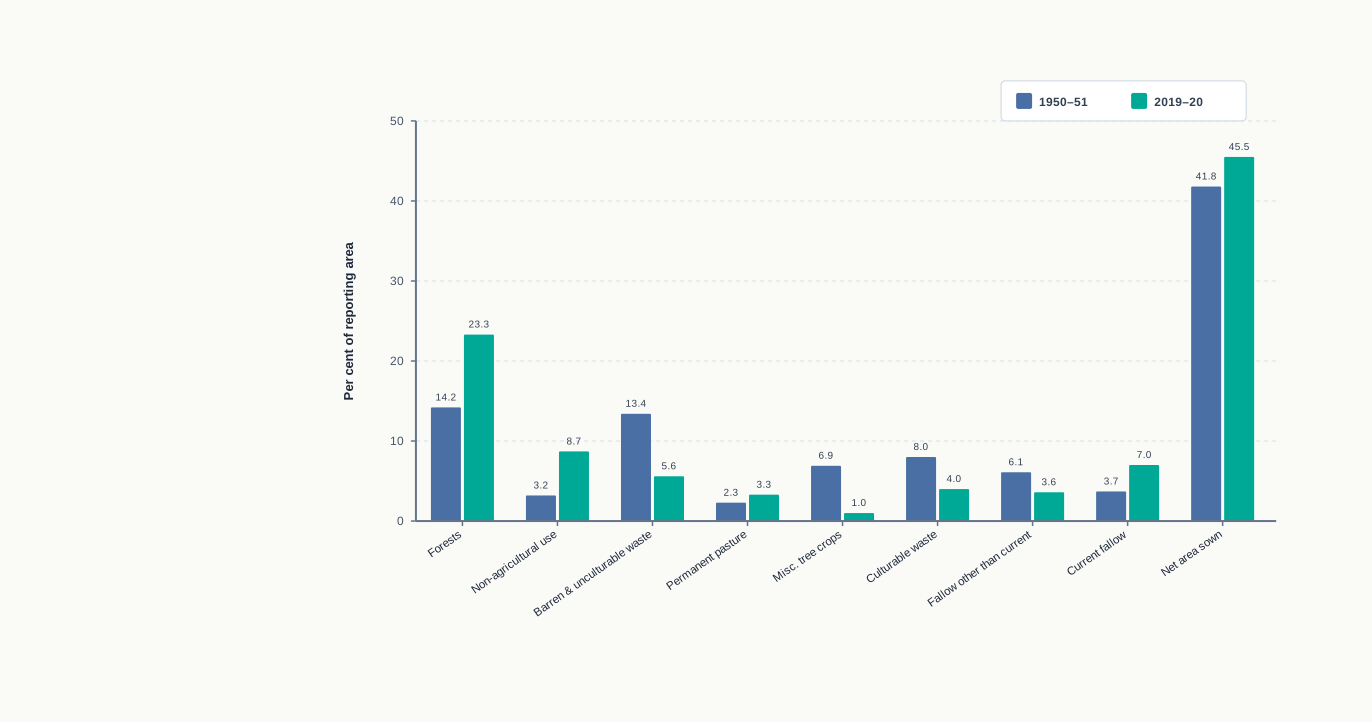
Fig. 3.2 – India’s land-use categories, 1950–51 and 2019–20.
Two cautions must be kept in mind before reading meaning into the figure. First, every percentage is worked out with respect to the reporting area, not the absolute area. Second, since the reporting area itself has stayed relatively constant over the years, a fall in one category usually shows up as a rise in another. The land is not vanishing or appearing; it is moving between columns.
What Rose, What Fell
Five categories increased between the two years, and four declined. The share of area under forest, area under non-agricultural uses, permanent pasture and grazing land, current fallow, and net area sown all rose. Four observations help explain the rises.
The rate of increase is highest for area under non-agricultural uses. This follows directly from the changing structure of the Indian economy, which leans more and more on industry and services and on the infrastructure that supports them. An expansion of both urban and rural settlements has added to it. So the area under non-agricultural uses is growing at the expense of wastelands and agricultural land.
The rise in the forest share, as the last section explained, reflects an increase in the demarcated area marked out for forest, not a real increase in tree cover across the country. The rise in current fallow cannot be read off from just two years of data; current fallow swings sharply from year to year, depending on the variability of rainfall and on cropping cycles. The rise in net area sown is a recent turn — culturable wasteland has been brought into cultivation — reversing an earlier slow decline that had been caused mostly by land moving into non-agricultural use, the very building activity you can see spreading over farmland in your own village or city.
The four categories that declined are barren and wasteland, culturable wasteland, area under tree crops and groves, and fallow other than current fallow. The reasons are straightforward. As the pressure on land rose from both the agricultural and non-agricultural sides, the wastelands and culturable wastelands were steadily drawn into use and so declined. And the fall in land under tree crops and groves is explained by the same pressure from agricultural land pushing in.
Actual Increase Is Not The Same As Rate Of Increase
There is a difference between two things that sound alike: the actual increase in a category and its rate of increase. The actual increase is simply the difference in its value between the two years. The rate of increase is that difference expressed as a fraction of where it started — a simple growth rate.
\[\text{Actual increase} = \text{Terminal-year value} - \text{Base-year value}\]
\[\text{Rate of increase (\%)} = \frac{\text{Terminal-year value} - \text{Base-year value}}{\text{Base-year value}} \times 100\]
Here the terminal year is 2019–20 and the base year is 1950–51; each value is a category’s share of the reporting area, in per cent, and the rate of increase is itself a percentage. Working the two measures for two very different categories shows why they must not be confused.
Notice how the two measures disagree. Net area sown added a large slice of the reporting area — 3.9 points — yet grew only about 9 per cent, because it started from a big base. Non-agricultural use added a smaller slice — 5.9 points — but grew by more than 180 per cent, because it started from almost nothing. A category rising from a small base can post a dramatic rate while adding modest land; a large category can add more land yet grow slowly in proportion. This is exactly why the chapter singles out non-agricultural use as having the highest rate of increase: the rate, not the raw addition, is what marks it out.
3.3 Common Property Resources
So far we have sorted land by what it is used for. It can also be sorted by who owns it, and here land falls into two broad heads. Private land is owned by an individual or a group of individuals, who decide how it is used. Common property resources (CPRs) are owned by the state and held for the use of the community as a whole. The distinction matters, because the two kinds of land support people in very different ways.
What The Commons Provide
A common property resource does quiet but essential work in a village. It provides fodder for livestock and fuel for households, and it yields a range of minor forest products as well — fruits, nuts, fibre and medicinal plants among them. None of this is bought or sold in the ordinary way; it is gathered from land that belongs to everyone and to no one in particular.
Why The Commons Matter Most To The Poor
For some households the commons are not a convenience but a lifeline. In rural areas, CPRs are of particular importance to the livelihood of the landless, of marginal farmers, and of other weaker sections. Many of these households depend on income from their livestock precisely because they have little or no land of their own — and it is the common land that feeds those animals. Where access to private land is denied, access to the common is what remains.
The commons also shape the working day of rural women. Most of the fodder and fuel collection is done by women, who often have to spend long hours gathering it — and increasingly from CPR land that has become degraded, so that more walking and more effort yield less. The burden is real, and it falls hardest on those with the least.
Who Owns A Common?
A common property resource can be defined as a community’s natural resource, one where every member holds the right of access and use — but with specified obligations, and without anybody holding property rights over it. No single person owns it; the community manages it and answers for it. Community forests, pasture lands, village water bodies and other public spaces all count as CPRs, wherever a group larger than a single household or family exercises the rights of use and carries the responsibility of managing them.
3.4 Agricultural Land Use In India
Of all the ways land is used, farming is the one most tightly bound to the land itself. Three points bring this out. First, agriculture is a purely land-based activity in a way that industry and services are not: land contributes far more to what a farm produces than it does to the output of other sectors. This is why, in rural areas, lack of access to land is directly linked to poverty. Second, the quality of the land has a direct bearing on how much a farm yields — a link that scarcely exists for a factory or an office. Third, in the countryside land ownership carries a value beyond production: it is security against a bad harvest, a natural disaster or a family emergency, it can be pledged for credit, and it adds to a household’s standing in the village.
Measuring The Cultivable Land
We can estimate the country’s total stock of farmland — its total cultivable land — by adding up three of the categories from earlier: net sown area, all the fallow lands, and culturable wasteland. Table 3.1 sets out how these components have changed between 1950–51 and 2019–20.
The table shows a marginal decline over the years in the stock of cultivable land as a share of the reporting area. Within that, cultivated land has fallen more than the figures for cultivable wasteland alone would suggest — the land is being squeezed from more than one side.
Getting More From The Same Land
It follows that the scope for bringing new land under the plough in India is now limited. If output must still rise, it has to come from using the existing land harder, and that means adopting land-saving technologies. These come in two kinds. One raises the yield of a particular crop per unit area of land. The other raises the total output per unit area across a whole year, by increasing land-use intensity — growing more crops on the same field in the same year.
The second kind has a valuable side effect: along with more output from limited land, it sharply raises the demand for labour. For a country that is short of land but rich in labour, like India, a high cropping intensity is doubly desirable — it uses the land more fully and it soaks up rural unemployment. The measure of this intensity is the cropping intensity (CI).
\[\text{Cropping intensity (\%)} = \frac{\text{Gross cropped area (GCA)}}{\text{Net sown area (NSA)}} \times 100\]
Here the net sown area (NSA) is the physical land actually sown, counted once however many times it is cropped; the gross cropped area (GCA) counts the total area sown across the year, so a field cropped twice is counted twice. Both are measured in area, such as hectares, and their ratio times 100 is a percentage. When the cropping intensity rises above 100 per cent, it means the land is, on average, being cropped more than once a year.
3.4.1 Cropping Seasons In India
The northern and interior parts of the country have three distinct crop seasons — kharif, rabi and zaid. The kharif season largely coincides with the south-west monsoon, and under its rains tropical crops such as rice, cotton, jute, jowar, bajra and tur can be grown. The rabi season begins with the onset of winter in October–November and ends in March–April; its low temperatures suit temperate and subtropical crops such as wheat, gram and mustard.
Zaid is a short summer season that begins after the rabi crops are harvested. Watermelons, cucumbers, vegetables and fodder crops are grown in it, on land that must be irrigated because there is little rain. Table 3.2 sets out the major crops of each season, north and south.
This neat three-season pattern does not hold in the southern parts of the country. There the temperature stays high enough to grow tropical crops at any time of year, provided the soil has moisture. As a result the same crops can be grown three times in an agricultural year in the south, wherever soil moisture is sufficient — which is why the southern column of Table 3.2 shows rice in every season.
3.4.2 Types Of Farming
Farming can first be classified by its main source of moisture. Where crops draw on a supplied source, it is irrigated farming; where they rely on rain, it is rainfed farming, also called barani. Each of these divides again, and the branches are worth laying out.
Irrigated farming differs by the purpose of the irrigation. Protective irrigation aims to shield crops from the harm of a moisture shortage; here irrigation is a supplement over and above the rainfall, and the strategy is to spread a limited amount of water over the largest possible area. Productive irrigation, by contrast, aims to supply enough moisture through the season to achieve high productivity, so the water applied per unit area is higher than under protective irrigation.
Rainfed farming divides by how well the rain matches what the crop needs. In dryland farming, largely confined in India to regions with annual rainfall below 75 cm, moisture is scarce, so farmers grow hardy, drought-resistant crops — ragi, bajra, moong, gram and guar — and practise soil-moisture conservation and rainwater harvesting. In wetland farming, the rainfall exceeds the plants’ soil-moisture needs during the rainy season; such regions can face floods and soil erosion, and grow water-intensive crops such as rice, jute and sugarcane, often adding aquaculture in freshwater bodies. The contrast is stark: dryland farming fights a shortage of water, wetland farming manages a surplus.
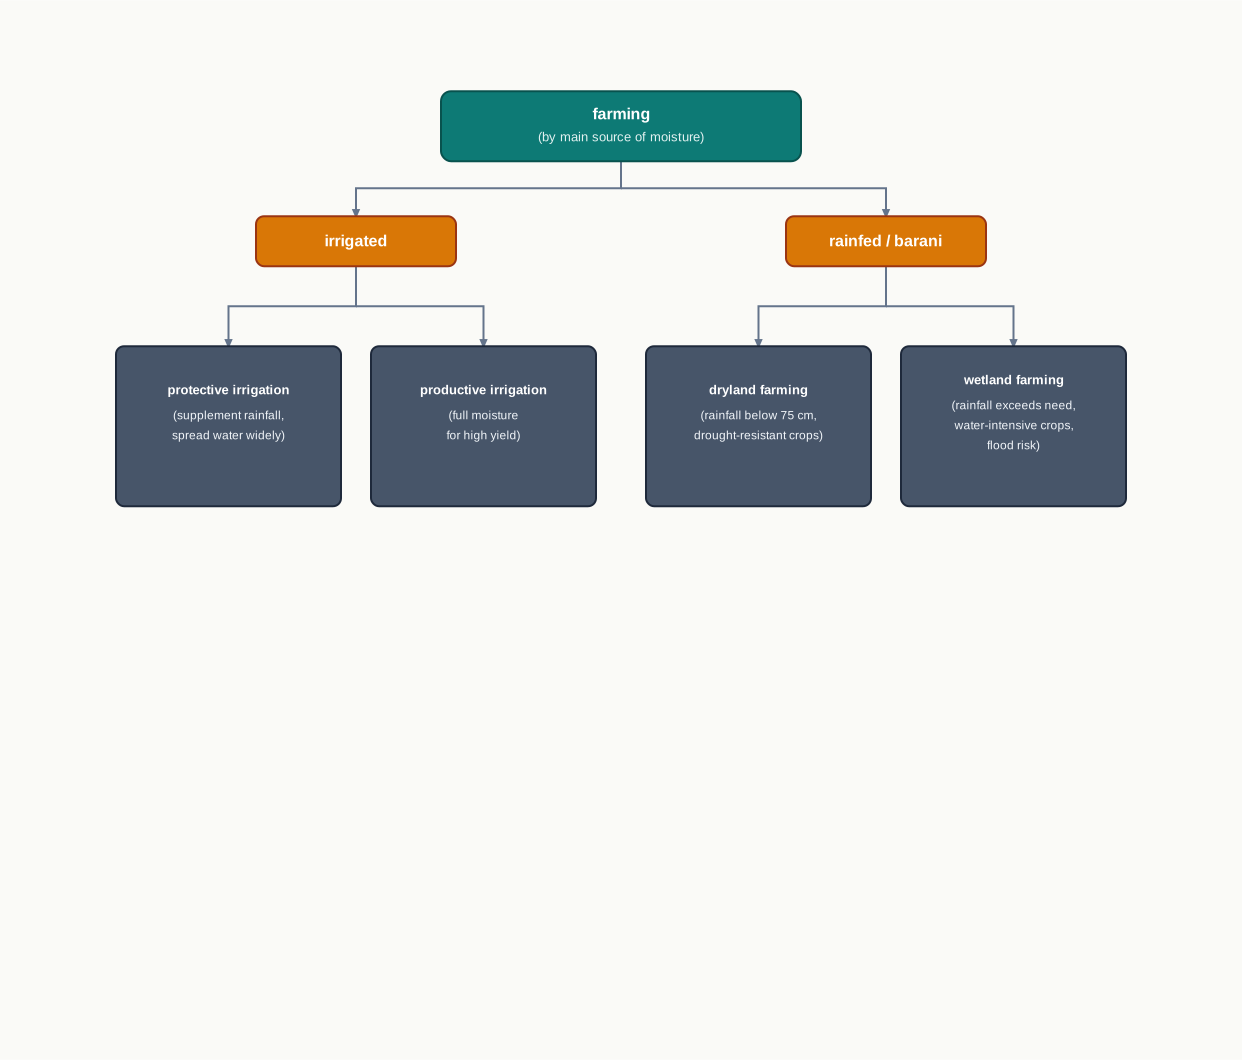
Fig. 3.3 – Farming types by moisture source.
3.4.3 Foodgrains
Foodgrains matter more than any other group in Indian agriculture, and one figure shows why: they occupy about two-thirds of the total cropped area of the country. They are the dominant crops everywhere, whether a region farms for its own subsistence or for the market. On the basis of the structure of the grain, foodgrains are classified into two groups — cereals and pulses.
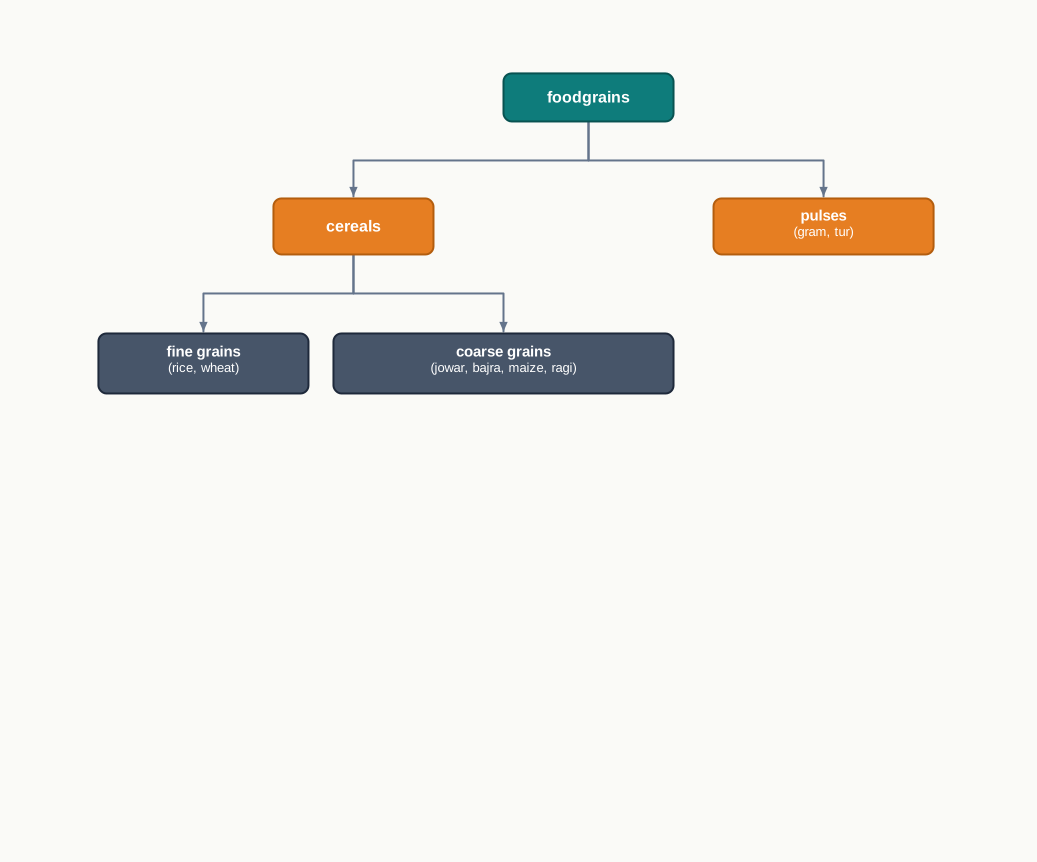
Fig. 3.4 – Classification of foodgrains.
A simple sorting exercise makes the classification stick: take a mixed heap of grains and separate the cereals from the pulses, then split the cereals again into the fine grains and the coarse grains. The branches of the flowchart are exactly the piles you would end up with.
3.4.3.1 Cereals
Cereals occupy about 54 per cent of the total cropped area in India. The country produces about 11 per cent of the world’s cereals and ranks third in output after China and the U.S.A. India’s cereals are of two kinds: the fine grains, rice and wheat, and the coarse grains — jowar, bajra, maize and ragi among them. The important cereals are taken up one by one below.
3.4.3.2 Rice
Rice is the staple food for the overwhelming majority of India’s people. Though it is thought of as a crop of the tropical humid areas, it has so many varieties that it is grown across very different agro-climatic regions — from sea level up to about 2,000 m altitude, and from the humid areas of eastern India to the dry but irrigated areas of Punjab, Haryana, western Uttar Pradesh and northern Rajasthan. In the southern states and in West Bengal the climate allows two or three crops of rice in a year; West Bengal farmers grow three, called ‘aus’, ‘aman’ and ‘boro’. But in the Himalayas and the north-western parts of the country, rice is a single kharif crop grown during the south-west monsoon.
India contributes 22.07 per cent of the world’s rice production and ranked second after China in 2018. About one-fourth of the total cropped area in the country is under rice. West Bengal, Uttar Pradesh and Punjab are the leading rice-producing states. The yield of rice is high in Punjab, Tamil Nadu, Haryana, Andhra Pradesh, Telangana, West Bengal and Kerala; in the first four of these, almost all the land under rice is irrigated.
The picture of the transplanted rice field in Fig. 3.5 is the classic image of the crop, and the map in Fig. 3.6 shows where it dominates.
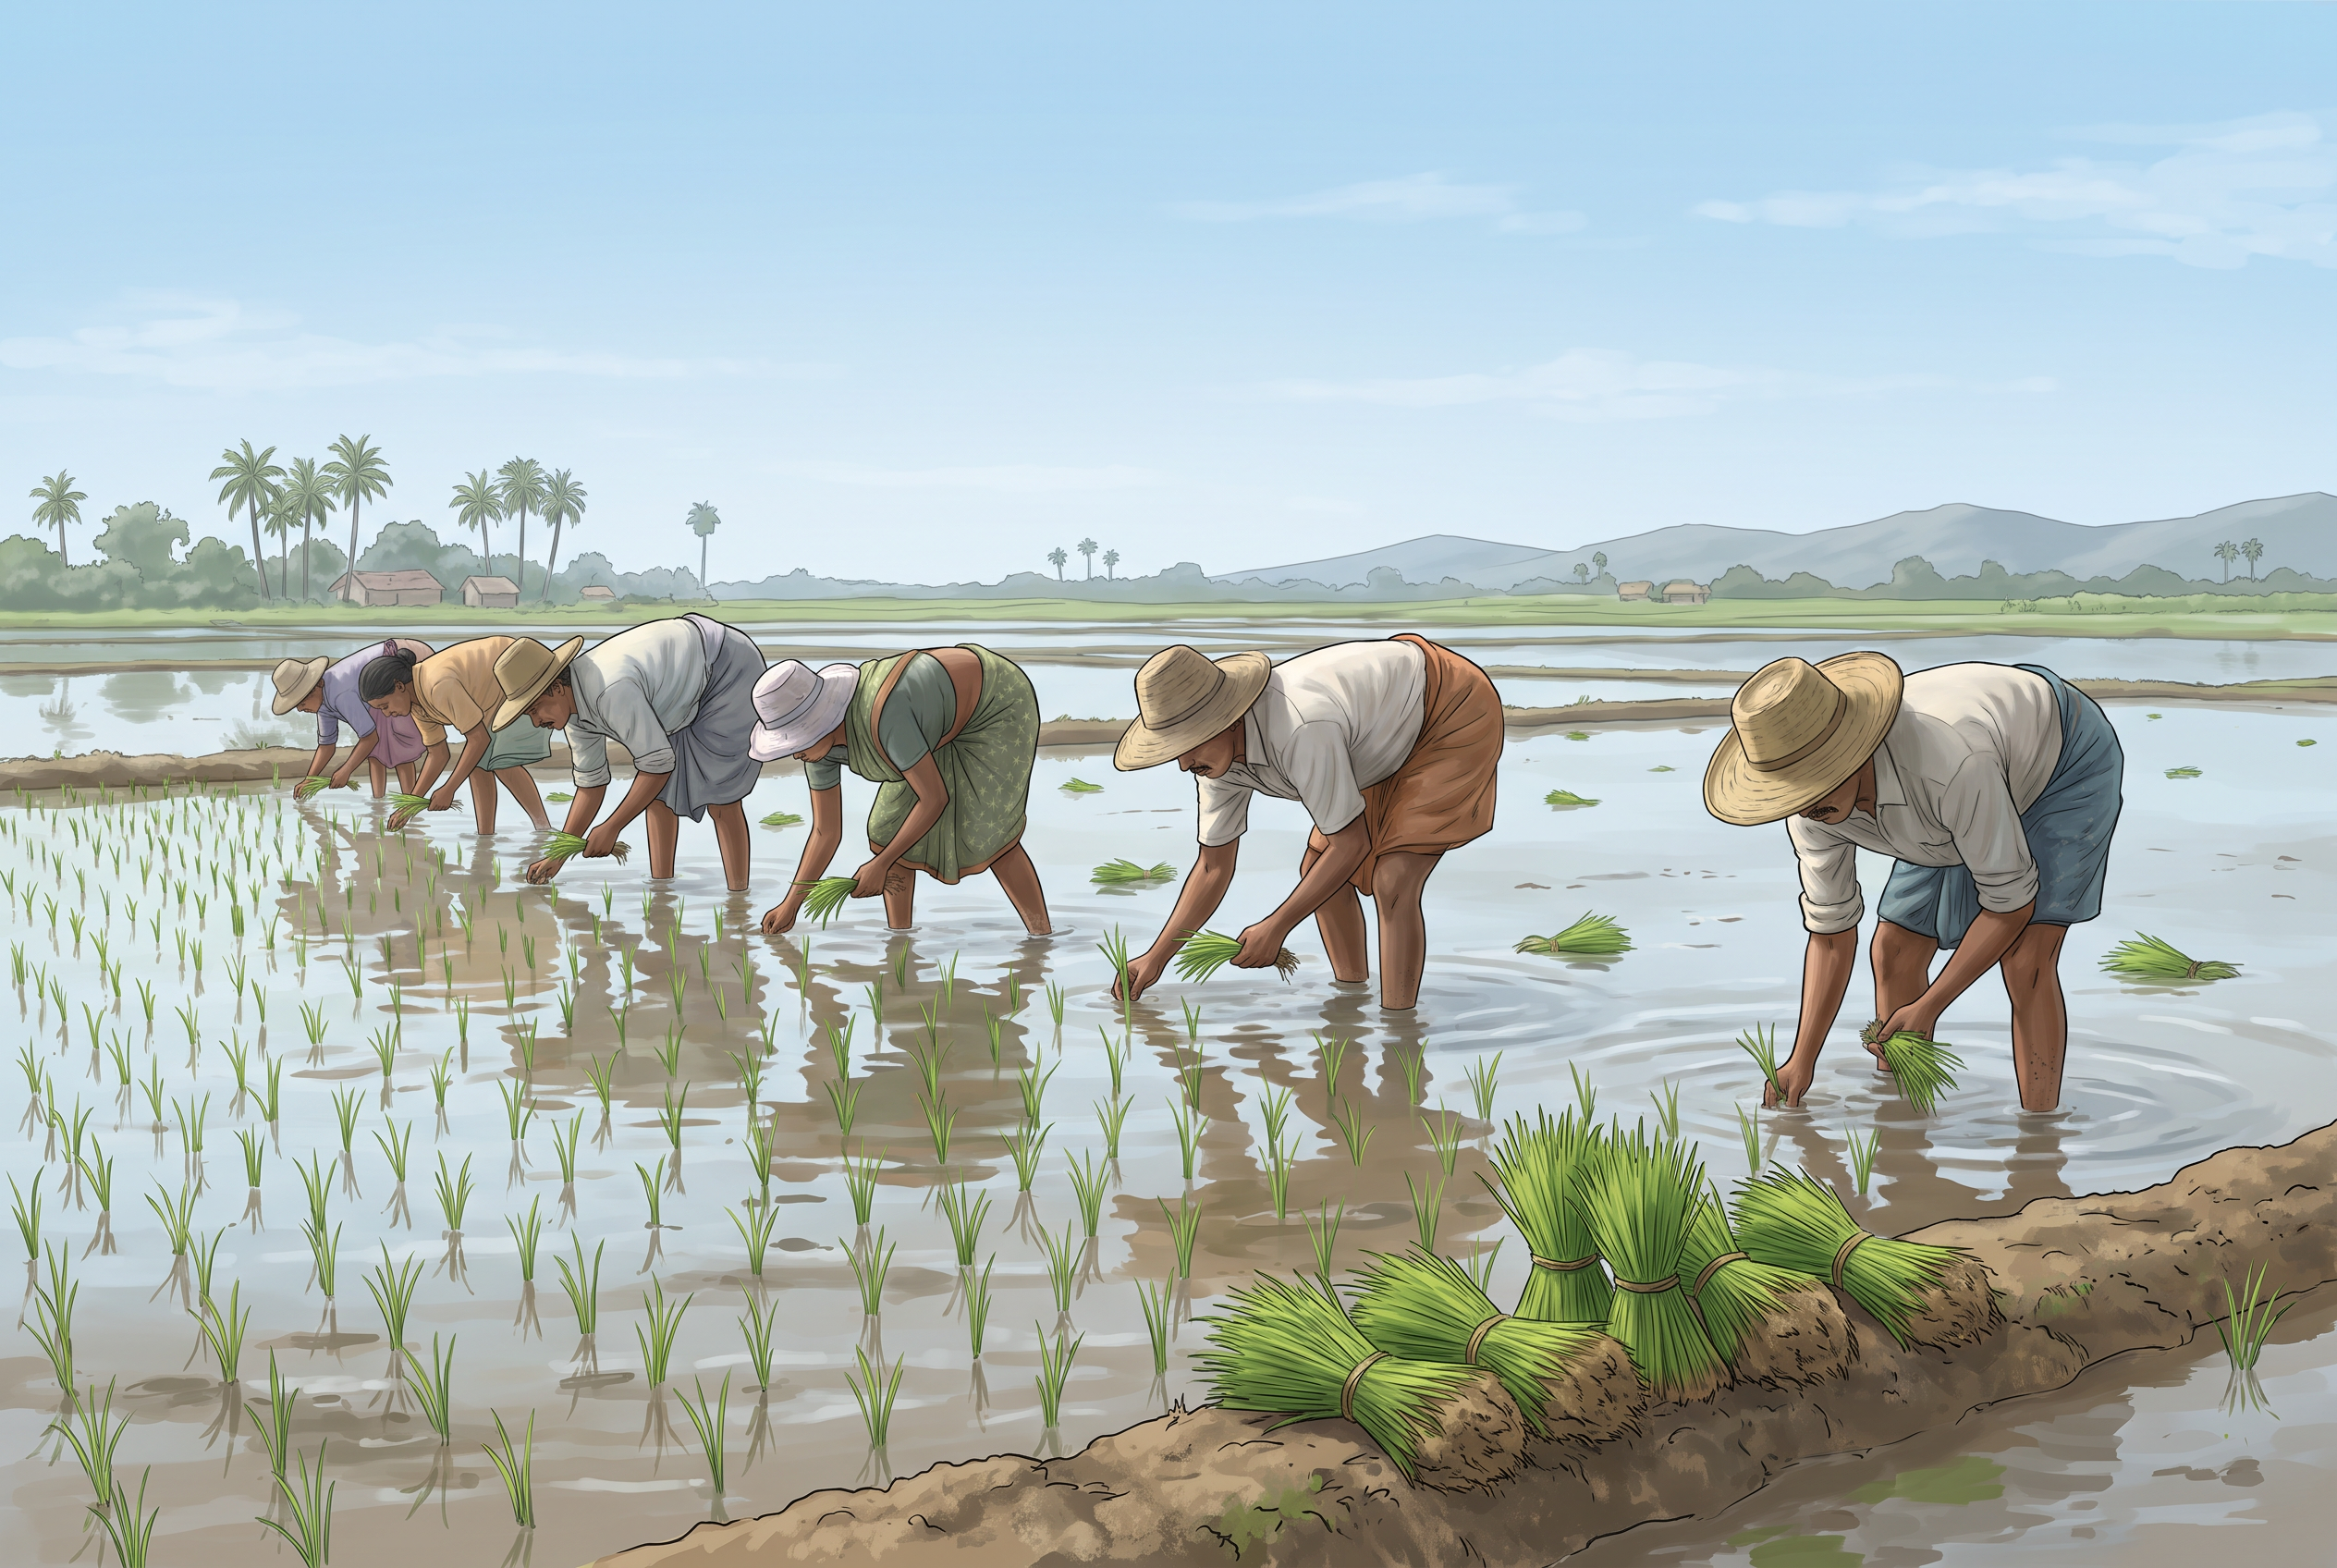
Fig. 3.5 – Rice transplantation in southern India.
Punjab and Haryana are worth a closer look, because they are not traditional rice-growing areas at all. Rice cultivation in their irrigated tracts was introduced only in the 1970s, following the Green Revolution. There, genetically improved varieties of seed, relatively heavy use of fertilisers and pesticides, and the crop’s lower vulnerability to pests in a dry climate together push the yield up. The yield is very low, by contrast, in the rainfed areas of Madhya Pradesh, Chhattisgarh and Odisha, in central and eastern India.
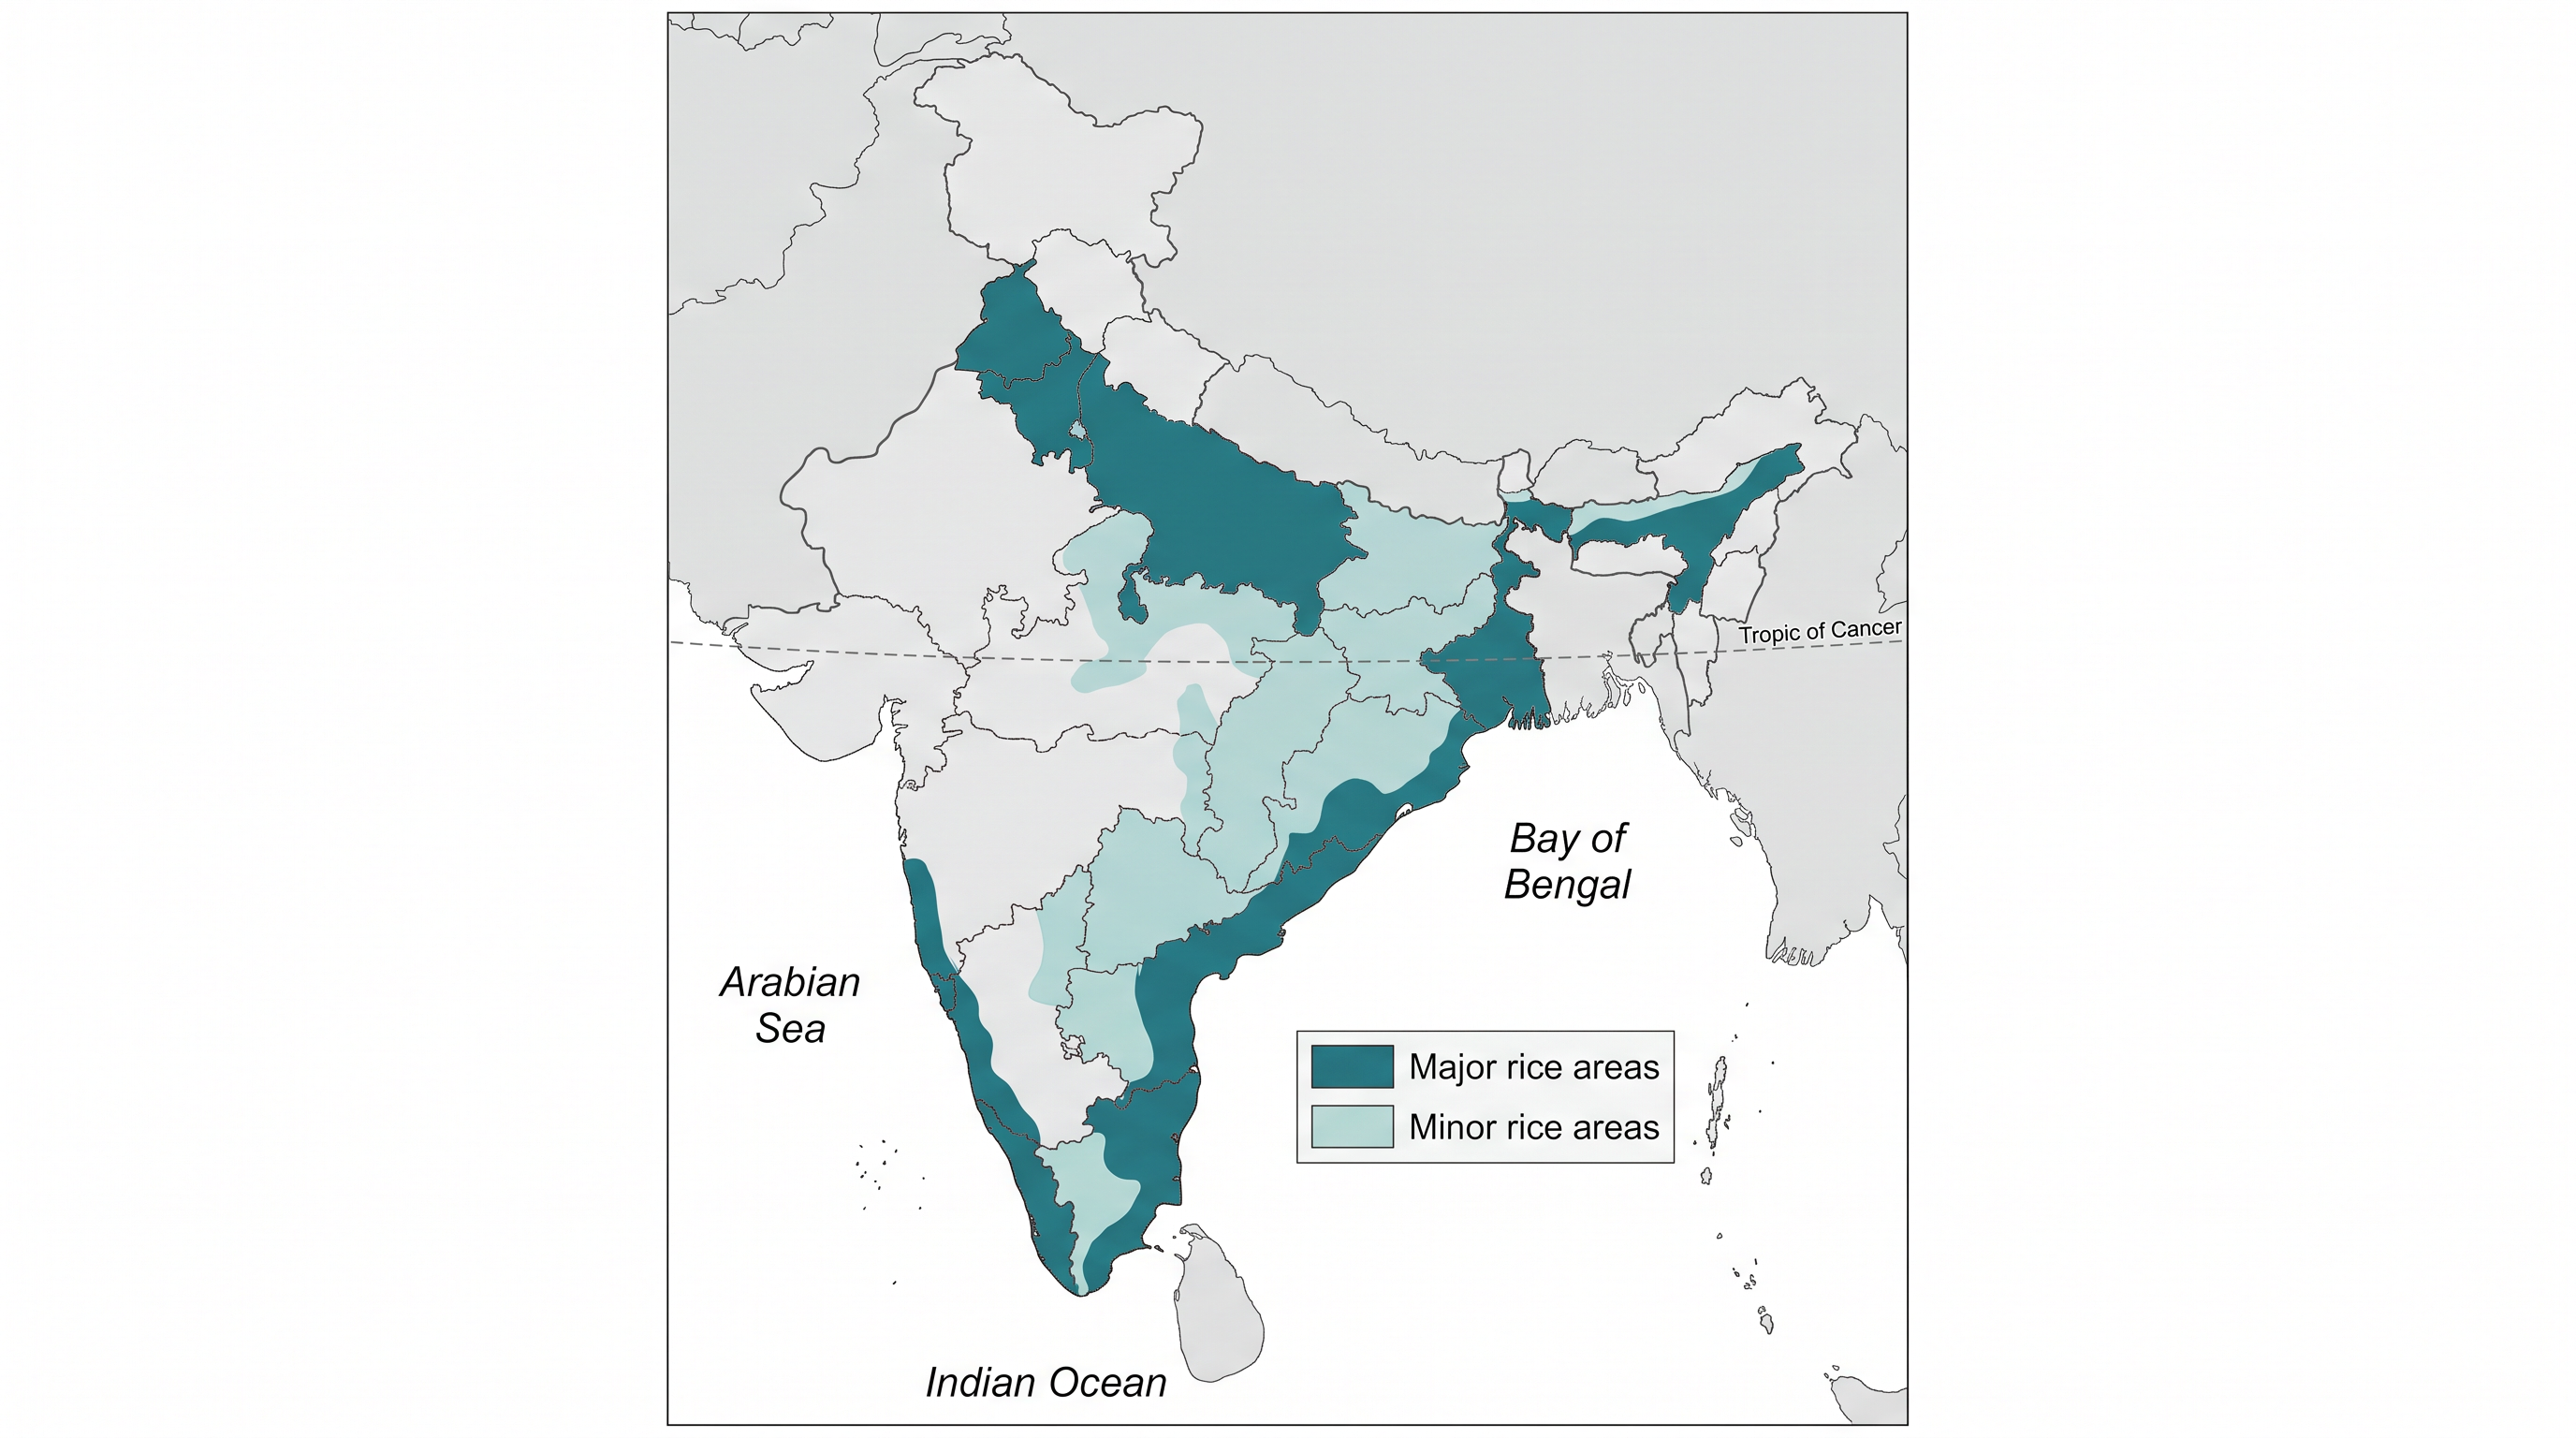
Fig. 3.6 – India: distribution of rice.
3.4.3.3 Wheat
Wheat is the second most important cereal after rice. India produces about 12.8 per cent of the world’s wheat (2017). It is primarily a crop of the temperate zone, so in India it is grown in winter, as a rabi crop. About 85 per cent of the area under wheat is concentrated in the north and centre of the country — the Indo-Gangetic Plain that stretches across the north, the Malwa Plateau of Madhya Pradesh in the centre, and the Himalayas up to about 2,700 m altitude. As a rabi crop it is mostly grown under irrigation, though it stays rainfed in the Himalayan highlands and parts of the Malwa Plateau.
About 14 per cent of the country’s cropped area is under wheat. Uttar Pradesh, Madhya Pradesh, Punjab, Haryana and Rajasthan are the leading producers. The yield of wheat is very high — above 4,000 kg per hectare — in Punjab and Haryana, moderate in Uttar Pradesh, Rajasthan and Bihar, and low where it is grown rainfed, as in Madhya Pradesh, Himachal Pradesh and Jammu and Kashmir. The map in Fig. 3.7 shows the crop’s concentration in the north-west.
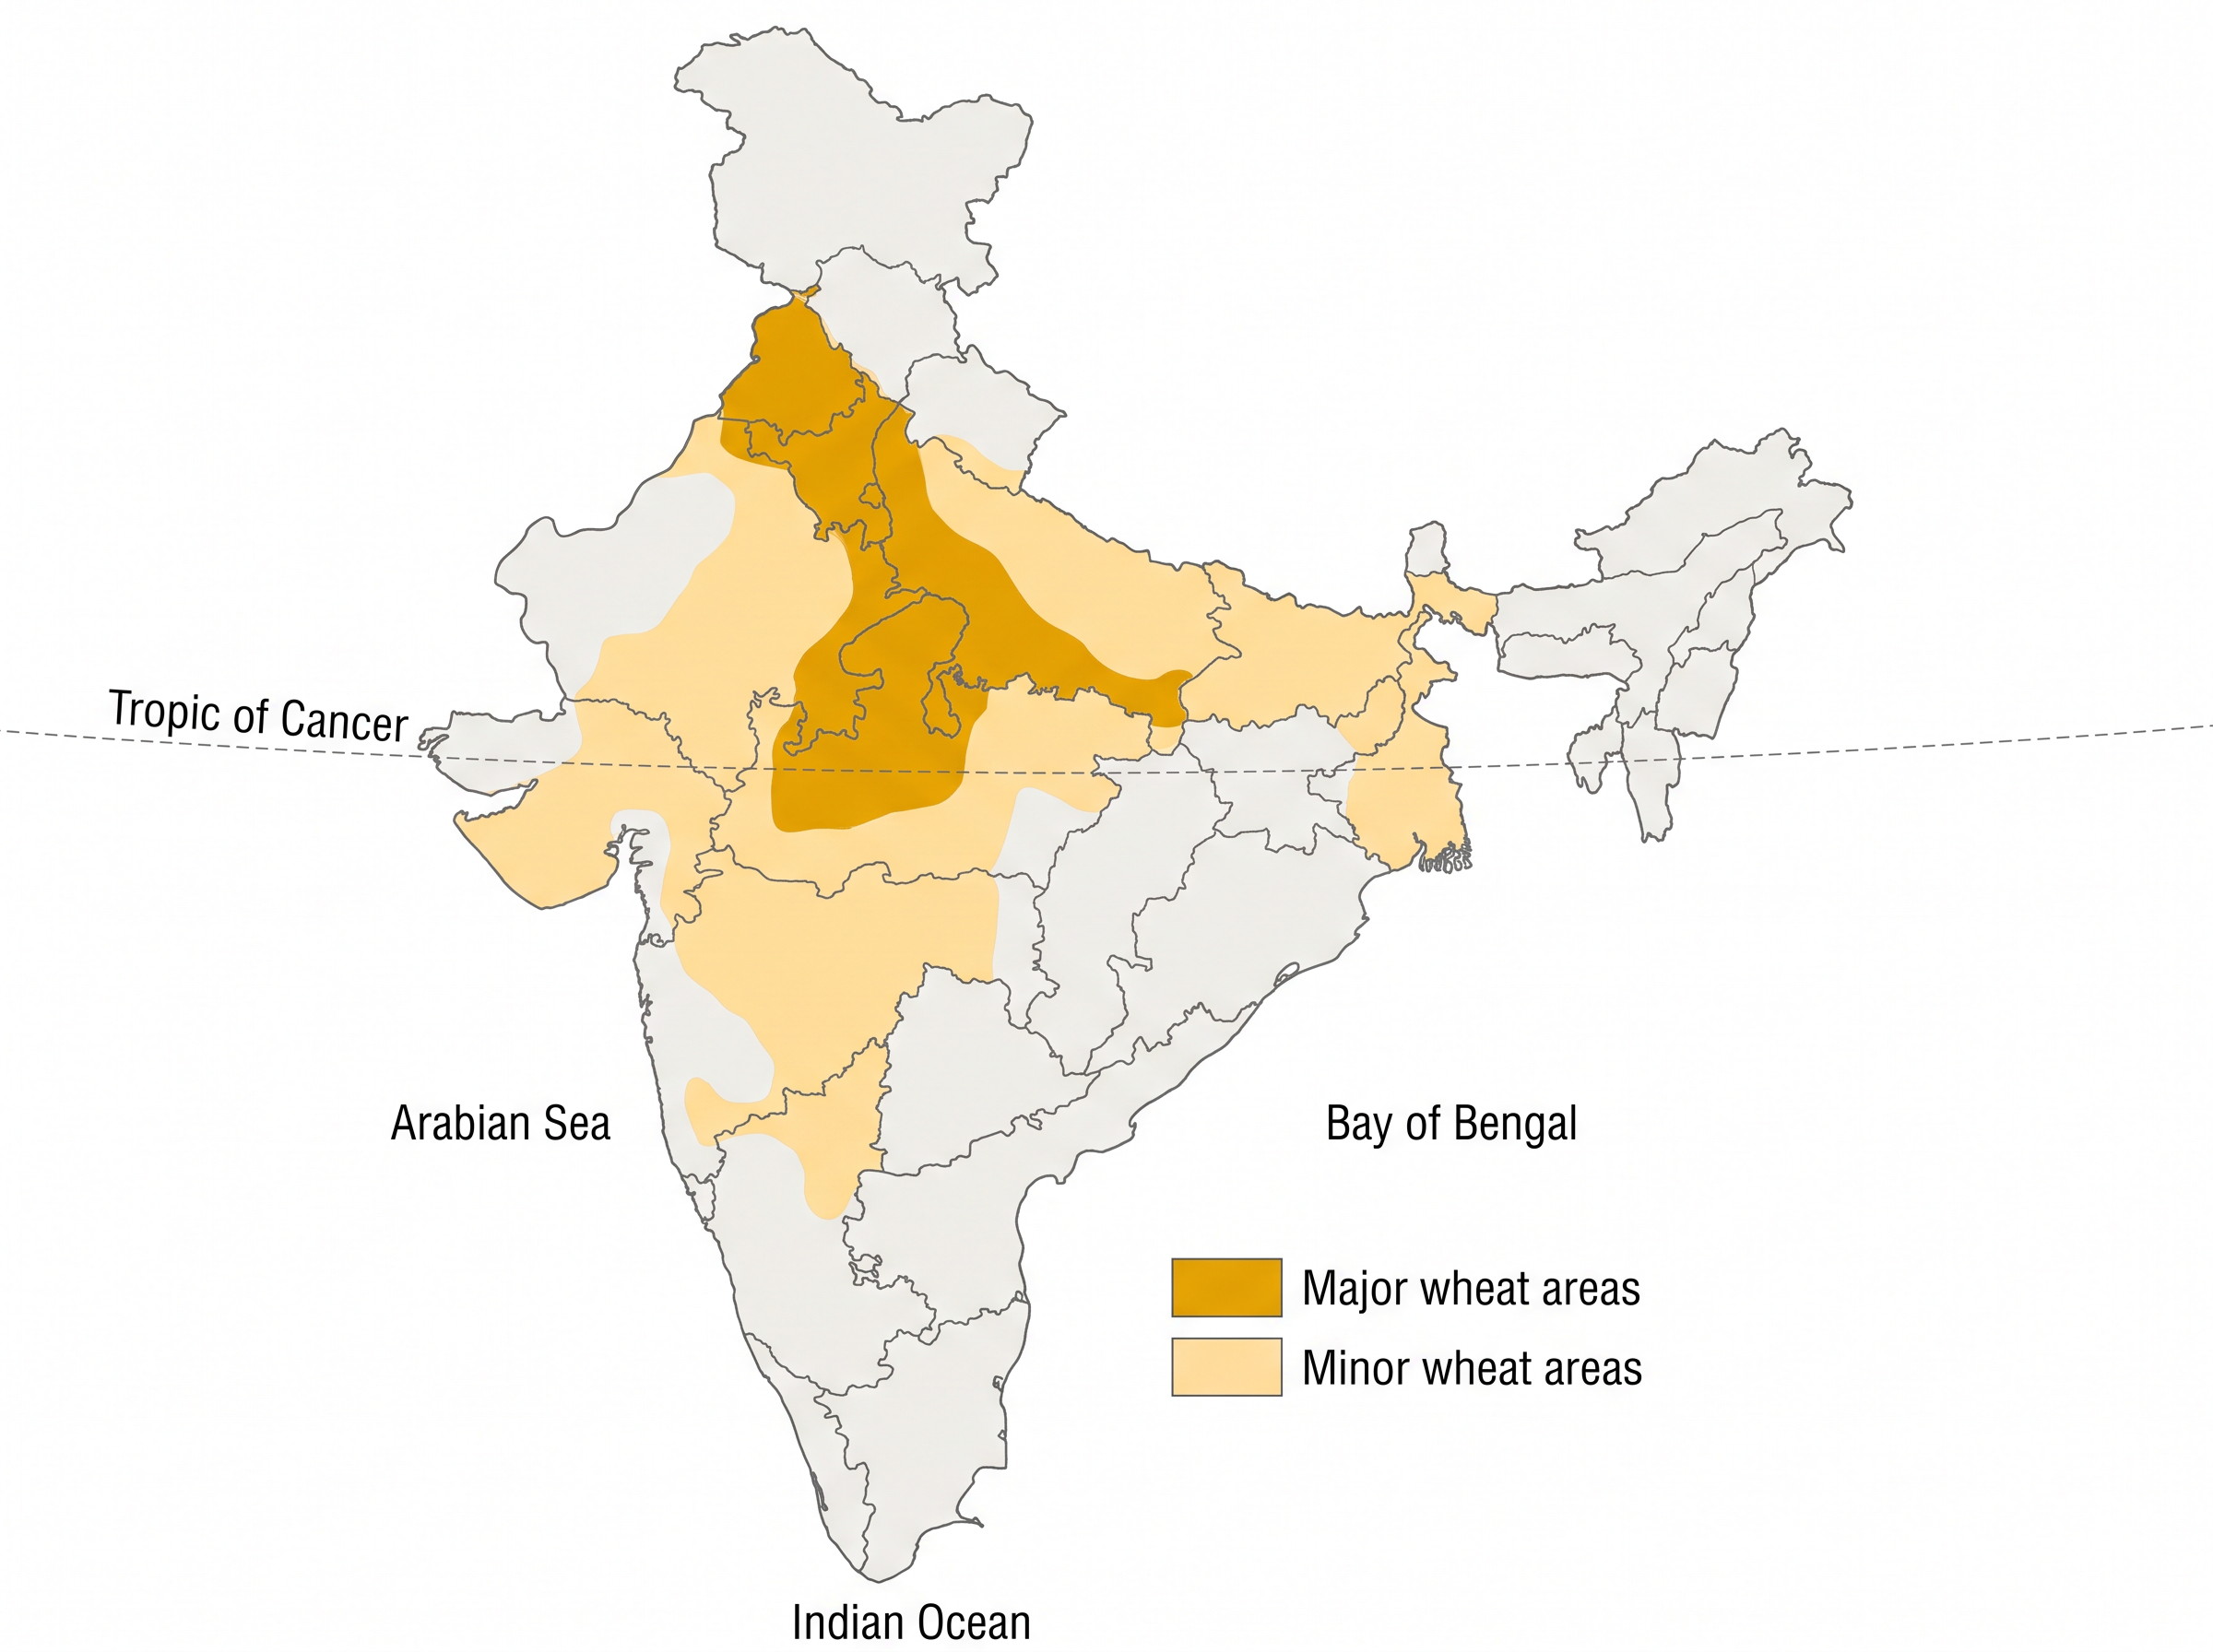
Fig. 3.7 – India: distribution of wheat.
3.4.3.4 Jowar
The coarse cereals together occupy about 16.50 per cent of the total cropped area. Among them, jowar — also called sorghum — alone accounts for about 5.3 per cent. It is the main food crop in the semi-arid areas of central and southern India. Maharashtra alone produces more than half of the country’s jowar; the other leading producers are Karnataka, Madhya Pradesh, Andhra Pradesh and Telangana. It is sown in both the kharif and rabi seasons in the southern states, but in northern India it is a kharif crop grown mostly as fodder. South of the Vindhya range, in central India, it is rainfed and its yield is very low.
3.4.3.5 Bajra
Bajra is sown in the hot and dry conditions of the north-western and western parts of the country. It is a hardy crop that resists the frequent dry spells and droughts of that region, and it is grown both alone and as part of mixed cropping. This coarse cereal occupies about 5.2 per cent of the total cropped area. Rajasthan, Maharashtra, Gujarat, Uttar Pradesh and Haryana are the leading producers. Its yield has risen in recent years in Rajasthan, Haryana and Gujarat, thanks to drought-resistant varieties and the spread of irrigation.
3.4.3.6 Maize
Maize is both a food crop and a fodder crop, grown under semi-arid conditions and even on poorer soils. It occupies only about 3.6 per cent of the total cropped area, and its cultivation is not concentrated in any one region — it is sown all over India except Punjab and the eastern and north-eastern regions. The leading producers are Karnataka, Madhya Pradesh, Bihar, Andhra Pradesh, Telangana, Rajasthan and Uttar Pradesh. The yield of maize is higher than that of the other coarse cereals; it is high in the southern states and falls off towards the centre of the country.
3.4.3.7 Pulses
Pulses are a very important part of a vegetarian diet, because they are rich sources of protein. They are also legume crops, which raise the natural fertility of the soil through nitrogen fixation — the process by which these plants, with the help of bacteria in their roots, capture nitrogen from the air and leave the soil richer for the next crop. India is a leading producer of pulses in the world. Their cultivation is concentrated in the drylands of the Deccan and central plateaus and in the north-west. Pulses occupy about 11 per cent of the total cropped area. Being rainfed crops of the drylands, their yields are low and swing from year to year. Gram and tur are the main pulses grown.
3.4.3.8 Gram
Gram is cultivated in subtropical areas. It is mostly a rainfed rabi crop grown in the central, western and north-western parts of the country, and it needs only one or two light showers or irrigations to grow well. Following the Green Revolution, it was displaced from the cropping pattern by wheat in Haryana, Punjab and northern Rajasthan. At present gram covers only about 2.8 per cent of the total cropped area. Madhya Pradesh, Uttar Pradesh, Maharashtra, Andhra Pradesh, Telangana and Rajasthan are the main producers. Its yield stays low and fluctuates from year to year even in irrigated areas.
3.4.3.9 Tur (Arhar)
Tur is the second most important pulse crop, also known as red gram or pigeon pea. It is cultivated on marginal lands and under rainfed conditions in the dry areas of the central and southern states. This crop occupies only about 2 per cent of the total cropped area. Maharashtra alone contributes about one-third of the country’s tur; the other leading producers are Uttar Pradesh, Karnataka, Gujarat and Madhya Pradesh. Its output per hectare is very low and its performance is inconsistent from year to year.
3.4.4 Oilseeds
Oilseeds are grown to extract edible oils. Their main growing regions are the drylands of the Malwa Plateau, the Marathwada region of interior Maharashtra, Gujarat, Rajasthan, Telangana, the Rayalaseema region of southern Andhra Pradesh and the Karnataka plateau. Together the oilseeds occupy about 14 per cent of the total cropped area. Groundnut, rapeseed and mustard, soyabean and sunflower are the main oilseed crops.
3.4.4.1 Groundnut
India produces about 18.8 per cent of the world’s groundnut (2018). It is largely a rainfed kharif crop of the drylands, though in southern India it is grown in the rabi season as well. It covers about 3.6 per cent of the total cropped area. Gujarat, Rajasthan, Tamil Nadu, Telangana, Andhra Pradesh, Karnataka and Maharashtra are the leading producers. Its yield is comparatively high in Tamil Nadu, where it is partly irrigated, but low in Telangana, Andhra Pradesh and Karnataka.
3.4.4.2 Rapeseed And Mustard
Rapeseed and mustard is not one oilseed but several — rai, sarson, toria and taramira. These are subtropical crops grown in the rabi season in the north-western and central parts of India. They are frost-sensitive, and their yields fluctuate from year to year, though the spread of irrigation and better seed technology have improved and steadied them; about two-thirds of the area under these crops is now irrigated. Together they occupy only about 2.5 per cent of the total cropped area. Rajasthan contributes about one-third of the production, with Haryana and Madhya Pradesh the other leading producers, and yields are comparatively high in Haryana and Rajasthan.
3.4.4.3 Other Oilseeds
Soyabean and sunflower are the other important oilseeds. Soyabean is grown mostly in Madhya Pradesh and Maharashtra, and these two states together produce about 90 per cent of the country’s output. Sunflower cultivation is concentrated in Karnataka, Andhra Pradesh, Telangana and the adjoining parts of Maharashtra; it is a minor crop in the north, where its yield is high because it is irrigated. The photograph in Fig. 3.8 shows soyabean being sown.
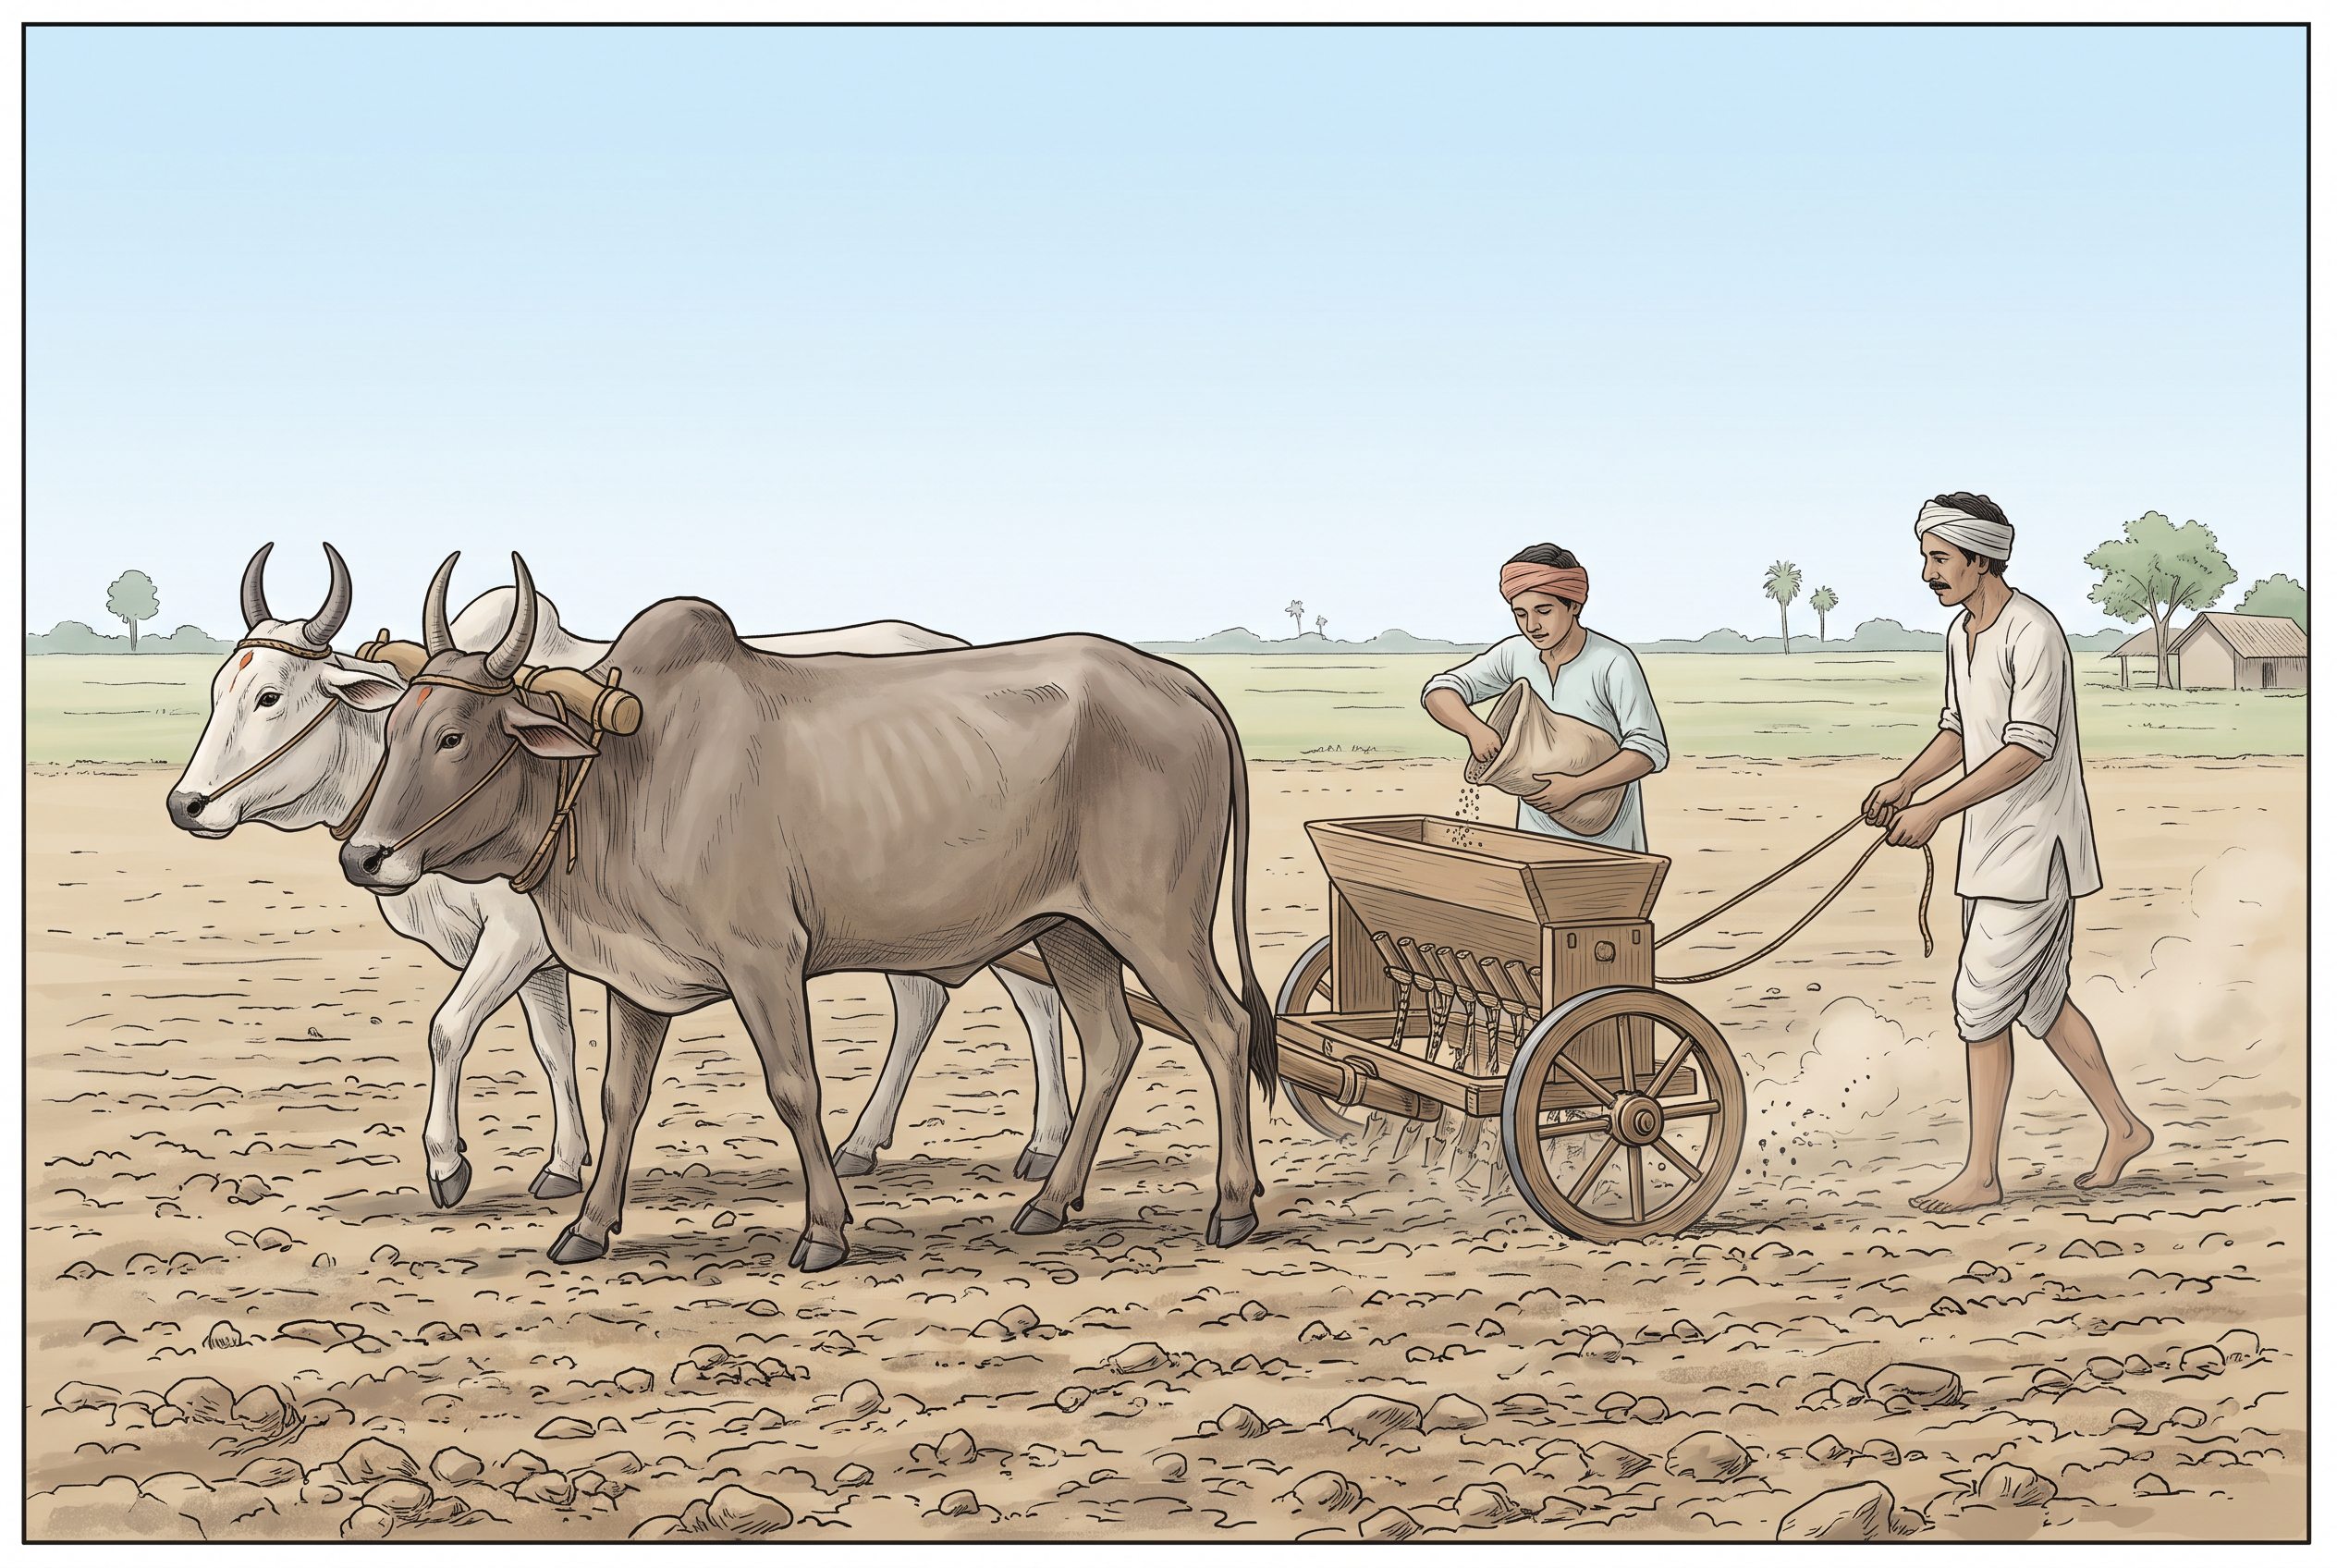
Fig. 3.8 – Sowing soyabean in Amravati, Maharashtra.
3.4.5 Fibre Crops
Fibre crops give us the fibre for making cloth, bags, sacks and many other items. Cotton and jute are the two main fibre crops grown in India.
3.4.5.1 Cotton
Cotton is a tropical crop grown in the kharif season in the semi-arid areas of the country. India lost a large part of its cotton-growing area to Pakistan at Partition, but the acreage has risen considerably over the last 50 years. The country grows both short-staple (Indian) cotton and long-staple (American) cotton, the latter called ‘narma’ in the north-west. Cotton needs a clear sky during its flowering stage. Fig. 3.9 shows the crop in the field.
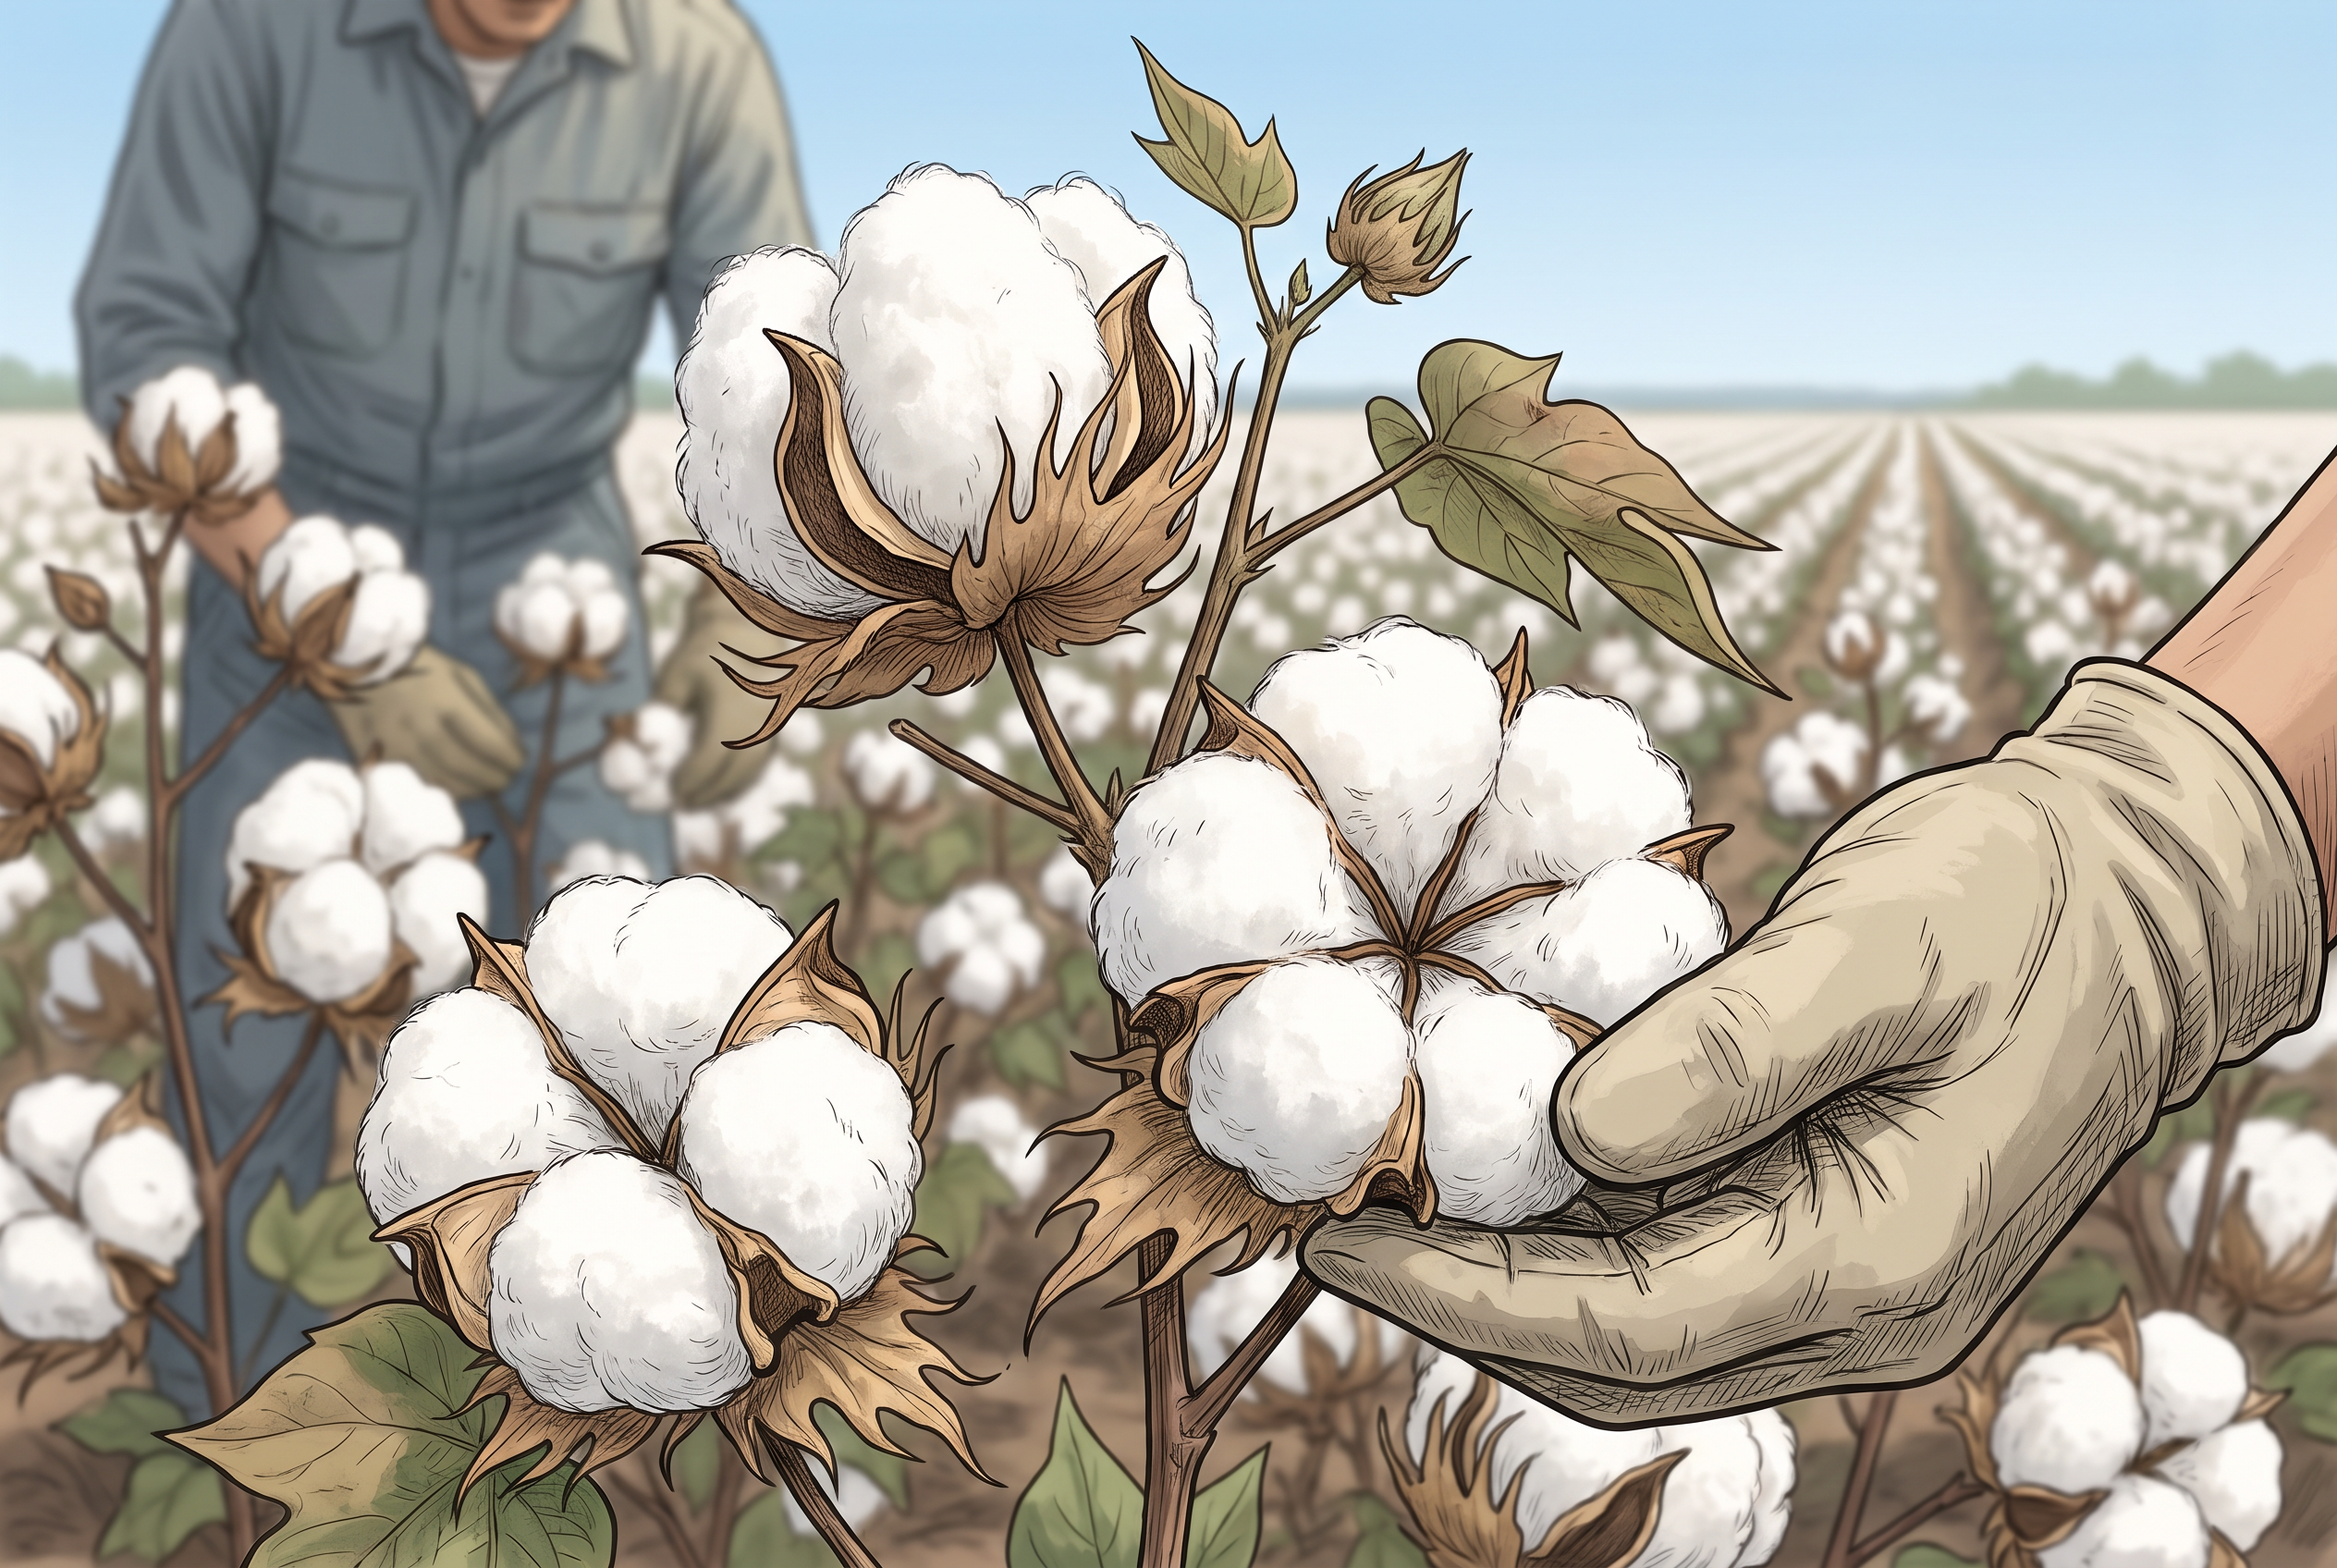
Fig. 3.9 – Cotton cultivation.
India ranks second in the world in cotton production, after China. Cotton occupies about 4.7 per cent of the total cropped area. There are three cotton-growing belts: parts of Punjab, Haryana and northern Rajasthan in the north-west; Gujarat and Maharashtra in the west; and the plateaus of Andhra Pradesh, Karnataka and Tamil Nadu in the south. The leading producers are Gujarat, Maharashtra and Telangana. Output per hectare is high under the irrigated conditions of the north-west, but very low in Maharashtra, where the crop is grown rainfed. The map in Fig. 3.10 shows both cotton and jute together.
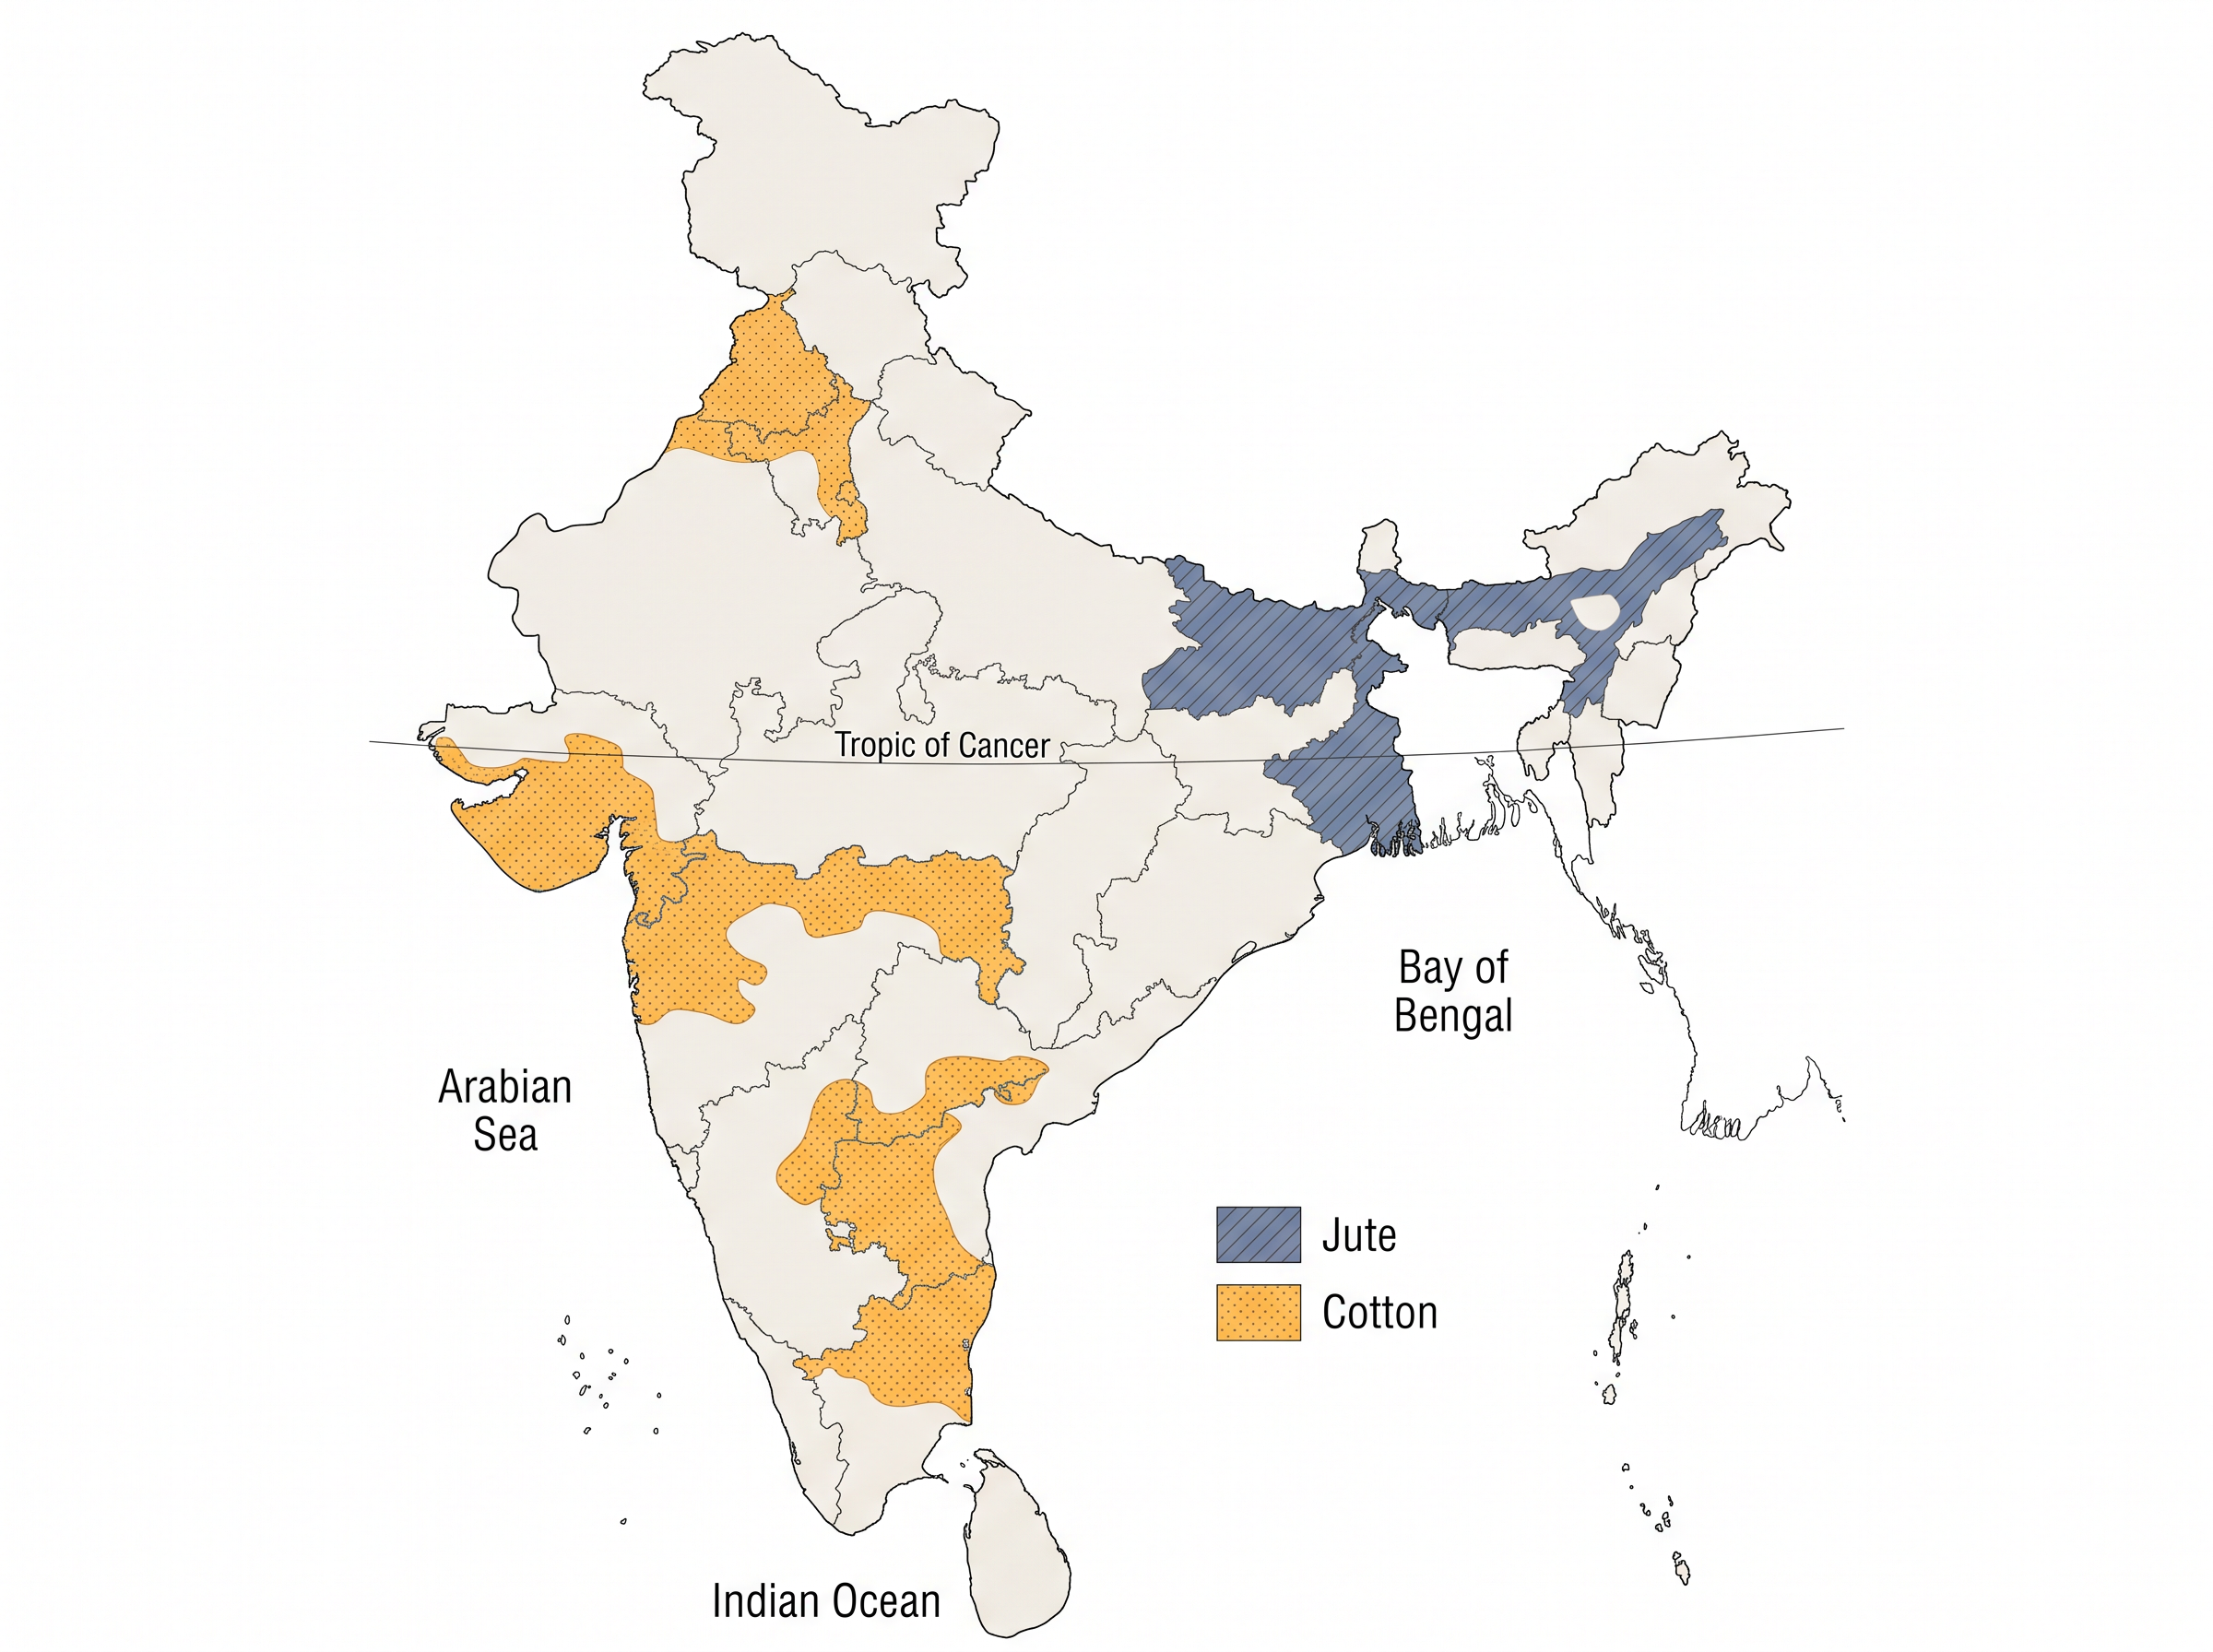
Fig. 3.10 – India: distribution of cotton and jute.
3.4.5.2 Jute
Jute is used for making coarse cloth, bags, sacks and decorative items. It is a cash crop of West Bengal and the adjoining eastern parts of the country. India lost large jute-growing areas to East Pakistan — now Bangladesh — at Partition. At present India produces about three-fifths of the world’s jute, and West Bengal alone accounts for about three-fourths of the country’s output; Bihar and Assam are the other jute-growing areas. Because it is concentrated in just a few states, jute accounts for only about 0.5 per cent of the total cropped area.
3.4.6 Other Crops
Sugarcane, tea and coffee are three other important crops grown in India.
3.4.6.1 Sugarcane
Sugarcane is a crop of the tropical areas. Under rainfed conditions it is grown in the sub-humid and humid climates, but in India it is largely an irrigated crop. In the Indo-Gangetic Plain its cultivation is concentrated in Uttar Pradesh; in western India it is spread over Maharashtra and Gujarat; and in the south it is grown in the irrigated tracts of Karnataka, Tamil Nadu, Telangana and Andhra Pradesh. Fig. 3.11 shows the standing crop.
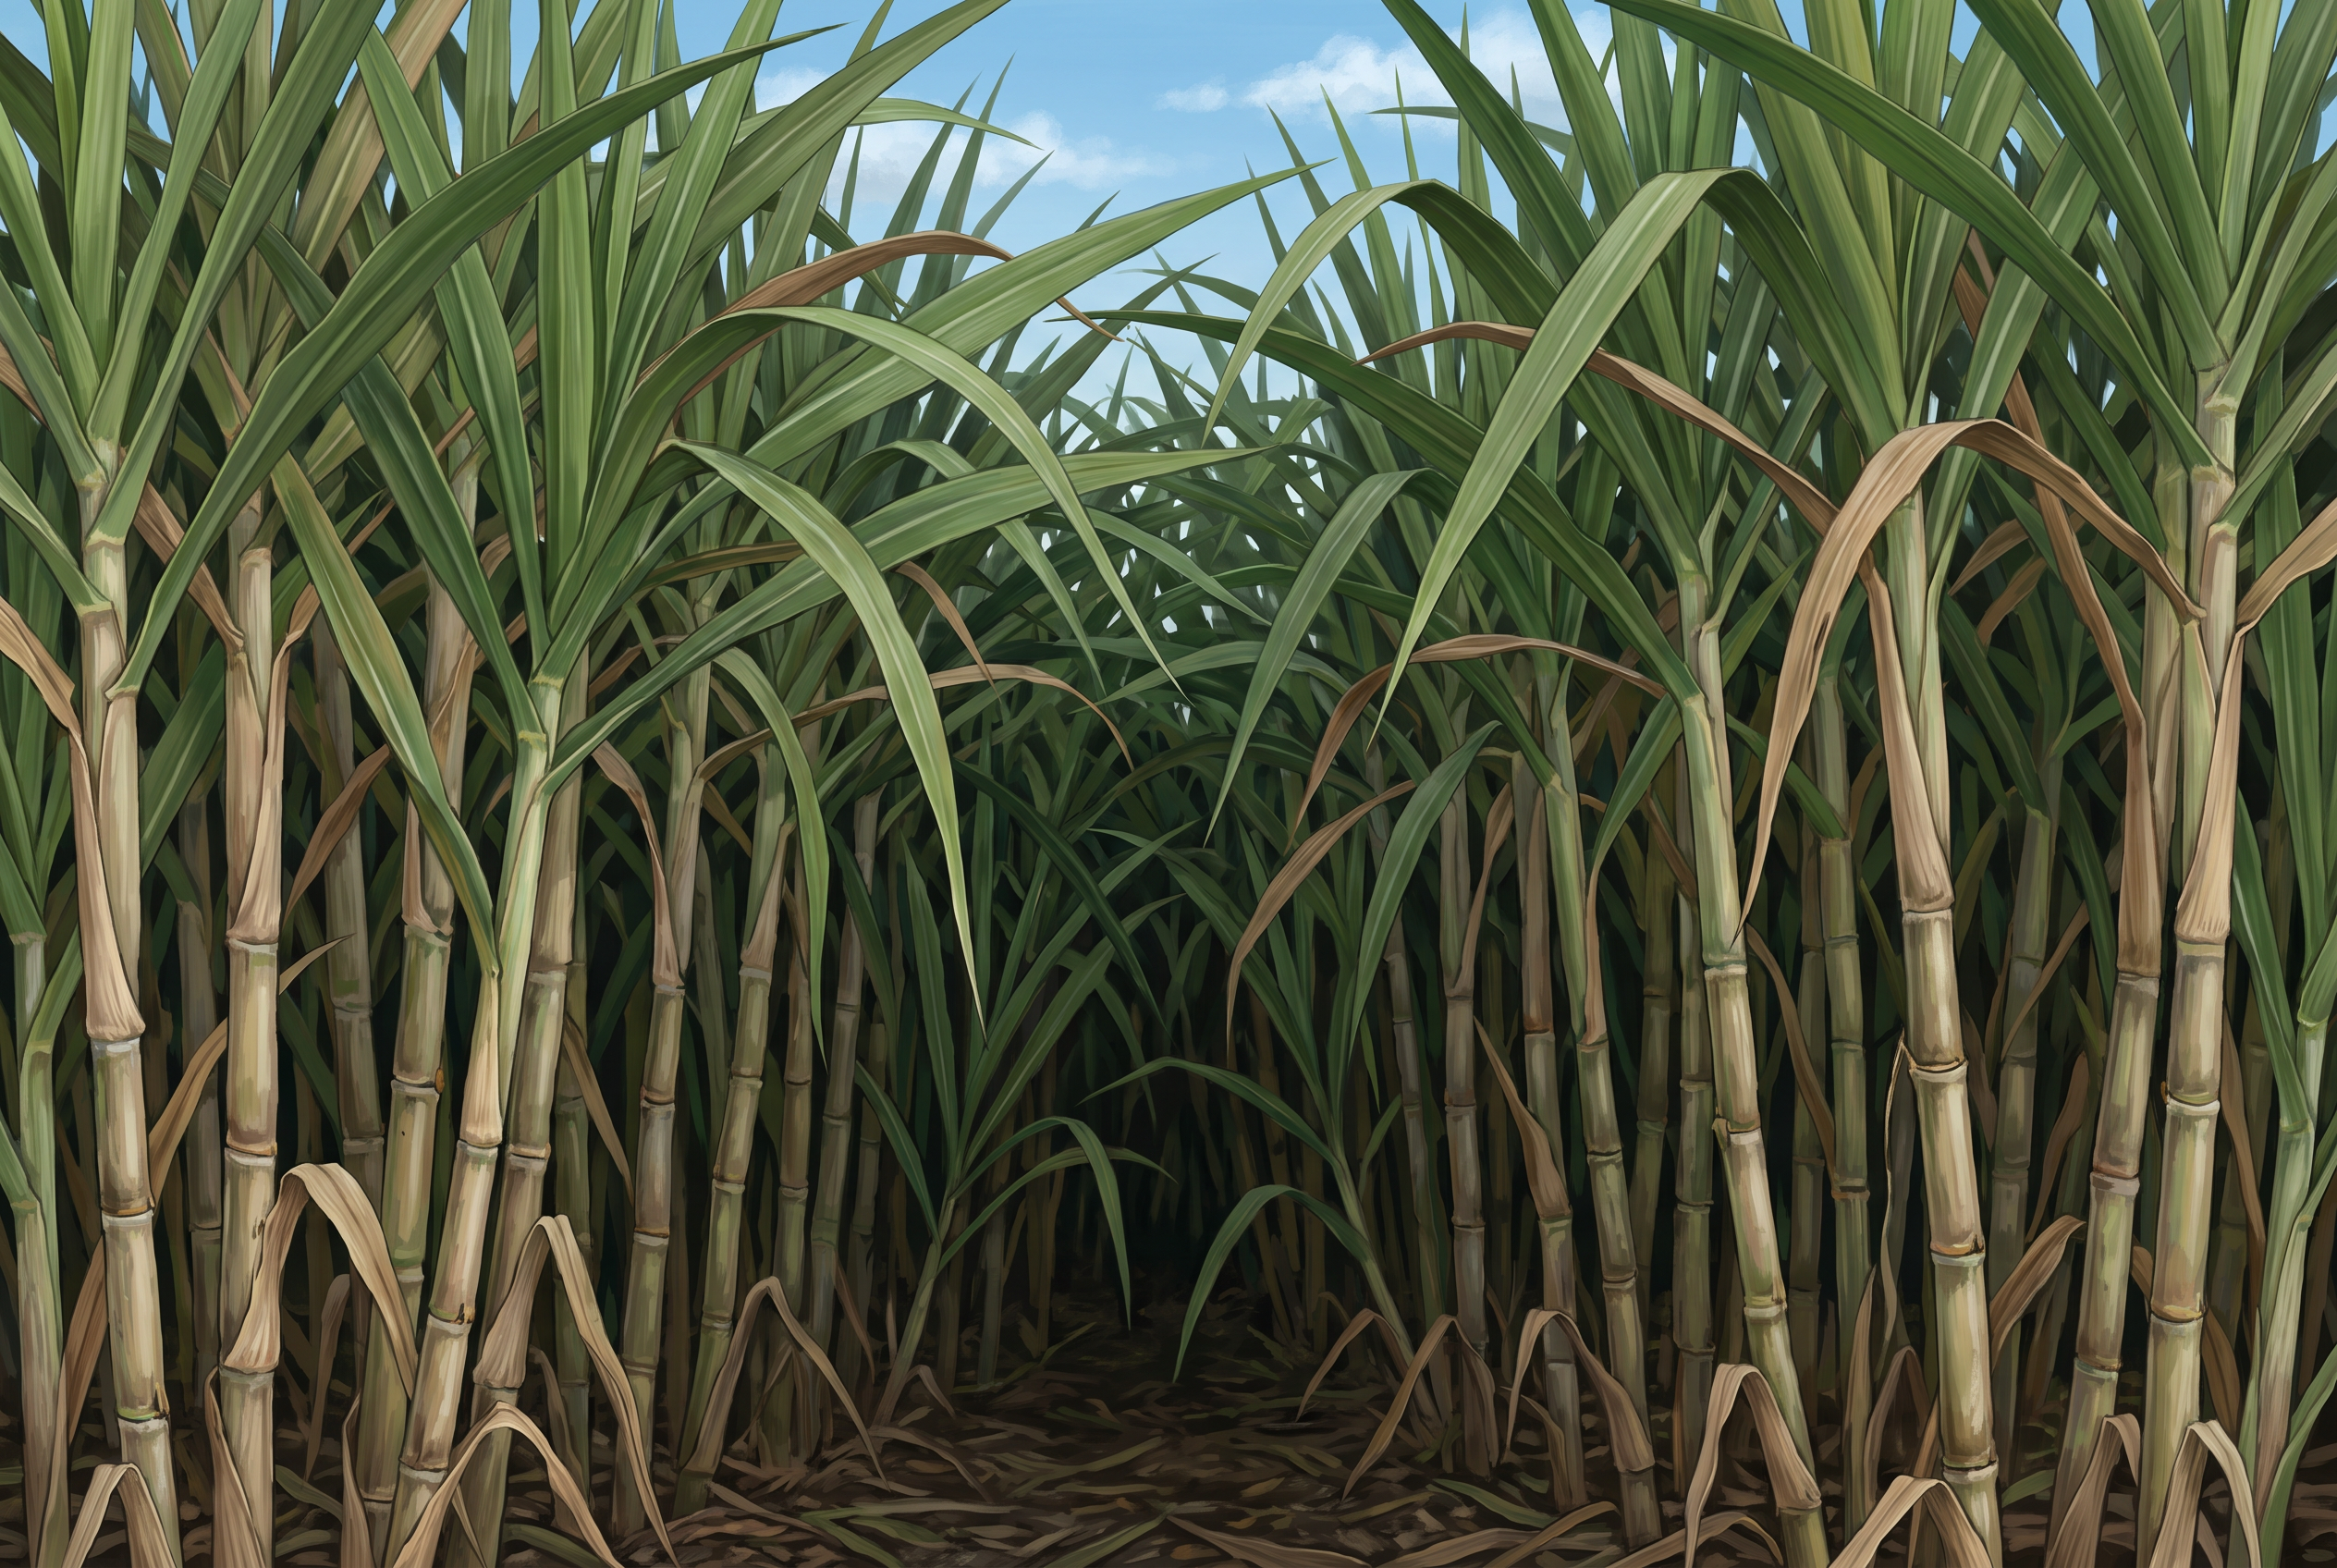
Fig. 3.11 – Sugarcane cultivation.
India was the second-largest producer of sugarcane after Brazil in 2018, accounting for about 19.7 per cent of world production, though it occupies only 2.4 per cent of the country’s total cropped area. Uttar Pradesh produces about two-fifths of the country’s sugarcane. Maharashtra, Karnataka, Tamil Nadu and Andhra Pradesh are the other leading producers, where the yield is high; the yield is low in northern India. The map in Fig. 3.12 shows the crop’s two main belts.
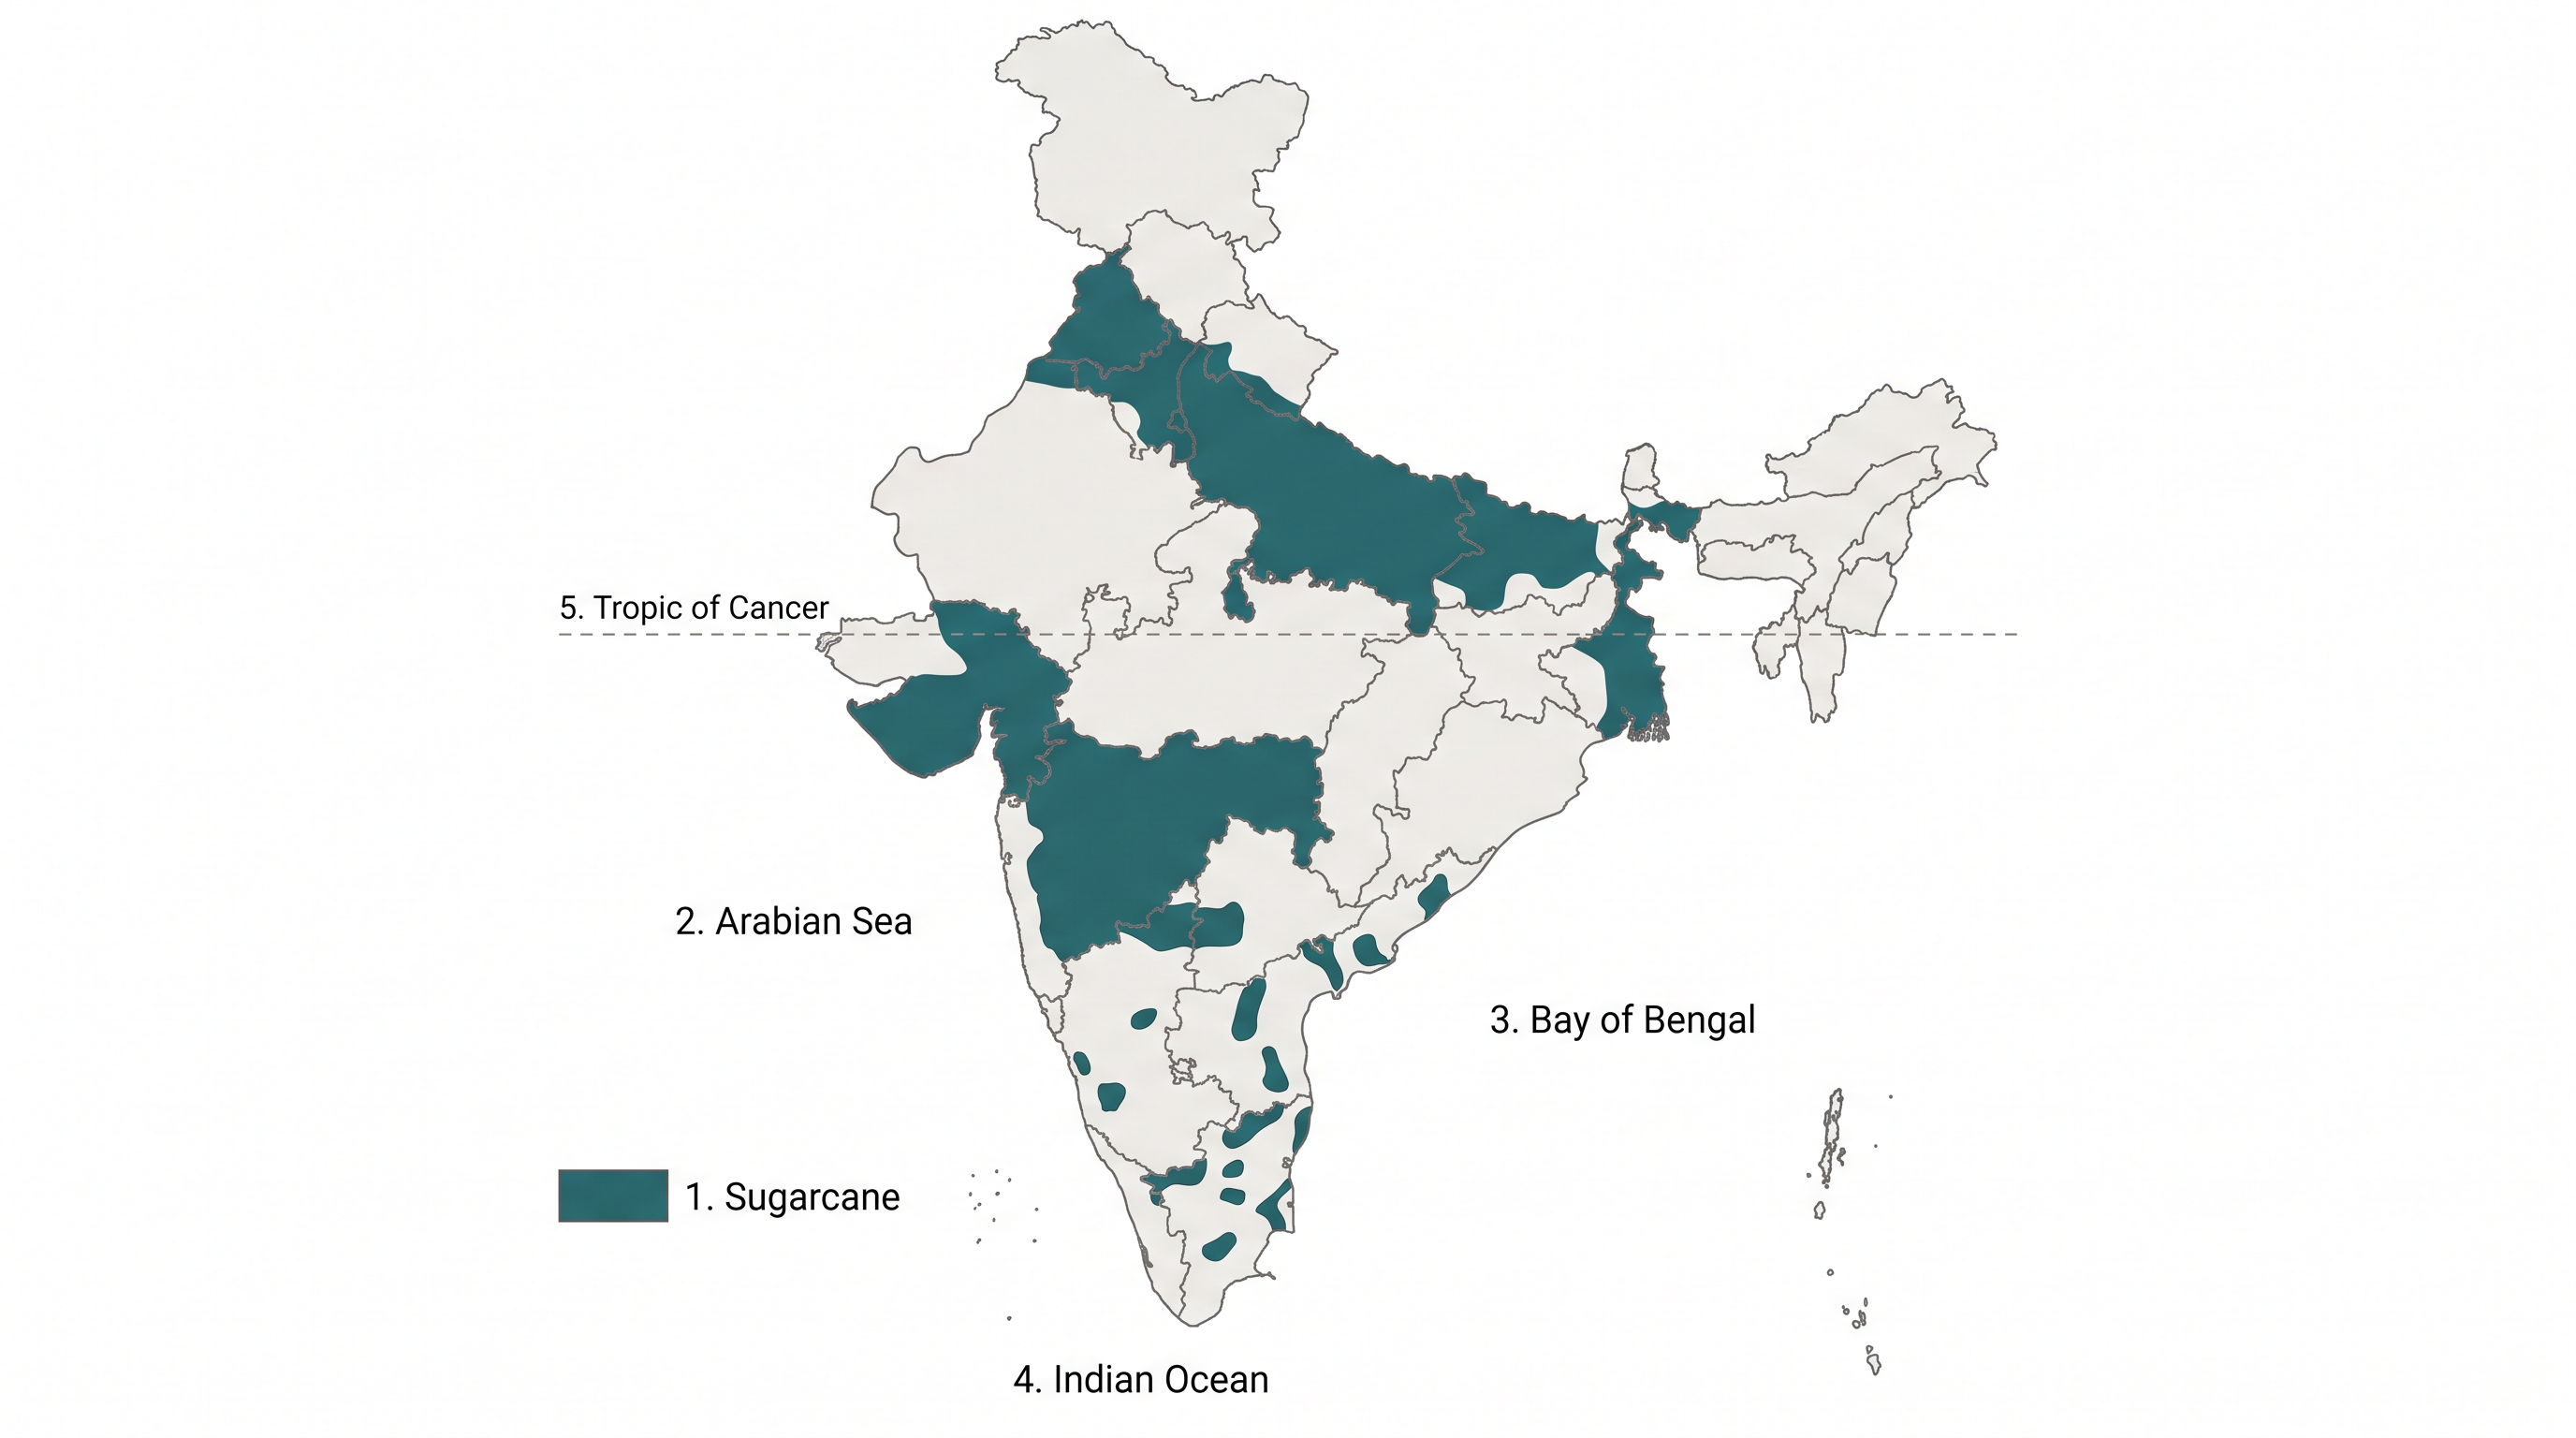
Fig. 3.12 – India: distribution of sugarcane.
3.4.6.2 Tea
Tea is a plantation crop used as a beverage; black tea leaves are fermented while green tea leaves are left unfermented, and the leaves are rich in caffeine and tannin. It is an indigenous crop of the hills of northern China, grown over undulating hilly topography with well-drained soils in the humid and sub-humid tropics and sub-tropics. In India, tea planting began in the 1840s in the Brahmaputra valley of Assam, in the north-east, which is still a major tea-growing area. It was later introduced in the sub-Himalayan region of West Bengal — the Darjeeling, Jalpaiguri and Cooch Behar districts — and it is also grown on the lower slopes of the Nilgiri and Cardamom hills in the Western Ghats of the south. Fig. 3.13 shows a tea garden.
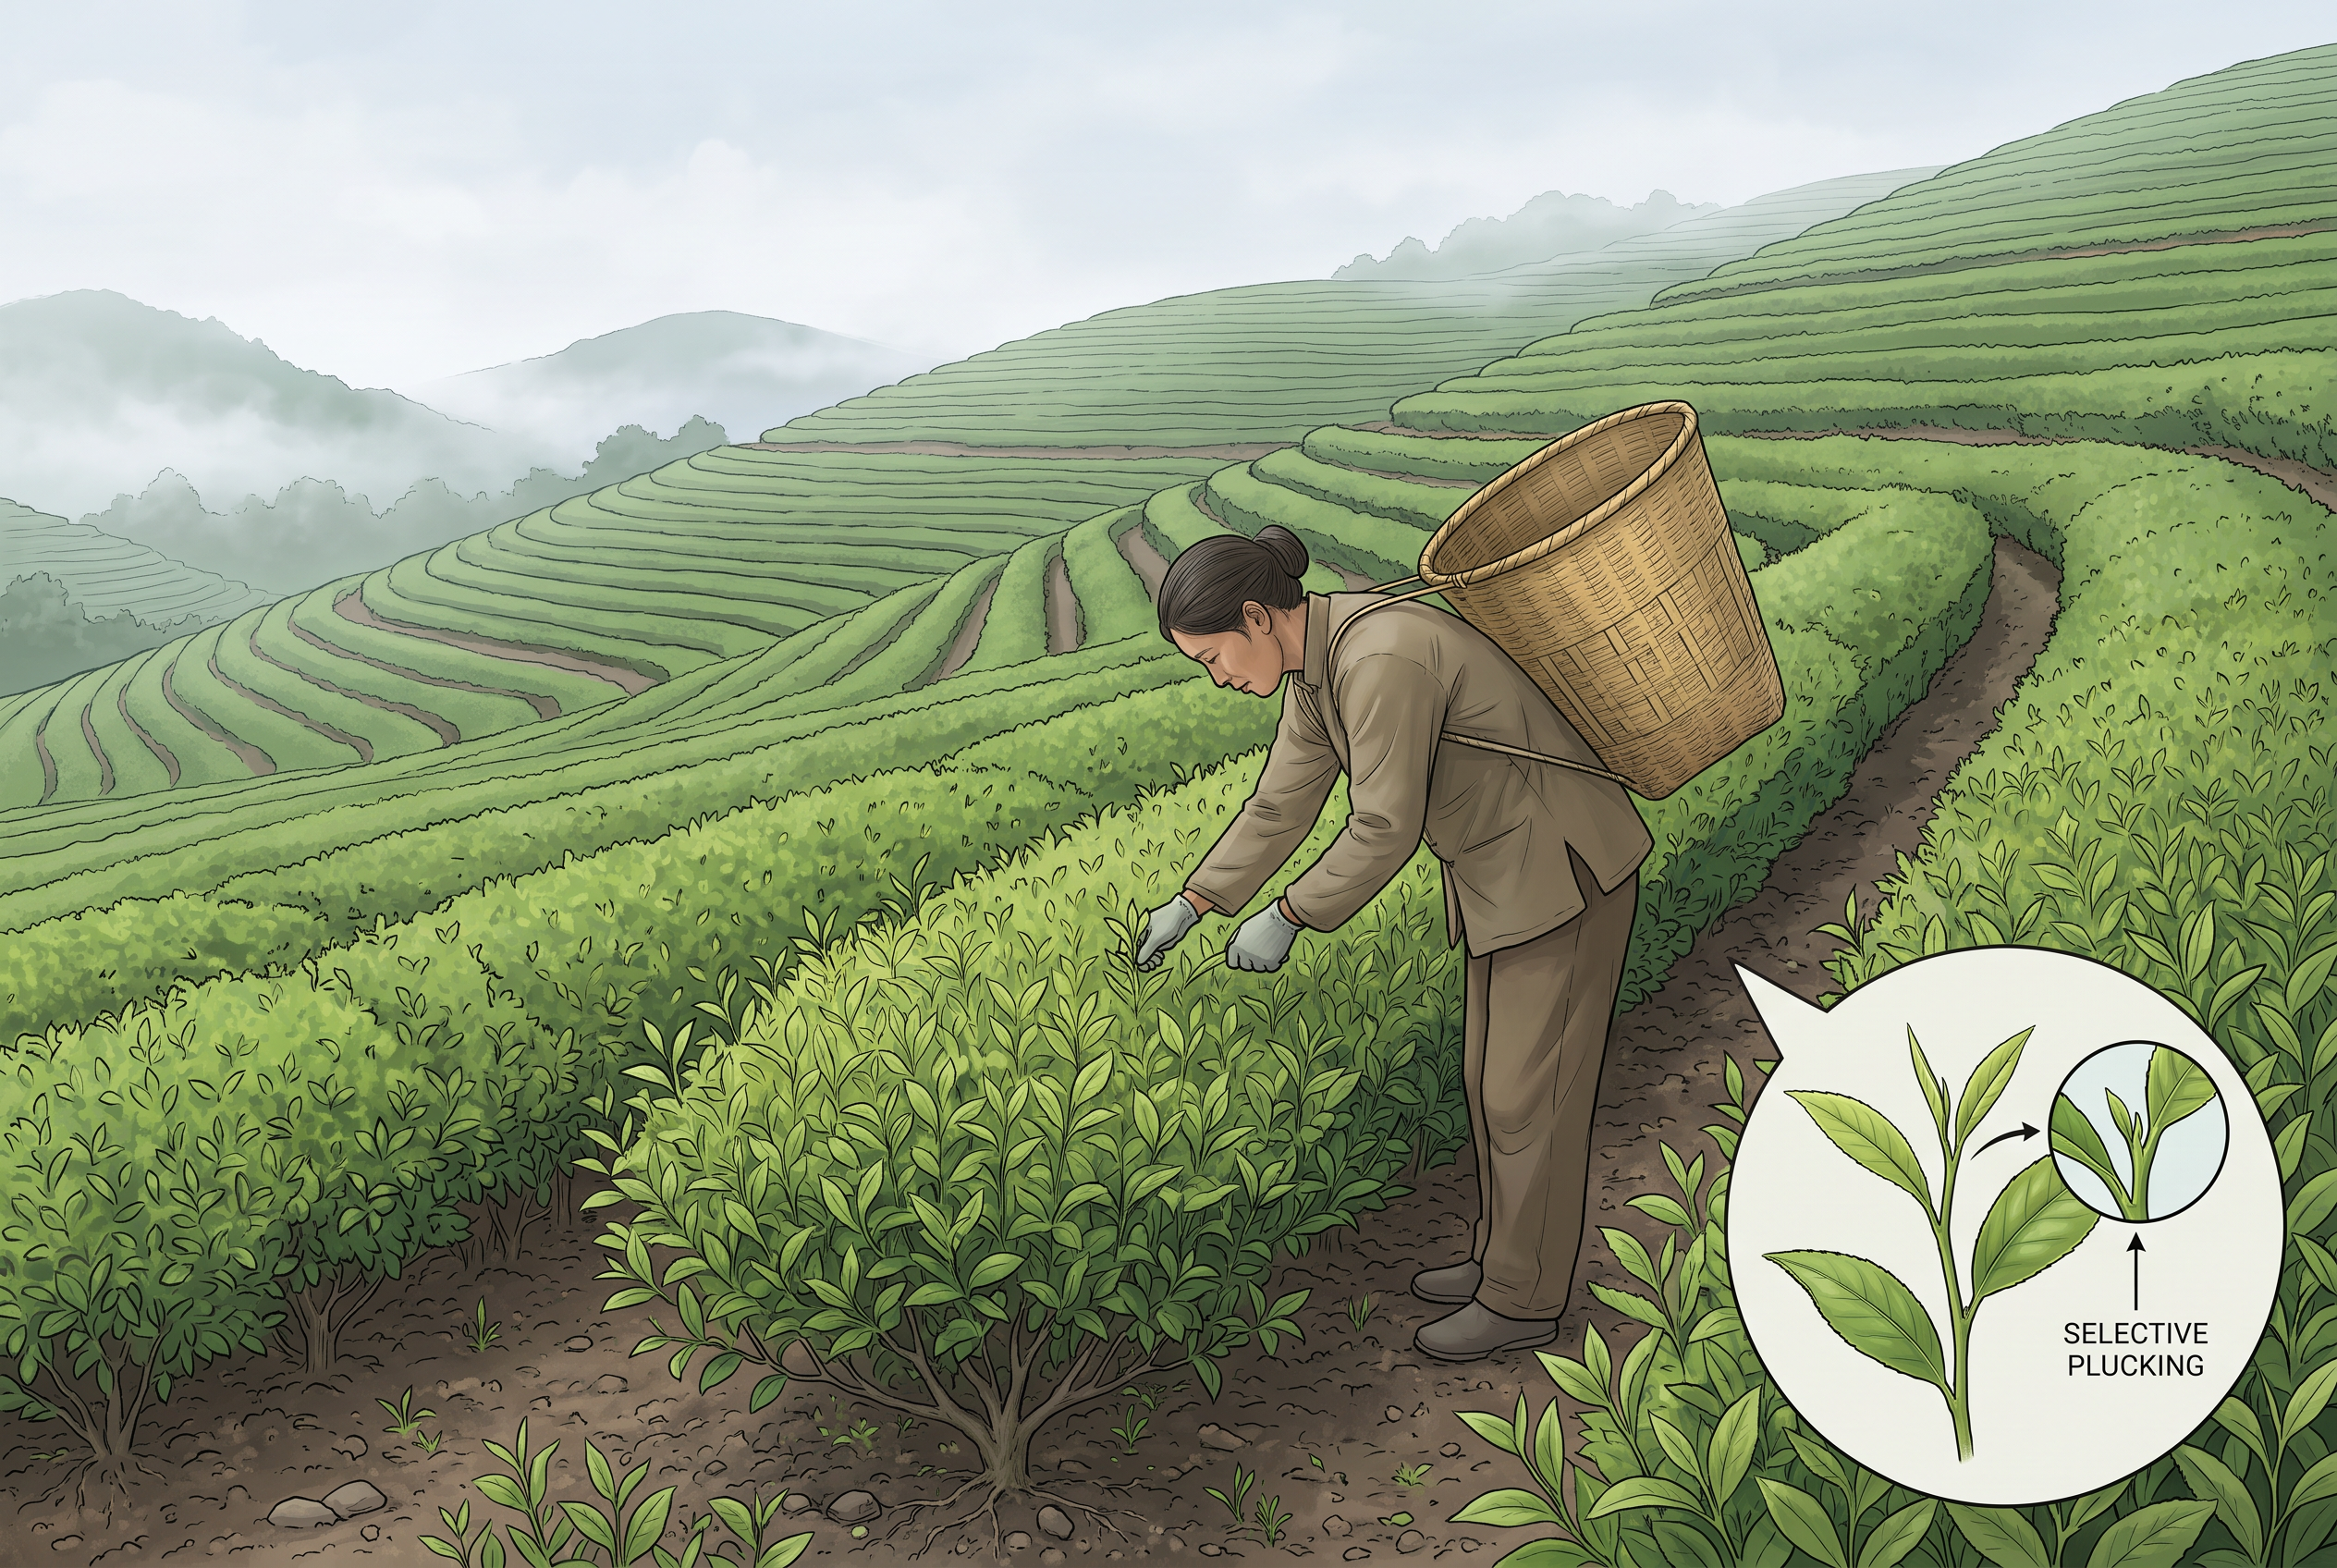
Fig. 3.13 – Tea farming.
India is a leading producer of tea and accounts for about 21.22 per cent of world production (2018). Its share of the international tea market has declined substantially, and it ranks second among tea-exporting countries after China (2018). Assam accounts for about 53.2 per cent of the total cropped area under tea and contributes more than half of the country’s production; West Bengal and Tamil Nadu are the other leading producers. Fig. 3.14 maps both tea and coffee.
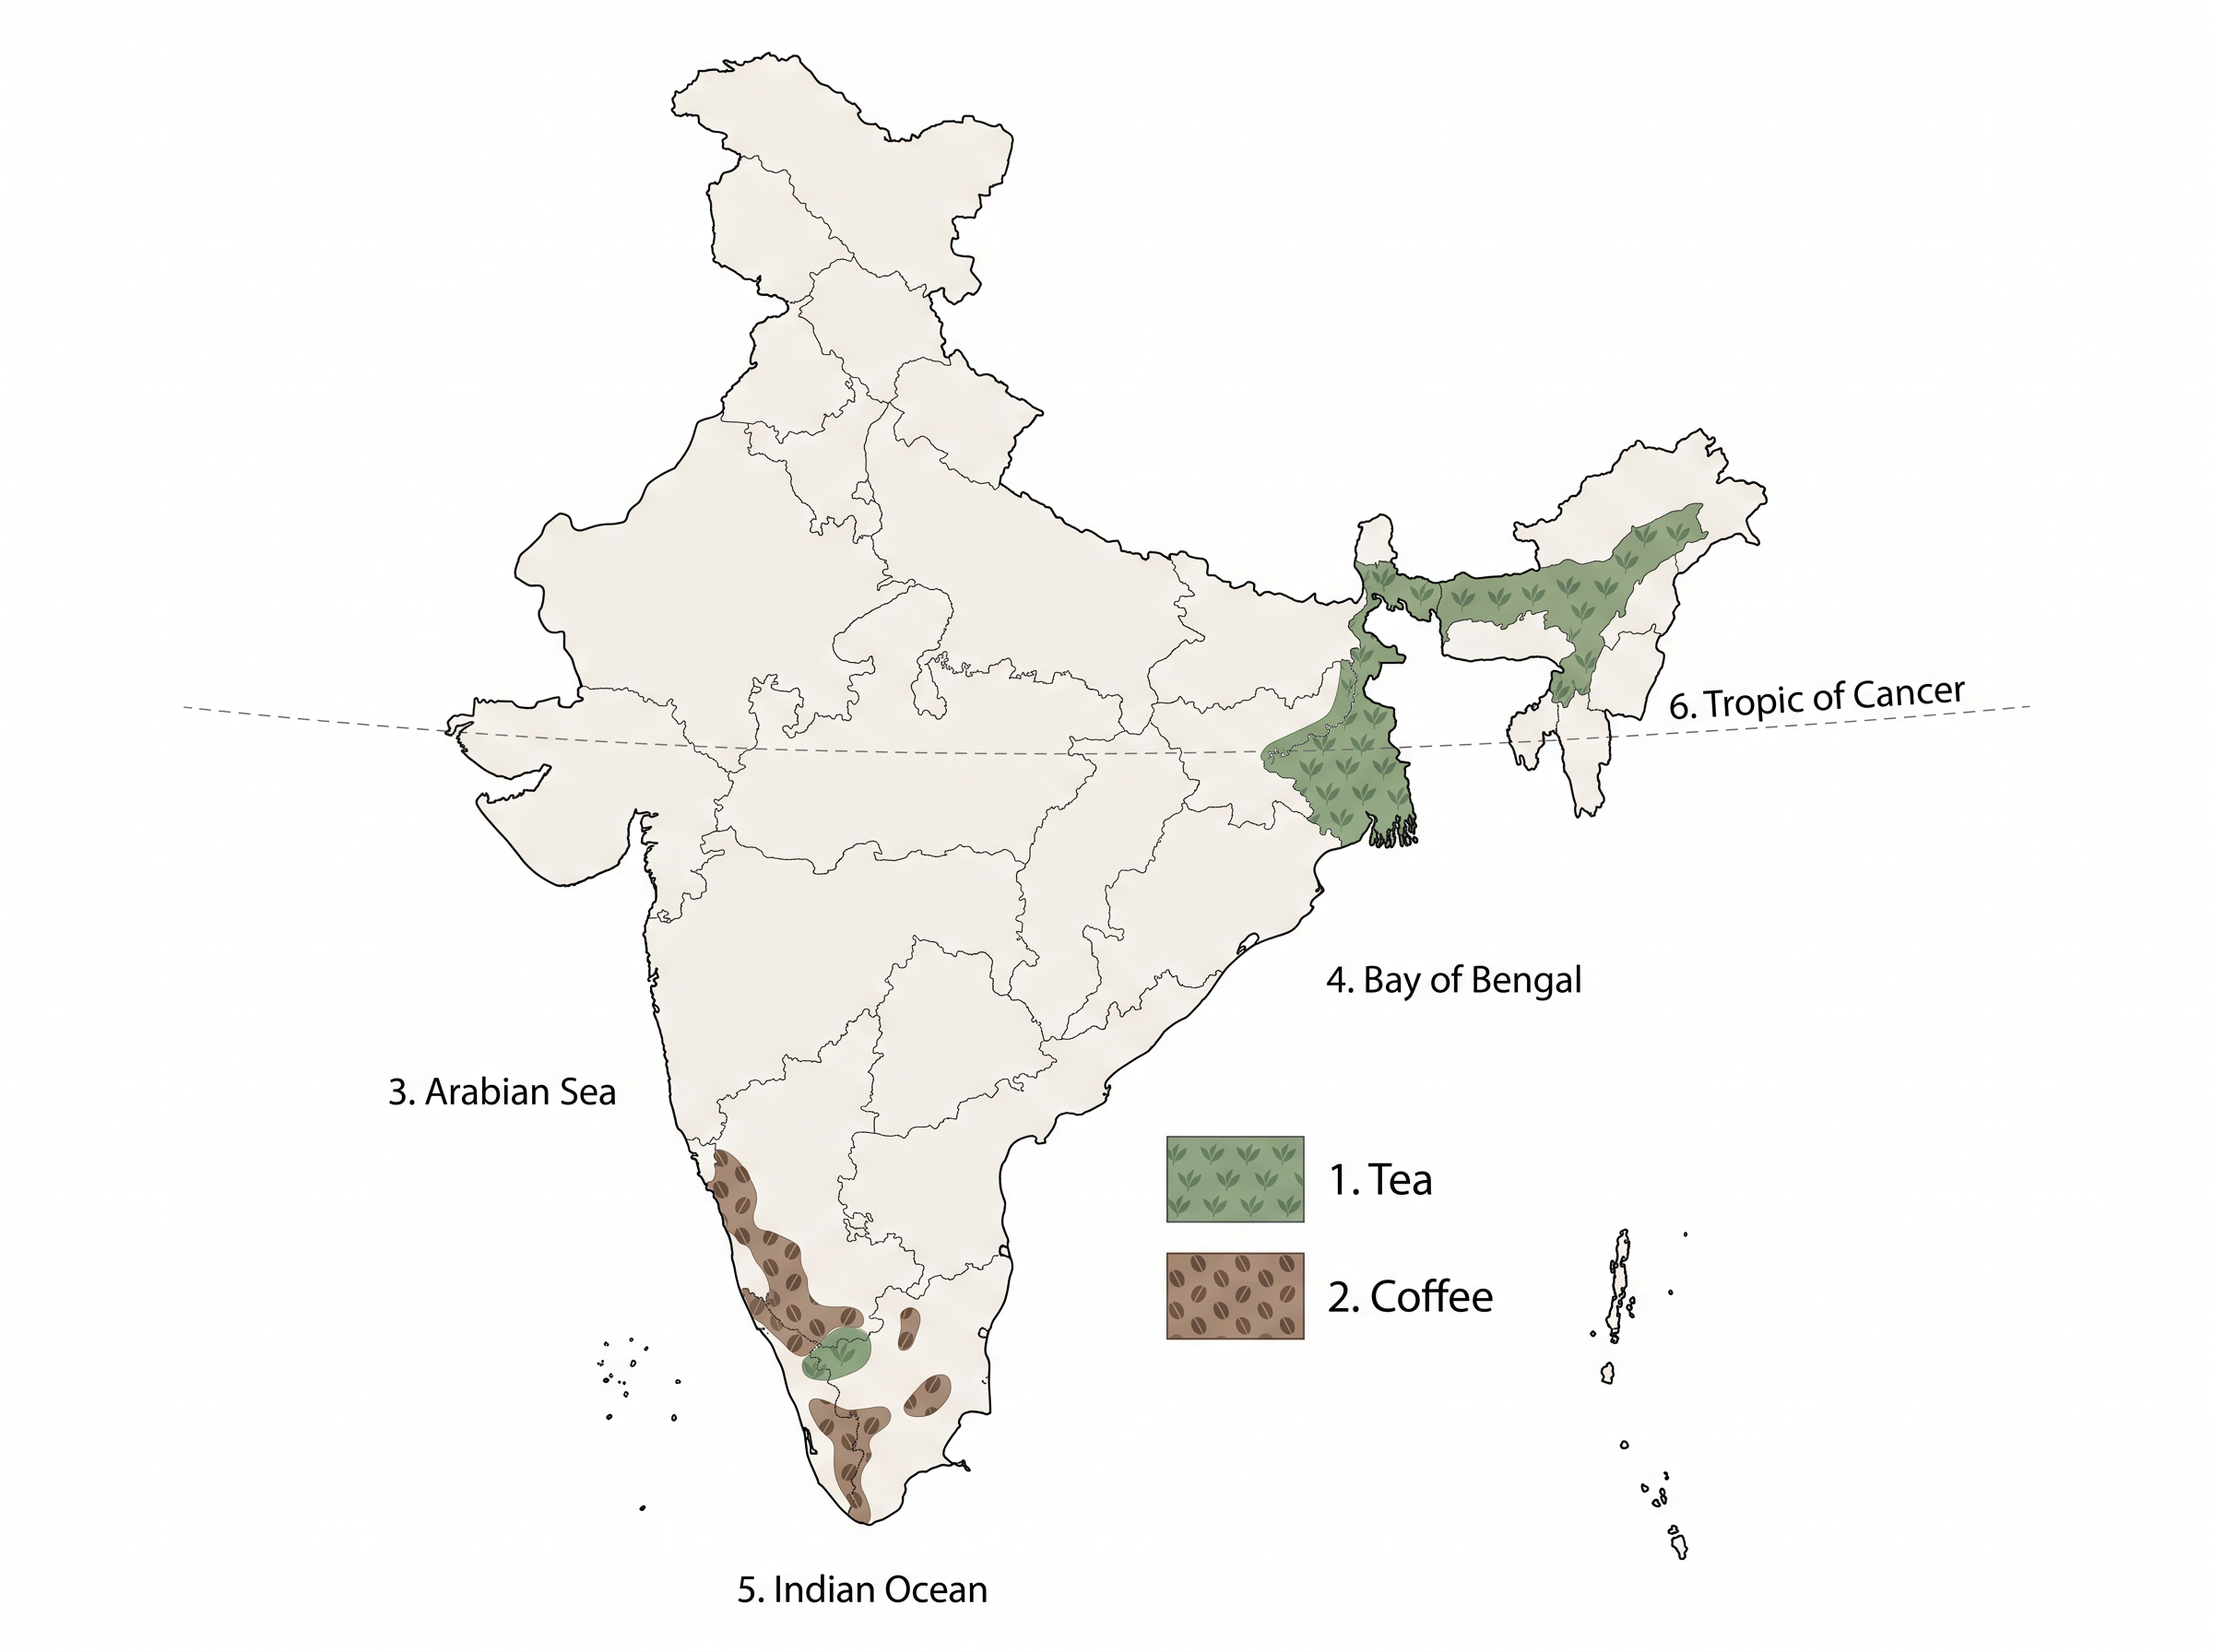
Fig. 3.14 – India: distribution of tea and coffee.
3.4.6.3 Coffee
Coffee is a tropical plantation crop whose seeds are roasted, ground and used to prepare a beverage. There are three varieties — arabica, robusta and liberica — and India mostly grows the superior arabica, which is in great demand in the international market. Even so, India produces only about 3.17 per cent of the world’s coffee and ranked eighth in 2018, after Brazil, Vietnam, Indonesia, Colombia, Honduras, Ethiopia and Peru. Coffee is cultivated in the highlands of the Western Ghats in Karnataka, Kerala and Tamil Nadu, and Karnataka alone accounts for more than two-thirds of the country’s production.
3.5 Agricultural Development In India
For most of the past century, Indian agriculture struggled. Before Independence the farm economy was largely subsistence in nature — farmers grew mainly to feed their own households, with little surplus for sale. Its performance in the first half of the twentieth century was dismal, a period scarred by severe droughts and famines. Partition then dealt a further blow: about one-third of the irrigated land of undivided India passed to Pakistan, which cut the share of irrigated area in independent India just when it was most needed.
After Independence: The First Strategy
After Independence, the Government’s immediate goal was to raise foodgrains production, and it went about this in three ways: by switching from cash crops to food crops, by intensifying cropping on land already cultivated, and by extending the cultivated area, bringing cultivable and fallow land under the plough. This strategy helped at first, but agricultural production stagnated in the late 1950s.
To break the stagnation, two programmes — the Intensive Agricultural District Programme (IADP) and the Intensive Agricultural Area Programme (IAAP) — were launched, concentrating effort on selected districts and areas. But two consecutive droughts in the mid-1960s tipped the country into a food crisis, and foodgrains had to be imported from abroad.
The Green Revolution
The turning point came from new seed. By the mid-1960s, high-yielding varieties (HYVs) — new seed types bred to give far more grain per plant — were available: wheat from Mexico and rice from the Philippines. India adopted them as part of a package technology, combining the HYV seeds with chemical fertilisers, in the irrigated areas of Punjab, Haryana, Western Uttar Pradesh, Andhra Pradesh and Gujarat. Assured soil moisture through irrigation was the basic pre-requisite, because the new seeds could deliver their extra yield only if watered reliably.
The strategy paid dividends almost at once, driving foodgrains production up very fast. This spurt of growth came to be known as the Green Revolution. It also gave a fillip to a range of agro-inputs, agro-processing industries and small-scale industries, and it made the country self-reliant in foodgrain production.
But the Green Revolution had a geography. It was initially confined to the irrigated areas alone, and this led to regional disparities in agricultural development that persisted through the 1970s. Only after that did the technology spread to the Eastern and Central parts of the country.
Balancing The Regions
Aware of these imbalances, the Planning Commission turned its attention to the problems of rainfed agriculture in the 1980s. In 1988 it began agro-climatic planning — planning that groups regions by their climate and soil so that development can be matched to local conditions — to induce more regionally balanced growth. It also stressed the need to diversify agriculture and to harness resources for dairy farming, poultry, horticulture, livestock rearing and aquaculture. Finally, the policy of liberalisation and a free-market economy adopted in the 1990s reshaped the course of Indian agricultural development.
The whole sequence, from a subsistence economy to a liberalised one, is laid out in Timeline Fig. 3.15.
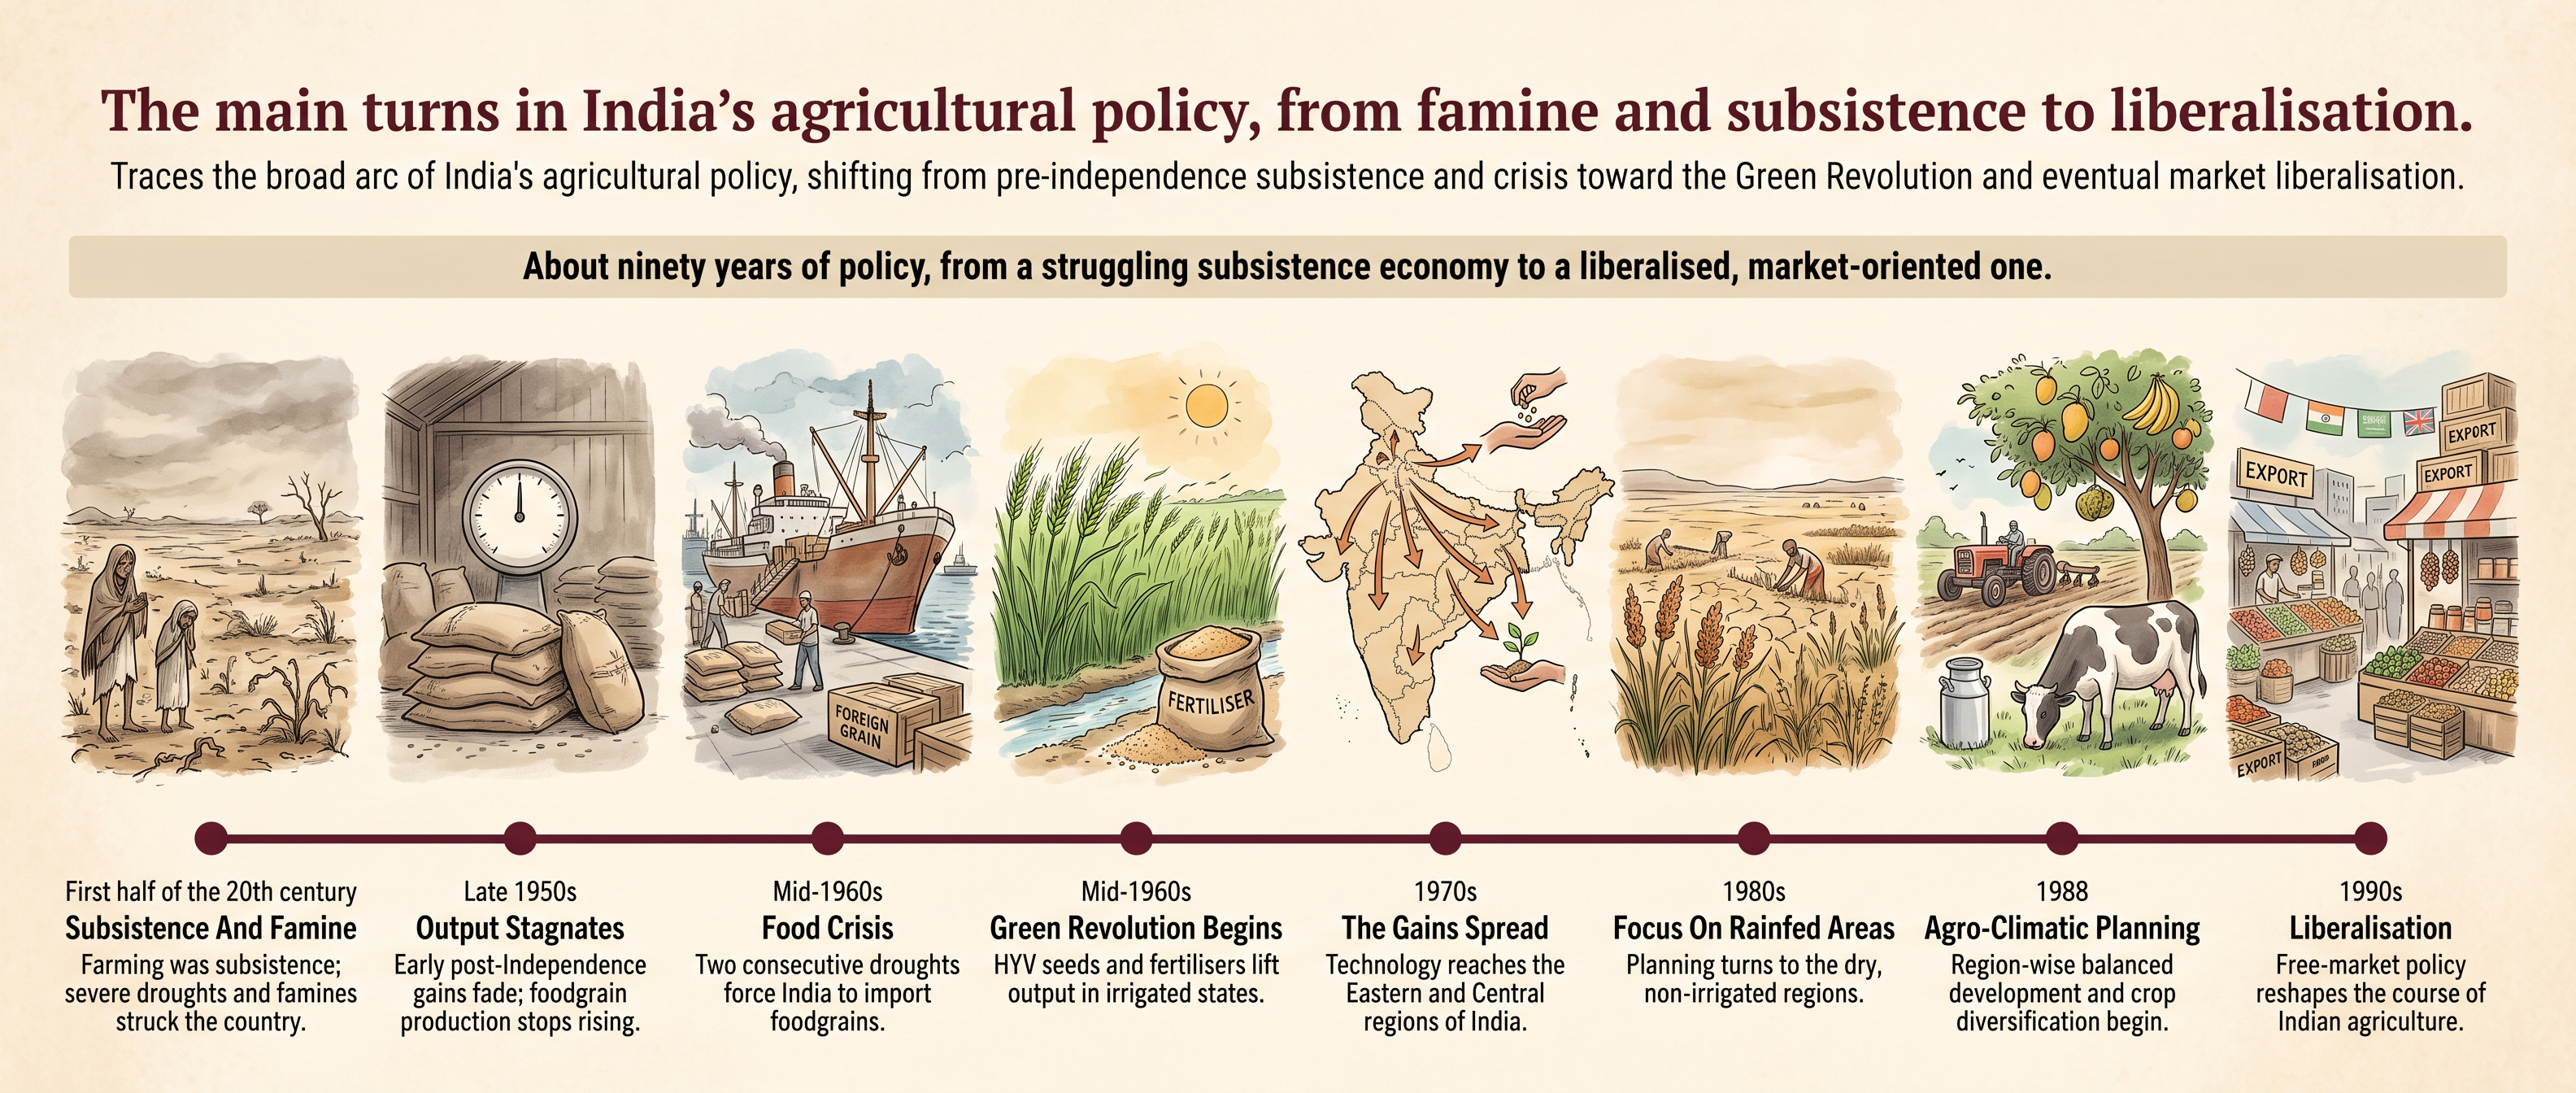
Fig. 3.15 – Agricultural development in India since Independence.
3.5.1 Growth Of Agricultural Output And Technology
The last 50 years have seen a significant rise in agricultural output and a marked improvement in technology. The production and yield of many crops, such as rice and wheat, have risen at an impressive rate, and among the other crops the production of sugarcane, oilseeds and cotton has also increased appreciably.
Behind much of this lies the expansion of irrigation, which has played a crucial role. Assured water provided the basis for introducing modern agricultural technology — high-yielding seeds, chemical fertilisers, pesticides and farm machinery — and the net irrigated area of the country has itself grown. The roto till drill shown in Fig. 3.16 is one example of the modern equipment that has spread across Indian fields.
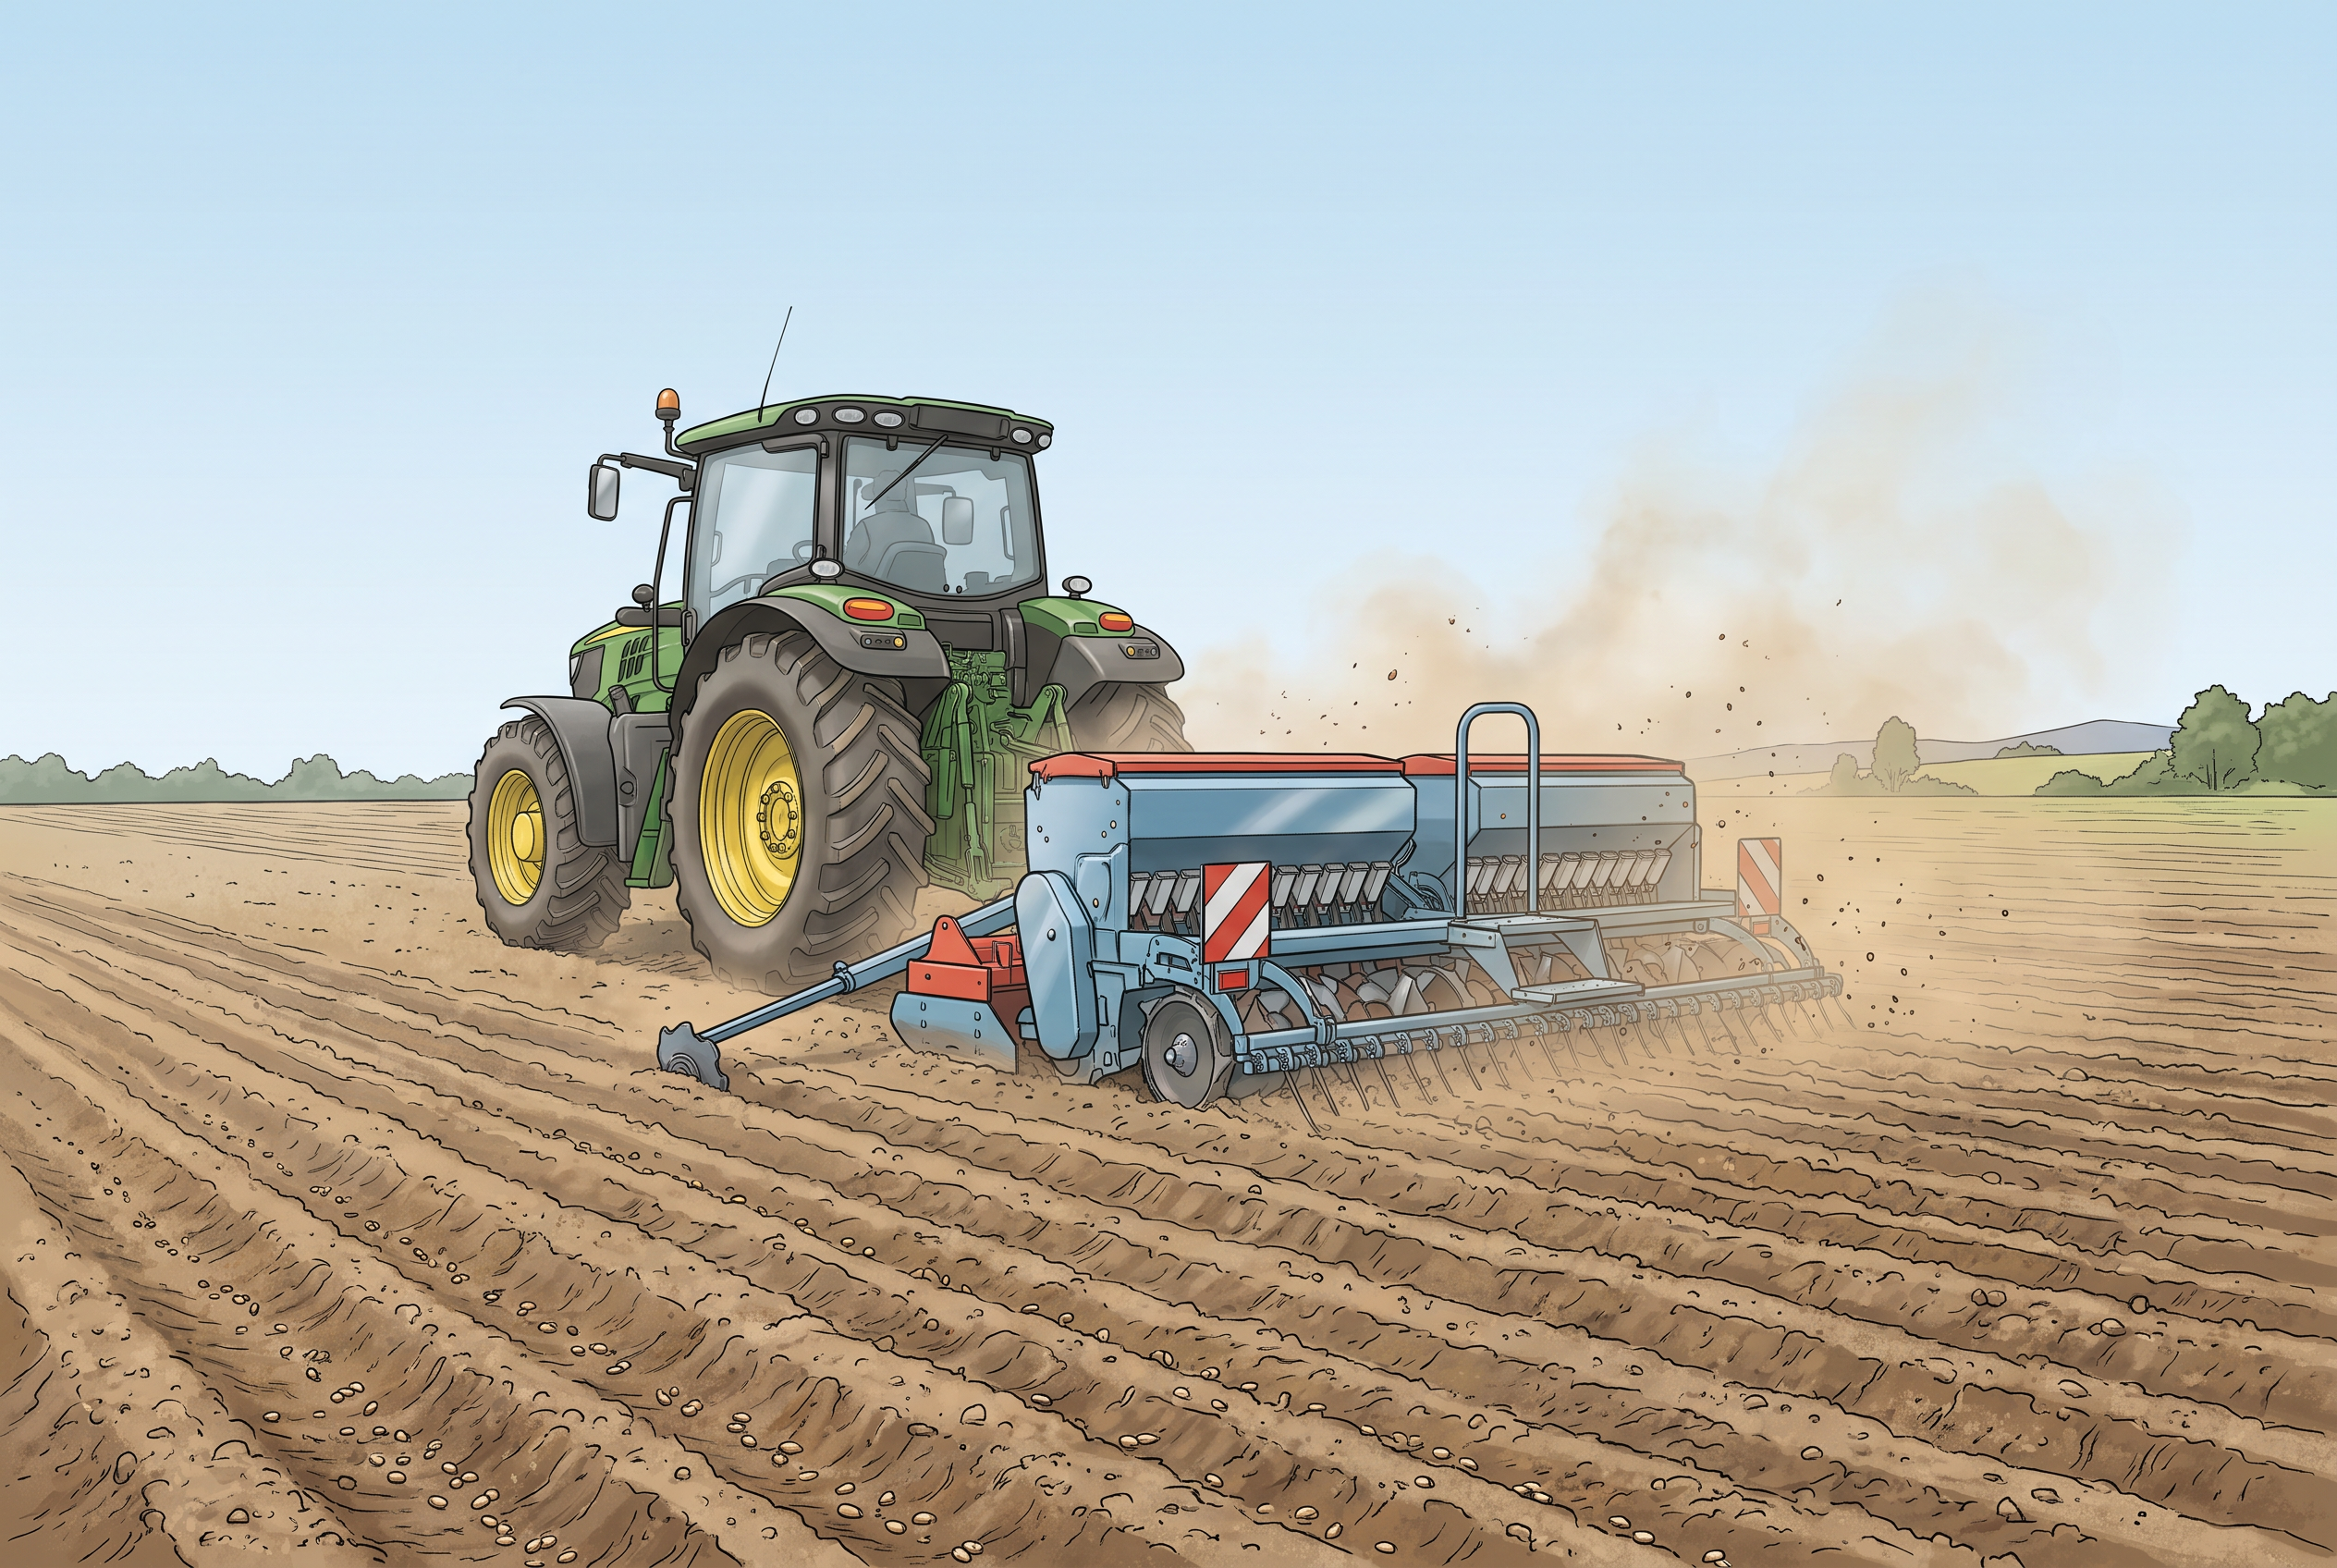
Fig. 3.16 – A roto till drill.
This modern technology has diffused very fast across the country, and two figures capture the scale of the change. The consumption of chemical fertilisers has increased about fifteen times since the mid-sixties. And because the high-yielding varieties are themselves highly susceptible to pests and diseases, the use of pesticides has risen significantly since the 1960s. The gains in output, in other words, came bundled with a steep rise in chemical inputs — a point the chapter returns to when it turns to the problems of Indian agriculture.
3.6 Problems Of Indian Agriculture
The problems that Indian agriculture faces are not the same everywhere. They vary with the agro-ecology of a region — its soils, climate and water — and with its history, so most of them are region-specific. Yet some problems are common across the country, and they range from physical constraints, set by nature, to institutional hindrances, set by how society is organised. The sections below take the common ones in turn.
3.6.1 Dependence On Erratic Monsoon
Irrigation reaches only about 33 per cent of the cultivated area in India. On the remaining two-thirds, crop production depends directly on the rain — and even the irrigated tracts are not safe, because a poor south-west monsoon also cuts the canal water available for irrigation. Where the monsoon fails, both kinds of land suffer together.
The rain itself is uneven and unreliable. In Rajasthan and other drought-prone areas it is too meagre to depend on, while even the regions of high annual rainfall see considerable fluctuations from year to year. This double exposure leaves land vulnerable to both droughts and floods. Drought is common in the low-rainfall areas, which may then, in another year, face occasional floods — the flash floods in the drylands of Maharashtra, Gujarat and Rajasthan in 2006 and 2017 are examples. Droughts and floods remain the twin menace of Indian agriculture.
3.6.2 Low Productivity
The yield of crops in India is low compared with the international level. The per hectare output of most crops — rice, wheat, cotton and oilseeds among them — is much lower than in the U.S.A., Russia and Japan. Labour productivity is low too, because the pressure of people on the land is so high that each worker’s output is small. The vast rainfed areas of the country, especially the drylands that grow coarse cereals, pulses and oilseeds, pull the average down with their low yields.
3.6.3 Constraints Of Financial Resources And Indebtedness
The inputs of modern agriculture — improved seed, fertiliser, pesticide, machinery — are expensive, and this resource-intensive approach has become unmanageable for marginal and small farmers, who have very little saving, or none, to invest. To bridge the gap, most such farmers borrow, taking credit from institutions and from moneylenders. When crops then fail or returns stay low, they cannot repay, and they slide into a trap of indebtedness.
3.6.4 Lack Of Land Reforms
The Indian peasantry was exploited for a long time, because land was distributed very unequally. Among the three revenue systems that operated during the British period — Mahalwari, Ryotwari and Zamindari — the last was the most exploitative for the peasants. After Independence, land reforms were made a priority, but they were not carried through effectively, for want of strong political will. Most state governments avoided the politically tough decisions that would have gone against the strong lobbies of landlords. Because the reforms were never implemented, the inequitable distribution of cultivable land has continued — and it holds agricultural development back.
3.6.5 Small Farm Size And Fragmentation Of Landholdings
India has a very large number of marginal and small farmers, and the average size of a holding is shrinking under rising population pressure — as land passes down the generations, each share gets smaller. Worse, the holdings are mostly fragmented, scattered in separate pieces rather than gathered in one block. There are states where consolidation of holdings has never been carried out even once; and even where it has been done once, a second round is now needed, because the holdings have fragmented again as land was divided among the owners of the next generation. Small, fragmented landholdings of this kind are uneconomic to farm.
3.6.6 Lack Of Commercialisation
A large number of farmers grow crops for their own consumption rather than for sale. They simply do not have enough land to produce more than they need, so most small and marginal farmers grow foodgrains meant for their own family. Modernisation and commercialisation of agriculture have taken place, but mainly in the irrigated areas, where the land can yield a surplus. The chapter reproduces recent newspaper reports on shifts in the farm sector and cropping pattern as a prompt for discussion.
3.6.7 Vast Underemployment
There is massive underemployment in Indian agriculture, particularly in the unirrigated tracts. In these areas the seasonal unemployment runs from 4 to 8 months of the year. Even during the cropping season, work is not available throughout, because most agricultural operations are not labour-intensive — they need many hands only at sowing and harvest. So the people engaged in farming do not get the chance to work round the year, and their labour stays idle for long stretches.
3.6.8 Degradation Of Cultivable Land
One of the most serious problems arises out of a faulty strategy of irrigation and agricultural development: the degradation of the land resource itself. It is serious because it can deplete the soil’s fertility, and it is particularly alarming in the irrigated areas. A large tract of agricultural land has lost its fertility through the alkalisation and salinisation of the soil — the build-up of salts and alkalis that poison it — and through waterlogging. The excessive use of chemicals such as insecticides and pesticides has left them concentrated in toxic amounts in the soil profile.
There is a further, quieter loss. In the irrigated areas, leguminous crops — the pulses that fix nitrogen and restore the soil — have been displaced from the cropping pattern, and the duration of fallow has been cut sharply by multiple cropping. Together these have obliterated the natural fertilisation that nitrogen fixation used to provide. The rainfed areas are not spared either: in the humid and semi-arid tropics they suffer degradation of several kinds, such as soil erosion by water and by wind, often set off by human activity.
Before leaving the chapter’s account of these problems, it is worth turning them on your own surroundings: prepare a list of the agricultural problems of your own region, and ask how far they match, and how far they differ from, the common problems set out here. The point of the exercise is that the region-specific problems this chapter began with are best seen in the fields you know.
3.7 Summary
- Land is a single resource put to many competing uses. The land revenue department records it in nine categories that add up to the reporting area, which differs from the fixed geographical area measured by the Survey of India.
- Because land is fixed in area while the economy grows and changes, land is re-sorted between categories: a fall in one usually shows up as a rise in another.
- Between 1950–51 and 2019–20, the shares of net sown area, non-agricultural use, forest, permanent pasture and current fallow rose, while barren and culturable wastelands, tree crops and groves, and long fallow declined.
- Actual increase and rate of increase are different measures. A category rising from a small base can post a high rate while adding little land, which is why non-agricultural use shows the highest rate of increase.
- Common property resources — community-owned land yielding fodder, fuel and minor forest products — are a lifeline for the landless, for marginal farmers and for women, and they are being degraded.
- Total cultivable land is net sown area plus all fallow lands plus culturable wasteland. Its scope to expand is nearly exhausted, so raising cropping intensity and adopting land-saving technology matter greatly for a land-scarce, labour-rich country.
- The north has three cropping seasons — kharif, rabi and zaid — a distinction that fades in the south, where crops can be grown for much of the year.
- Farming is classified by its main source of moisture into irrigated, which may be protective or productive, and rainfed, which may be dryland or wetland.
- Foodgrains occupy about two-thirds of the cropped area, split into cereals (fine and coarse) and pulses. The chapter surveys rice, wheat, jowar, bajra, maize, pulses, the oilseeds, the fibre crops cotton and jute, and the plantation crops sugarcane, tea and coffee — each with its own climate, regions and share of the cropped area.
- Agricultural development moved from subsistence and famine, through post-Independence food-production strategies and the Green Revolution, to a focus on rainfed regions, agro-climatic planning and liberalisation. Output and the use of chemical inputs have both risen sharply.
- Indian agriculture still faces common problems: dependence on an erratic monsoon, low productivity, indebtedness, weak land reforms, small and fragmented holdings, lack of commercialisation, vast underemployment and the degradation of cultivable land.
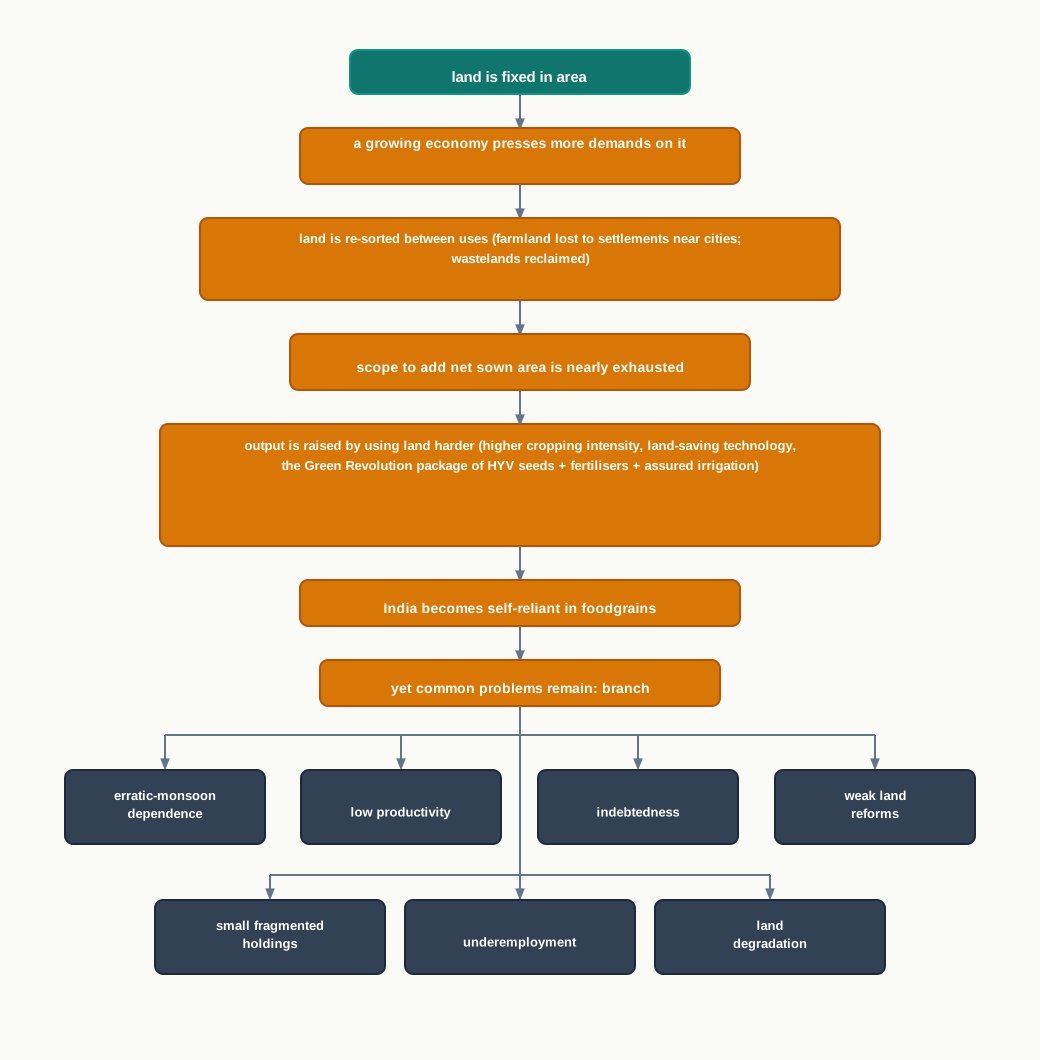
Fig. 3.17 – India’s fixed land, agricultural response and common problems.
What This Chapter Cannot Tell You
The land-use figures are shares of the reporting area at just two years, so they hide the path between those years, cannot show the absolute area in square kilometres, and smooth over the sharp year-to-year swings in categories like current fallow. The national crop shares, rankings and yield levels say nothing about the wide gaps inside a country — between one state’s districts, or between an irrigated field and a rainfed one in the same region. And every figure here is tied to a particular year, such as 2018 or 2019–20; the chapter cannot tell you where any of these numbers stands today.
3.8 NCERT Questions
- Which one of the following is NOT a land-use category?
- Fallow land
- Marginal land
- Net Area Sown
- Culturable Wasteland
- What one of the following is the main reason due to which share of forest has shown an increase in the last forty years?
- Extensive and efficient efforts of afforestation
- Increase in community forest land
- Increase in notified area allocated for forest growth
- Better peoples’ participation in managing forest area
- Which one of the following is the main form of degradation in irrigated areas?
- Gully erosion
- Wind erosion
- Salinisation of soils
- Siltation of land
- Which one of the following crops is not cultivated under dryland farming?
- Ragi
- Jowar
- Groundnut
- Sugarcane
- In which of the following group of countries of the world, HYVs of wheat and rice were developed?
- Japan and Australia
- U.S.A. and Japan
- Mexico and Philippines
- Mexico and Singapore
- Differentiate between barren and wasteland and culturable wasteland. (30 words)
- How would you distinguish between net sown area and gross cropped area? (30 words)
- Why is the strategy of increasing cropping intensity important in a country like India? (30 words)
- How do you measure total cultivable land? (30 words)
- What is the difference between dryland and wetland farming? (30 words)
- What are the different types of environmental problems of land resources in India? (150 words)
- What are the important strategies for agricultural development followed in the post-independence period in India? (150 words)
3.9 Check Your Concepts
- Distinguish between reporting area and geographical area. Which of the two changes over the years, and why?
- What is the difference between protective irrigation and productive irrigation in terms of their objective and the amount of water applied?
- Why are common property resources especially important to the landless, to marginal farmers and to rural women?
- In Table 3.1, net area sown is 45.6 per cent of the reporting area but 79.0 per cent of the total cultivable land in 2019–20. Explain why the same category shows two different percentages.
- Using the shares in Fig. 3.2, work out both the actual increase and the rate of increase in the share of forests between 1950–51 (17.0 per cent) and 2019–20 (23.4 per cent). Show each step. Which of the two measures is the larger, and why?
- Punjab and Haryana are not traditional rice-growing areas, yet they now record high rice yields. Explain why rice succeeds there.
- Reconstruct, in order, the chain of steps by which a fixed piece of land near a growing city shifts from agricultural to non-agricultural use.