Chapter 8: International Trade
Off the coast of Gujarat, at the mouth of the Gulf of Kachchh, a tanker sits low and heavy in the water. It is loaded with crude oil — the single largest item India buys from the rest of the world. The harbour it is bound for, Deendayal Port at Kandla, cannot take a ship this deep at its main berths without holding up every other vessel behind it. So the crude is pumped out here instead, at an offshore terminal at Vadinar, and carried to the mainland by pipeline. The ships keep moving; the oil keeps flowing.
That one tanker is a small piece of a very large habit. India sells goods to other countries and buys goods from them, and for decades it has bought more than it has sold. Almost all of this exchange arrives and leaves through a handful of coastal gateways, because water carries heavy cargo more cheaply than any road, rail or aircraft can.
What crosses those gateways has changed completely in seventy years. A country that once queued for imported food now sends manufactured goods abroad and spends its largest import bill on fuel. The story of India’s trade is the story of what it needed then, what it makes now, and the ports that let it happen.
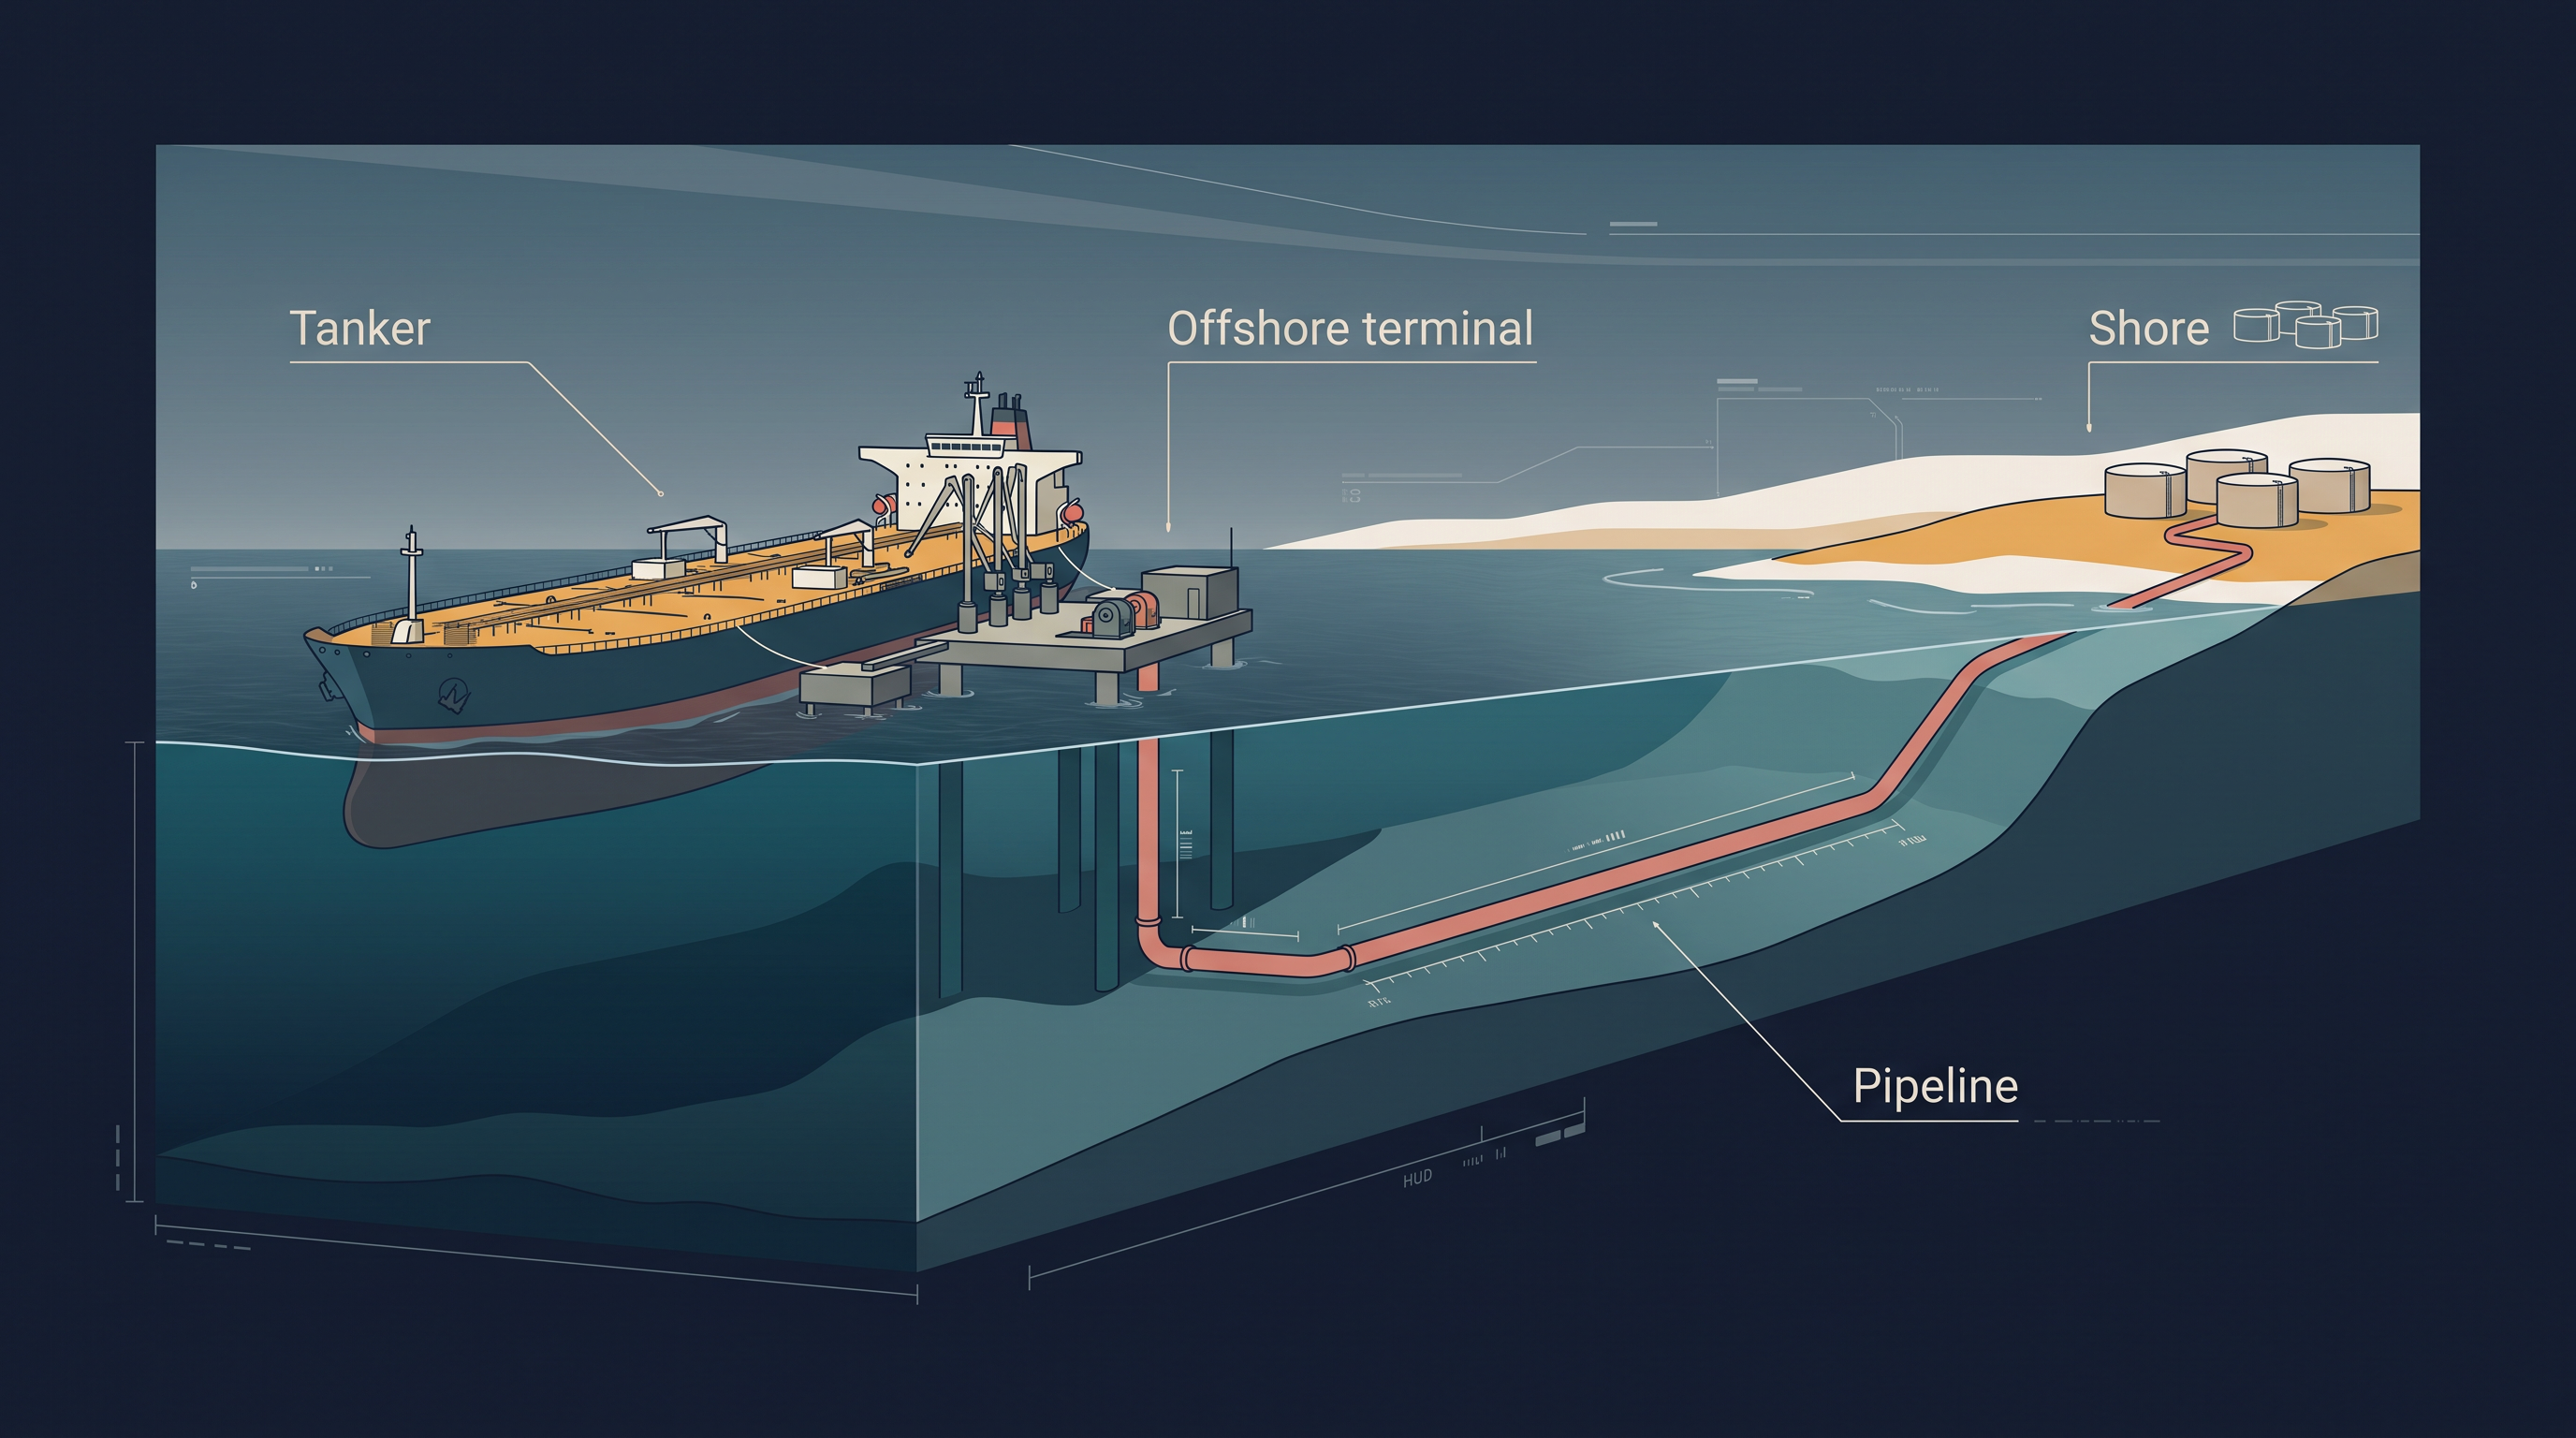
Fig. 8.0 – Offshore unloading of crude oil.
8.1 The Changing Nature Of India’s International Trade
International trade is the exchange of goods and services across national borders — buying from other countries and selling to them. It is also called external trade, to set it apart from trade carried on within a country’s own borders. You met its general ideas in the companion book, Fundamentals of Human Geography; this chapter turns to India in particular.
No country grows, mines or makes everything it needs. Trade lets each one bring in what it lacks by selling what it has to spare. That is why trade is mutually beneficial: both sides come away with something they could not have produced as cheaply, or at all, at home.
India’s trade has changed along three lines at once. Its volume is the total worth of goods moving in and out. Its composition is which goods those are. Its direction is the set of countries India trades with. Each of these has shifted over the decades, and the sections that follow take them one by one.
India accounts for only about one per cent of the total volume of world trade. That share sounds small, but world trade is vast, and even one per cent of it leaves India with a significant part to play in the world economy.
A Trade That Keeps Growing
The scale of India’s trade has risen steeply. In 1950-51 its external trade was worth Rs. 1,214 crore. By 2020-21 it had reached Rs. 77,19,796 crore. A jump that large is hard to grasp until it is turned into a percentage, so it is worth working out in full.
A rise of that order is not an accident. The chapter names three forces behind it. Manufacturing gathered momentum, giving India more goods worth selling abroad. Government policy grew more liberal, easing the licences, duties and restrictions that had once held trade back. And India spread its trade across a wider range of markets rather than depending on a few. Together these turned a small trickle of overseas trade in 1950-51 into the large flow of today.
Why Imports Outrun Exports
The nature of India’s foreign trade has changed too, and this is where the strain shows. The total volume of both imports and exports rose, as Table 8.1 sets out — but the value of imports stayed higher than the value of exports throughout.
The difference between the two is the trade balance. When exports earn more than imports cost, the balance is favourable, or positive. When imports cost more than exports earn, the balance is unfavourable, or negative — a trade deficit. India’s balance has stayed negative, and every figure in the last column of Table 8.1 carries a minus sign.
Using the export column of Table 8.1, you can draw a bar diagram across these years, one coloured bar per year, to see the export trend at a glance.
The same widening gap is drawn as two lines in Fig. 8.1. The imports line runs above the exports line at every point, and the space between them stretches sharply by 2021-22.
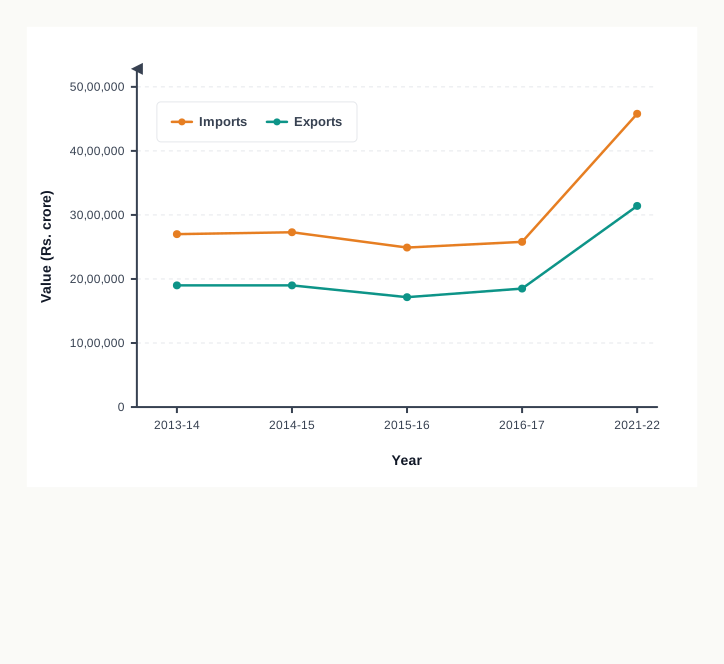
Fig. 8.1 – India’s exports, imports and widening trade deficit.
8.2 Changing Pattern of the Composition of India’s Exports
A trade’s composition is the mix of goods that make it up — not how much is traded, but what. The composition of India’s exports has been shifting steadily, and Table 8.2 sets out that shift as the percentage share each group of commodities holds from 2015-16 to 2021-22.
What Rose And What Fell
Reading across the rows, the pattern the chapter draws out is clear. Between 2015-16 and 2021-22 the share of agriculture and allied products and of manufactured goods fell. The share from crude and petroleum products and from other commodities rose. Ore and minerals held a small and roughly steady share throughout.
That fall in the manufactured-goods share needs care, because it is easy to misread. A smaller share is not the same as a smaller amount. When total exports are growing, a group can hold a thinner slice of the pie and still be worth more rupees than before. As we are about to see in Table 8.3, manufactured goods remain by a wide margin the largest thing India sells abroad, even with their share down from 72.9 per cent to 67.8 per cent.
Where The Actual Money Is
Table 8.3 turns from shares to rupees. It gives the value of some principal export commodities in 2021-22, so it shows size directly rather than proportion.
Pick out the major commodities in Table 8.3 and draw a bar diagram of their 2021-22 export values to see how far manufactured goods tower over the rest.
Manufactured goods are items made in factories from raw materials — machinery, vehicles, textiles, chemicals and the like. This single group alone accounted for 67.8 per cent of India’s total value of exports in 2021-22, and within it engineering goods have grown strongly. Gems and jewellery, too, make up a large share of India’s foreign trade. India’s chief rivals in these goods are China and the other East Asian countries, whose factories compete for the same overseas buyers.
The composition of agricultural exports is changing as well. Traditional items — long-established export goods such as cashew — have been losing ground, largely to tough international competition. In their place, newer and often higher-value goods have grown: floricultural products, meaning flowers grown for commercial sale, together with fresh fruits, marine products and sugar.
8.3 Changing Patterns of the Composition of India’s Import
India’s import basket has been remade at least as thoroughly as its exports. What a country buys from abroad is a good record of what it cannot yet make enough of at home, and for India that has changed from food to fuel.
From Food Shortage To Self-Sufficiency
During the 1950s and 1960s India faced serious food shortage. The major items it imported then were foodgrain, together with capital goods, machinery and equipment. Capital goods are the machines and equipment used to make other goods, rather than things people buy to use up directly.
Because imports ran well ahead of exports in these years, India’s balance of payment — the full account of money it received from and paid to the rest of the world — stayed adverse, meaning more went out than came in. This held true in spite of import substitution, the deliberate policy of making goods at home to replace what had been bought abroad.
The turning point on food came after the 1970s. Foodgrain imports were discontinued thanks to the success of the Green Revolution — the leap in foodgrain output from the late 1960s, driven by high-yielding seeds, chemical fertilisers and expanded irrigation. Having learned to feed itself, India no longer needed to buy grain from abroad.
The Rise Of The Fuel Bill
Food left the import basket, but fuel walked in to fill it. The energy crisis of 1973 pushed up the price of petroleum, and with it India’s whole import budget. Foodgrain was effectively replaced by fertilisers and petroleum. Alongside these, machine and equipment, special steel, edible oil and chemicals came to make up much of the basket.
Table 8.4 sets out the changing shape of imports as percentage shares. It shows a clear rise in petroleum products, which India uses not only as a fuel but also as a raw material for industry.
A rising fuel share is a sign of two things at once. It marks a country that is industrialising and living at a better standard, since machines and modern life both run on energy. It also marks a country exposed to sudden price rises in the international oil market, which arrive without warning and push the bill higher.
Two import trends run the other way. The share of capital goods has kept up a steady decline, and the import of food and allied products has fallen. Beyond these, India’s other major imports include pearls, precious and semi-precious stones, gold and silver, and non-ferrous metals — metals other than iron, such as copper and aluminium. The detail of these principal imports for 2021-22 is set out in Table 8.5.
Table 8.5 rewards a few minutes of work. Arrange its items from largest to smallest and name the top five imports of 2021-22; then pick the five biggest and five smallest and draw a bar diagram of them. One item stands out at once — petroleum, oil and lubricants (POL), the fuel imports the table sets apart. Its size is worth measuring against the whole import bill.
More than a quarter of everything India buys from abroad is a single fuel. That is why a jump in world oil prices — like the one after the 1973 energy crisis — never stays at the petrol pump. It lifts the entire import bill, widens the trade deficit, and works its way into the price of almost anything that must be moved or made. A country importing so much of its energy is tied to events in oil markets it does not control.
The import list also raises a question worth carrying with you: why does India, an agriculturally rich country, still import edible oils worth Rs. 1,41,532 crore? And which of these imported items — fertilisers, chemicals, edible oils — could in time be produced at home instead? These are exactly the questions a reader of a trade table should be asking.
8.4 Direction of Trade
The direction of trade is the set of countries and regions a nation trades with. India has trade relations with most of the countries of the world, and with its major trading blocks — groups of countries that agree to trade on easier terms among themselves. Where its exports go and its imports come from is the third of the three changes this chapter follows.
Table 8.6 sets out India’s imports region by region for 2021-22, with 2016-17 alongside for comparison.
You can turn Table 8.6 into a multiple bar diagram — two bars per region, one for each year — to picture the major trading partners side by side.
India’s Trade Leans Toward Asia
One region stands far above the others. ASEAN — the Association of Southeast Asian Nations, a trading block of Southeast Asian countries — grouped together with the rest of Asia, supplies more imports than Europe, Africa, North America and Latin America combined. It is worth measuring exactly how far it leads.
Nearly two-thirds of India’s imports from these regions come from within Asia itself. India’s heaviest trade is with its own neighbourhood, not with the distant West. This single figure captures the direction of India’s import trade more sharply than any list of countries could — though, as the table’s caption warns, it counts imports alone and says nothing about where India’s goods are sold.
Widening The Door
India aims to double its share in international trade within the next five years, and has already begun adopting measures to get there. It has eased import liberalisation, loosening the old restrictions on bringing goods in. It has cut import duties — the taxes charged on imported goods. It has carried out delicensing, removing the government licences once needed to trade or produce. And it has shifted from process to product patents, so that a product itself is protected, not merely one method of making it.
Most of India’s foreign trade is carried through sea and air routes. Only a small portion moves by land, along routes to the neighbouring countries of Nepal, Bhutan, Bangladesh and Pakistan. The next two sections take up these routes in turn — first the sea ports that handle the bulk of the trade, then the airports that carry its lightest and most valuable share.
8.5 Sea Ports as Gateways of International Trade
Almost everything India trades leaves or arrives by sea, and it does so through its ports. India is surrounded by water on three sides and has a long coastline, which gives it many places to build them. Water is also the cheapest surface over which to move heavy cargo, as long as the sea stays calm — a still surface offers little resistance, so a ship can carry far more, far more cheaply, than any lorry or aircraft.
Two words run through this whole section, and it helps to pin them down. A harbour is a stretch of sheltered water, natural or built, where ships can lie safely at anchor. A port is a harbour fitted out with the berths, cranes and yards needed to load, unload and handle goods and passengers. Every port is a harbour; not every harbour becomes a port.
Behind each port lies its hinterland — the inland region it serves, whose goods flow out through it and whose imports flow in through it. India has such a long tradition of seafaring that many coastal places carry the suffix pattan, meaning port. One curious pattern stands out: India’s west coast has more ports than its east coast. It is worth asking why the two coasts differ in this way as you read on.
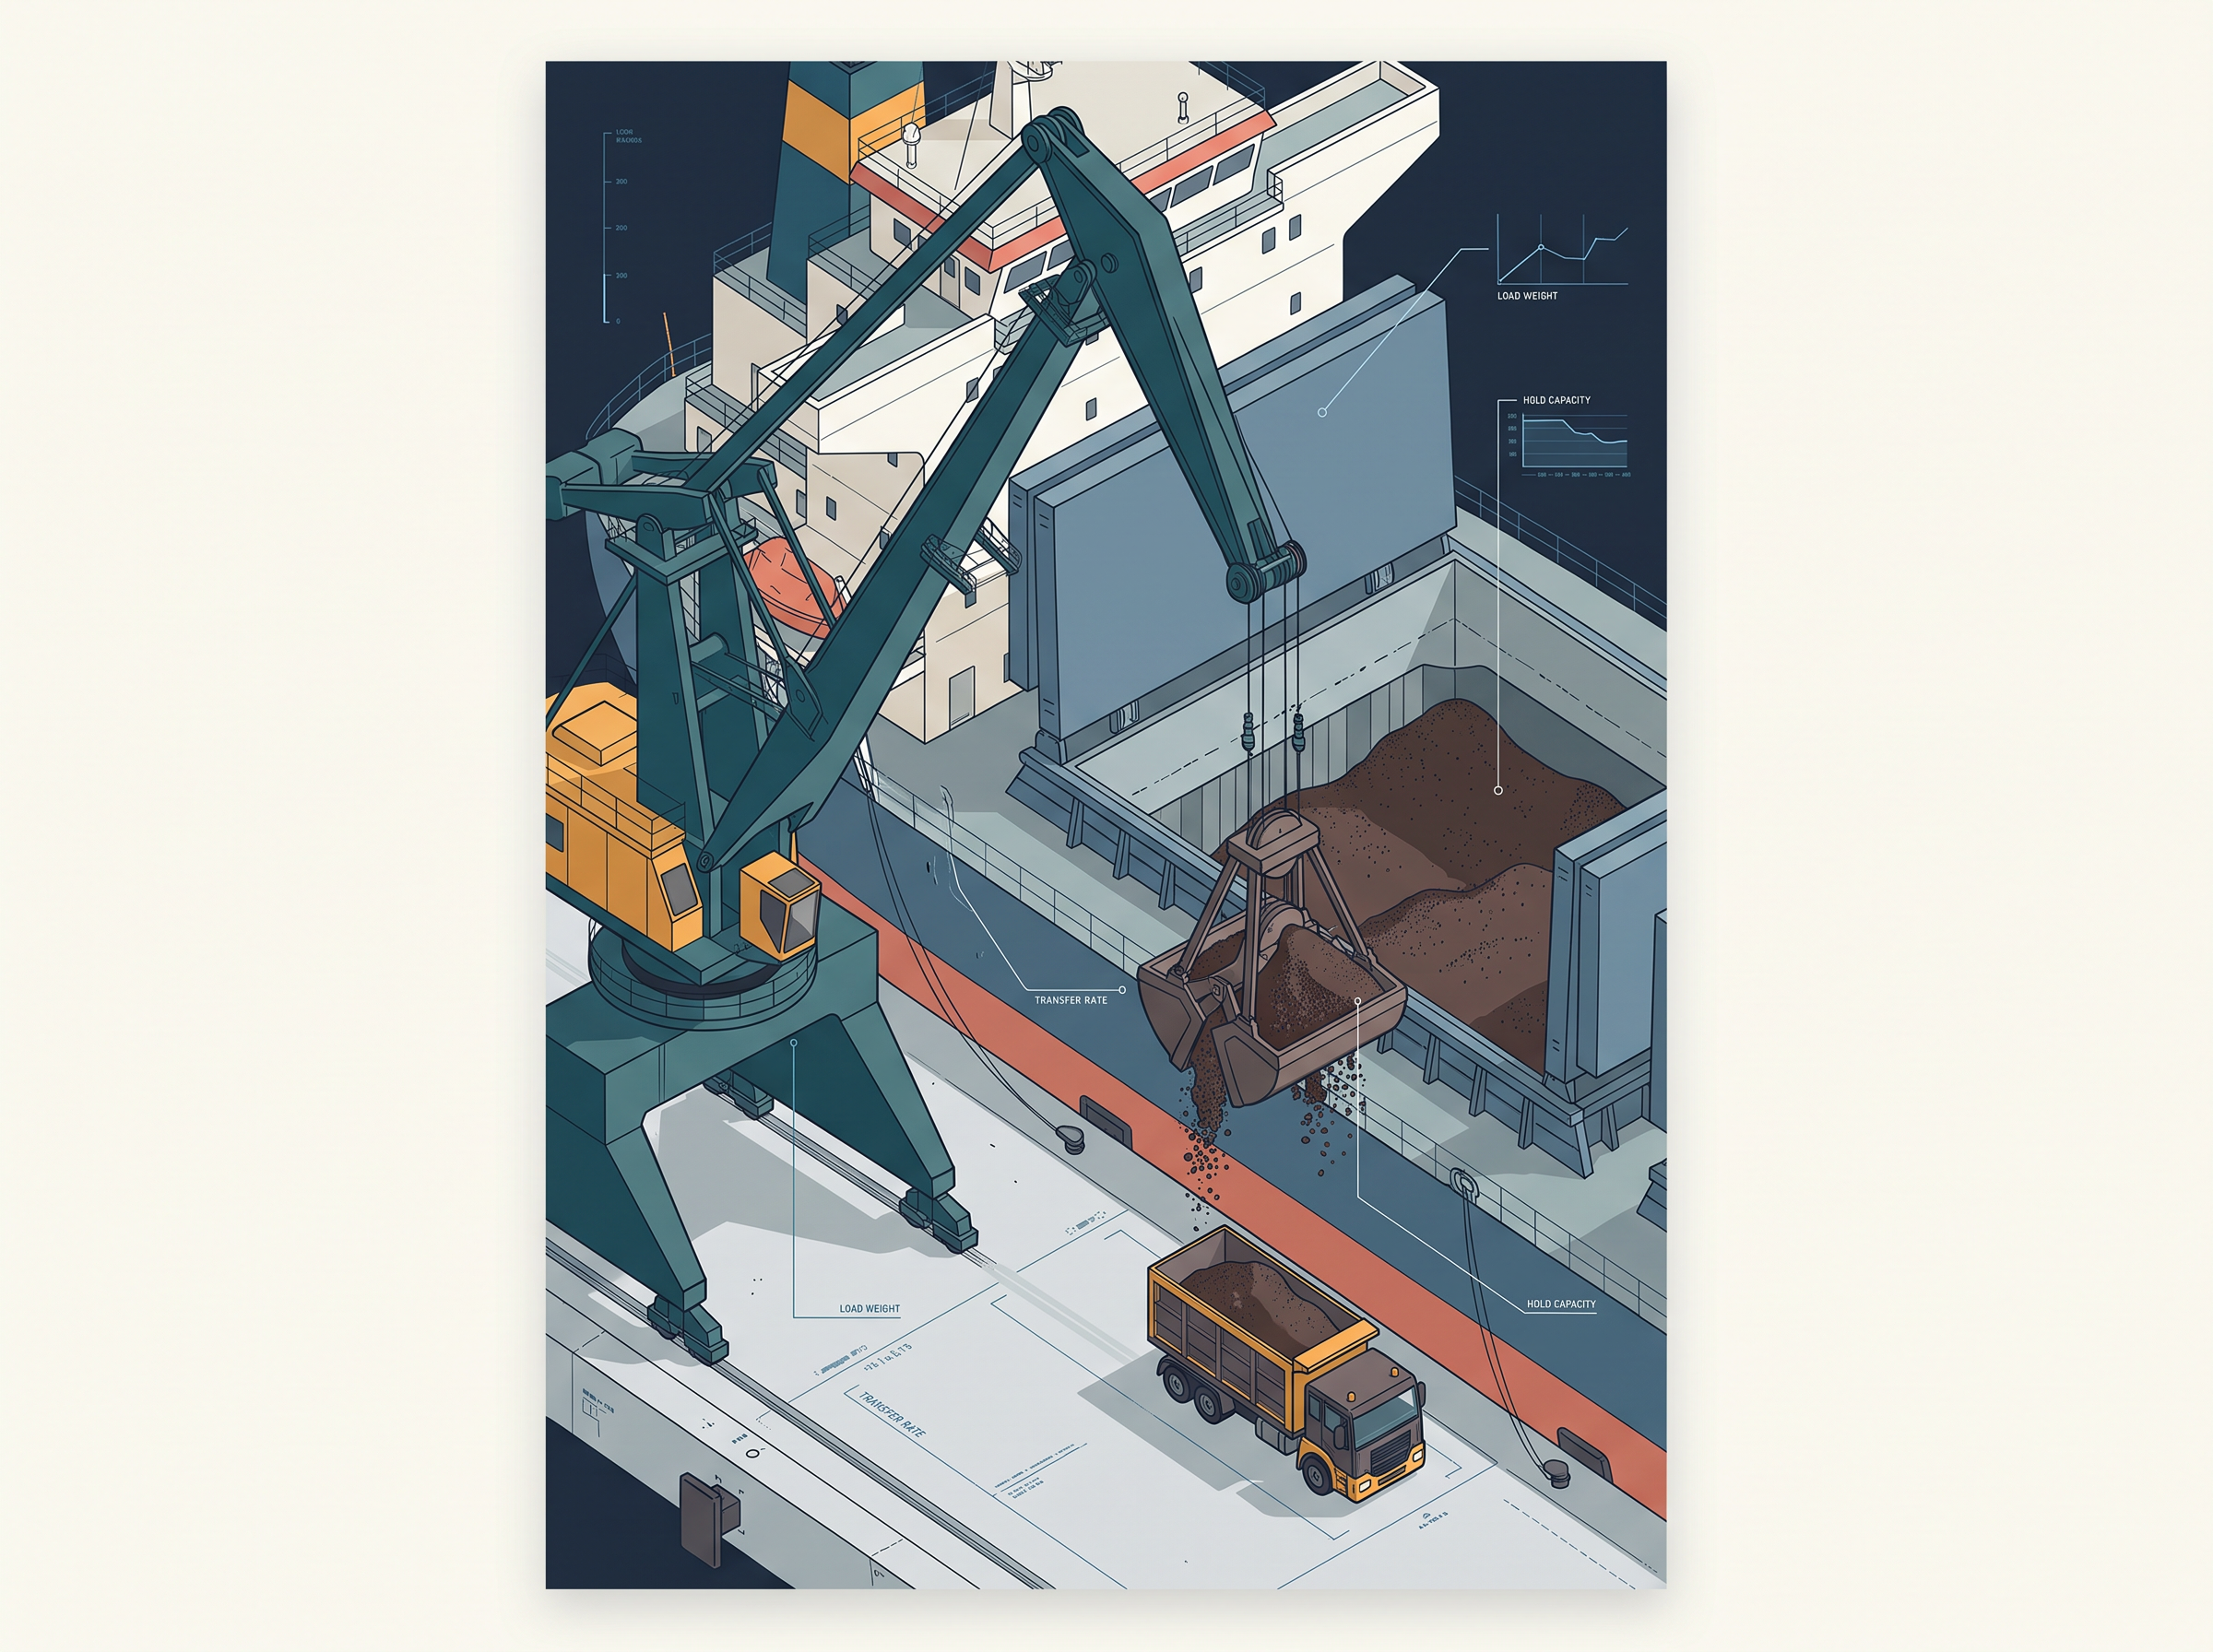
Fig. 8.2 – Unloading bulk cargo at a seaport.
Ports Through History
Ports have been used since ancient times, but they became gateways of international trade only after European traders arrived and the British colonised the country. This is what created the wide variation in the size and quality of India’s ports — some grew a vast area of influence, others stayed small. At present India has 12 major ports and about 200 minor or intermediate ports. The major ports, whose policy and regulation the central government decides, handle the larger share of the total traffic; the minor ports are regulated by state governments.
The British ran the ports as suction points, drawing resources out of the hinterlands and away to Britain. Their key tool was the railway. As lines pushed into the interior, they linked local markets up to regional ones, regional markets to national ones, and national markets out through the ports to the international market.

Fig. 8.3 – Railways linking inland markets to the ports.
This pattern held until 1947. Independence was expected to reverse it, but Partition dealt the ports a heavy blow. Two of the most important were lost at once — Karachi went to Pakistan, and Chittagong to the erstwhile east Pakistan, now Bangladesh. To make up for the loss, several new ports were developed, among them Kandla in the west and Diamond Harbour, near Kolkata on the river Hugli, in the east.
Ports After Independence
Despite that setback, Indian ports kept growing after Independence, and today they handle large volumes of both domestic and overseas trade, most of them fitted with modern infrastructure. Their capacity rose from 20 million tonnes of cargo handling in 1951 to more than 837 million tonnes in 2016 — a more than fortyfold rise. A tonne here is a thousand kilograms, so 837 million tonnes is an enormous weight of goods moving across the quays each year.
Modernising all this was once the sole job of government agencies. As the ports’ role and workload grew, private entrepreneurs have been invited to help bring them up to the standard of the world’s leading ports.
The Major Ports And Their Hinterlands
One warning applies before the list. A hinterland has no fixed boundary drawn on the ground; it shifts over space, and the hinterland of one port often overlaps with that of another. The regions named below are the main areas each port serves, not sealed territories. India’s major ports and their sea routes are mapped in Fig. 8.4.
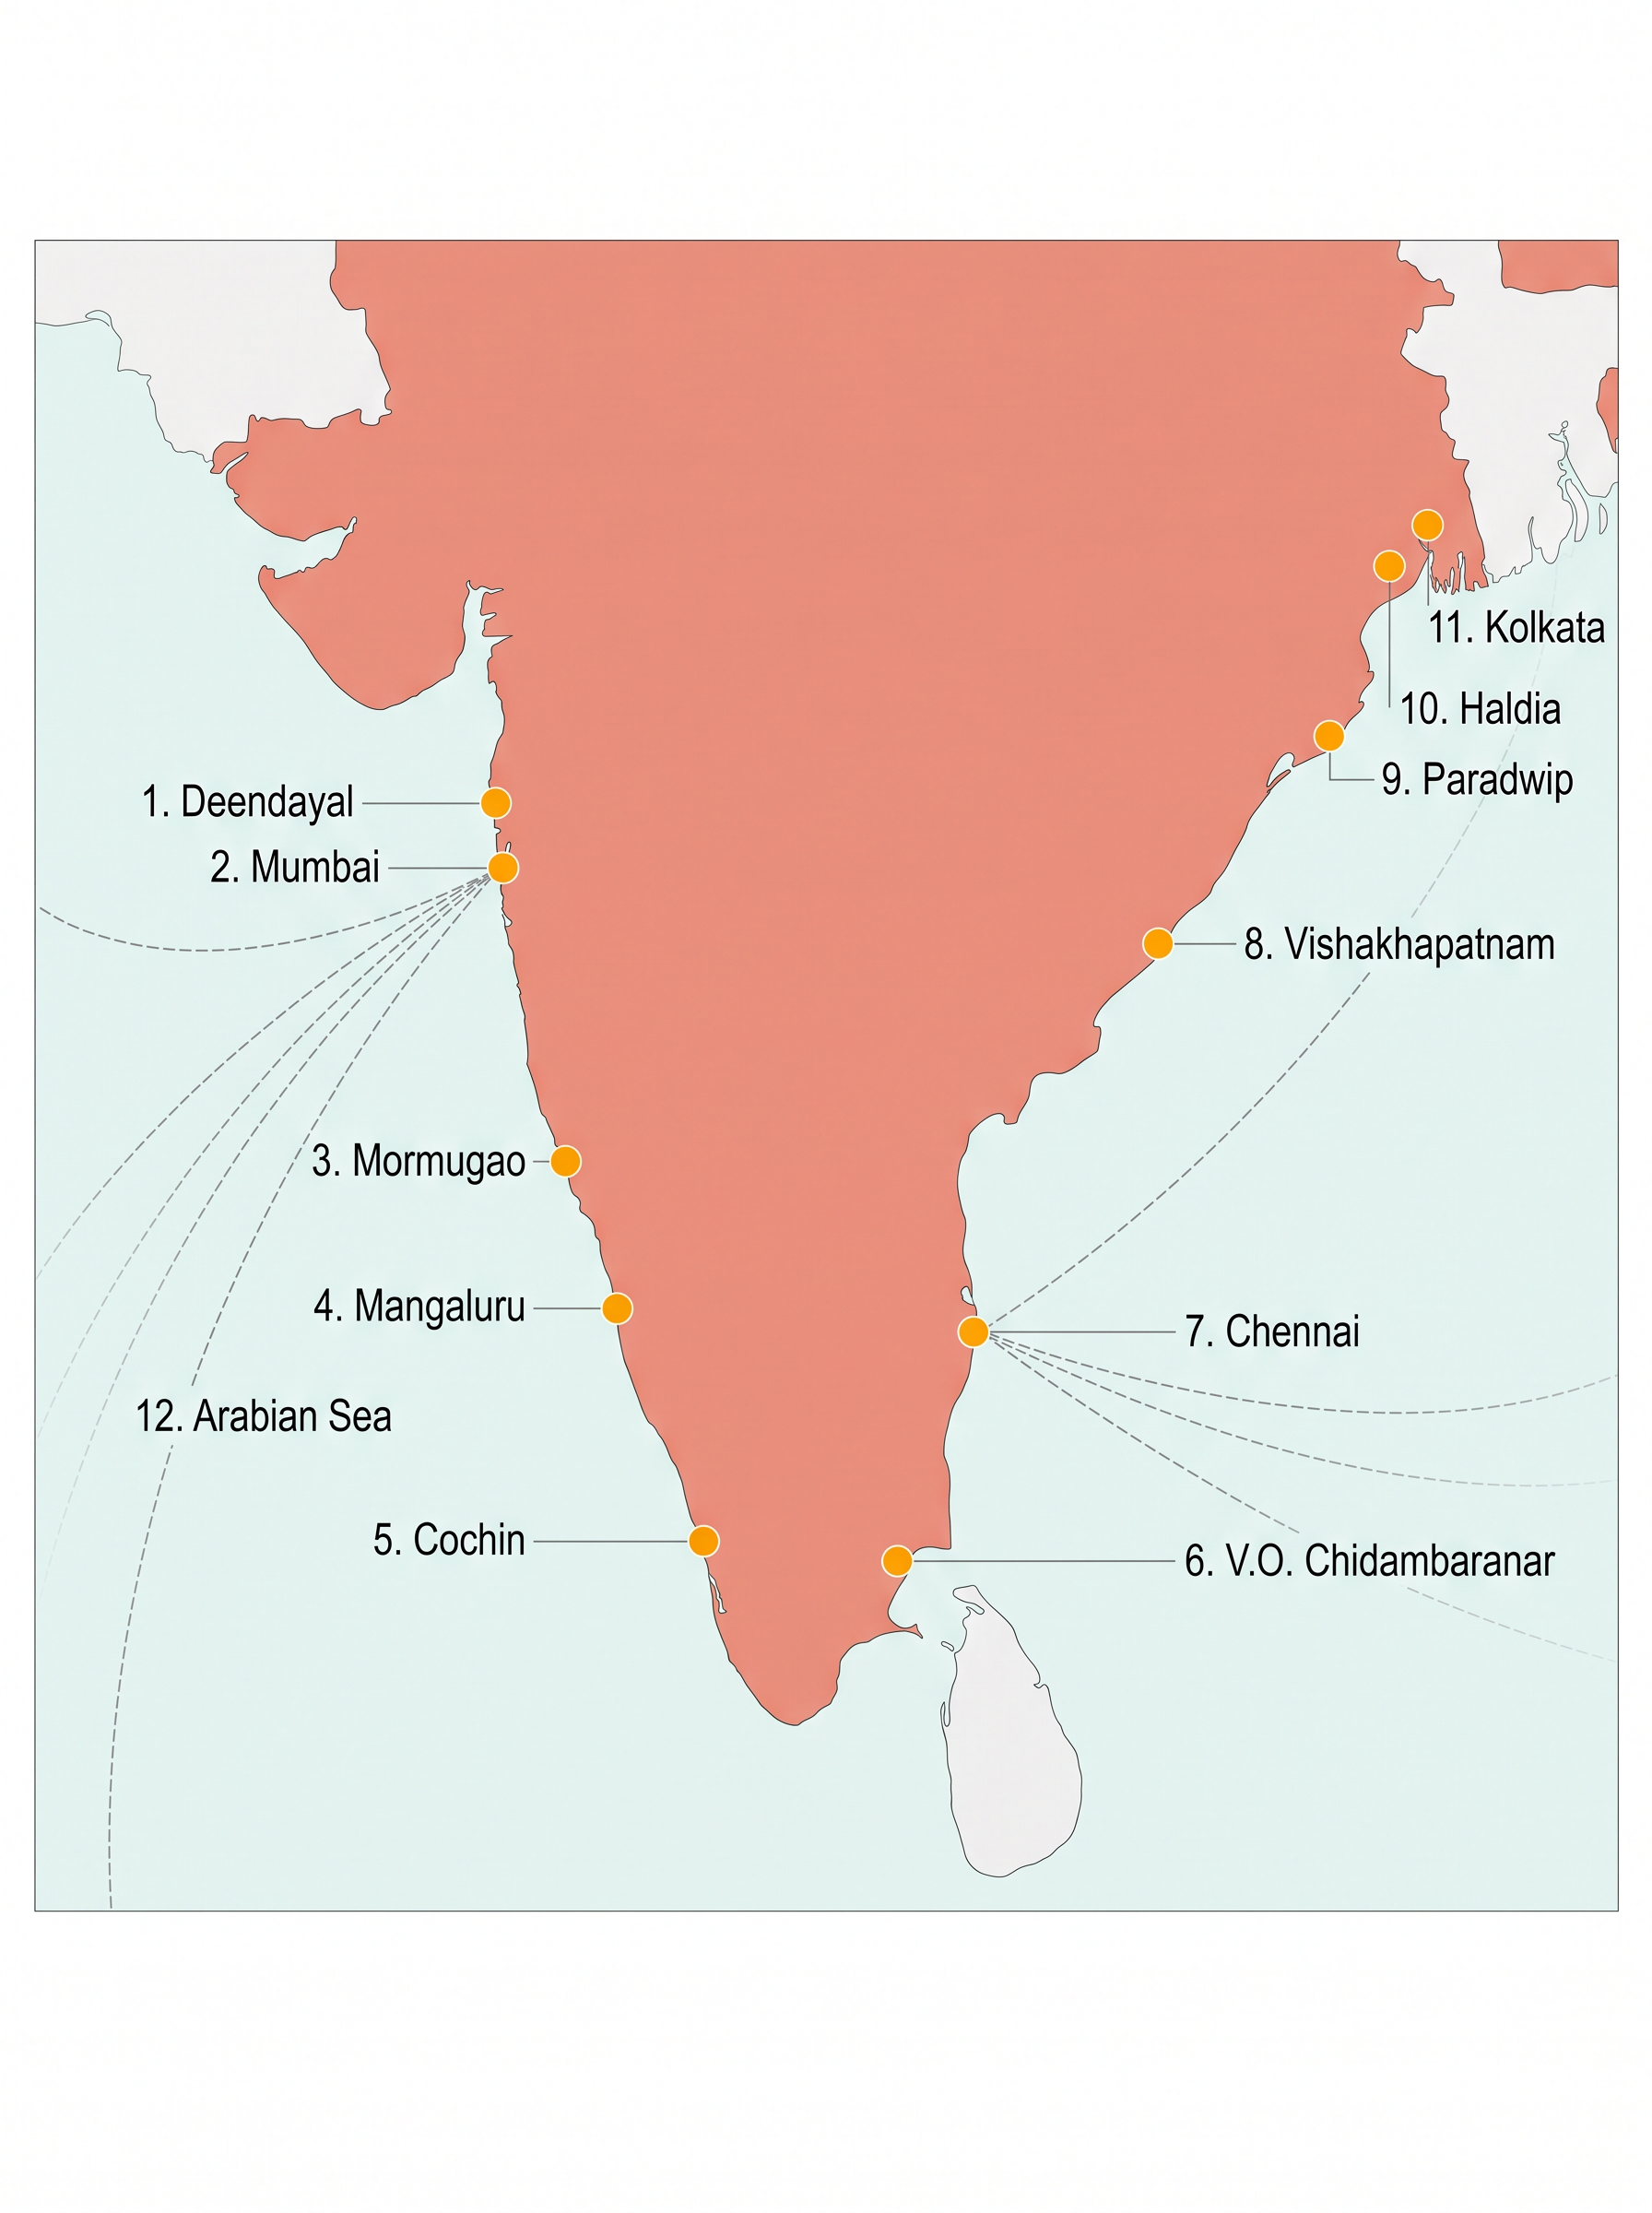
Fig. 8.4 – Major ports and sea routes of India.
The West Coast Ports
Deendayal Port, once known as Kandla port, sits at the head of the Gulf of Kachchh in Gujarat. It was developed as a major port for the western and north-western parts of the country, and also to take pressure off Mumbai. It is specially designed to receive large quantities of petroleum, petroleum products and fertiliser, and its offshore terminal at Vadinar was built to ease the load on the port itself.
Mumbai, in Maharashtra, is a natural harbour and the biggest port in the country. It lies closest to the general sea routes from the Middle East, the Mediterranean countries, North Africa, North America and Europe, where the major share of India’s overseas trade is carried. The port is 20 km long and 6 to 10 km wide, has 54 berths and holds the country’s largest oil terminal. Madhya Pradesh, Maharashtra, Gujarat, Uttar Pradesh and parts of Rajasthan form its main hinterland.
Jawaharlal Nehru Port at Nhava Sheva, close to Mumbai, was developed as a satellite port to relieve the pressure on Mumbai. It is the largest container port in India.
Mormugao Port stands at the entrance of the Zuari estuary — the widened, tidal mouth of the Zuari river — and is a natural harbour in Goa. It gained importance after being remodelled in 1961 to handle iron-ore exports to Japan. The building of the Konkan railway has since stretched its hinterland well inland, across Karnataka, Goa and southern Maharashtra.
New Mangalore Port, in Karnataka, serves the export of iron-ore and iron-concentrates. It also handles fertilisers, petroleum products, edible oils, coffee, tea, wood pulp, yarn, granite stone and molasses, with Karnataka as its major hinterland.
Cochin Port lies at the head of the Vembanad Kayal, a large backwater lagoon in Kerala, and is a natural harbour popularly called the ‘Queen of the Arabian Sea’. Its advantage is location: it sits close to the Suez–Colombo route. It caters to Kerala, southern Karnataka and south-western Tamil Nadu.
The East Coast Ports
Shyama Prasad Mookerjee, Kolkata Port lies on the Hugli river, 128 km inland from the Bay of Bengal in West Bengal. Like Mumbai, it was developed by the British, and Kolkata had the early advantage of being the capital of British India. The port has since lost much of its significance, as exports were diverted to other ports such as Vishakhapatnam and Paradwip and to its own satellite port, Haldia. It is also troubled by silt piling up in the Hugli, its link to the sea. Its hinterland covers Uttar Pradesh, Bihar, Jharkhand, West Bengal, Sikkim and the north-eastern states, and it even extends port facilities to the land-locked neighbours Nepal and Bhutan.
Haldia Port lies 105 km downstream from Kolkata and was built to ease the congestion there. It handles bulk cargo such as iron ore, coal, petroleum and petroleum products, fertilisers, jute and jute products, and cotton and cotton yarn.
Paradwip Port sits in the Mahanadi delta, about 100 km from Cuttack in Odisha. It has the deepest harbour of the group, suited to very large vessels, and was developed mainly for the large-scale export of iron-ore. Odisha, Chhattisgarh and Jharkhand form its hinterland.
Visakhapatnam Port, in Andhra Pradesh, is a land-locked harbour — it is joined to the sea by a channel cut through solid rock and sand. An outer harbour has been added to handle iron-ore, petroleum and general cargo. Andhra Pradesh and Telangana are its main hinterland.
Chennai Port is one of the oldest ports on the eastern coast, an artificial harbour built in 1859. Here the contrast with Mumbai is sharp: Mumbai’s harbour is natural and deep, while Chennai’s is man-made and set in shallow water, which makes it unsuitable for large ships. Tamil Nadu and Puducherry are its hinterland.
Kamarajar Port, at Ennore, is a newly developed port in Tamil Nadu, built 25 km north of Chennai to relieve the pressure on Chennai port.
V.O. Chidambaranar Port, at Tuticorin, was likewise developed to relieve Chennai. It deals in a variety of cargo, including coal, salt, food grains, edible oils, sugar, chemicals and petroleum products.
8.6 Airports
Ships carry the bulk of India’s trade, but not all of it. Air transport plays an important role too, and it does a job the sea cannot. Its great advantage is speed: it takes the least time to carry goods, which makes it ideal for high-value or perishable goods — things that spoil quickly, such as fresh flowers, fruit or fish — over long distances.
That speed comes at a price. Air transport is very costly, and it is unsuitable for heavy and bulky commodities, which are simply too expensive to lift in quantity. So the choice between the two routes follows the cargo. Light, valuable, urgent goods go by air; heavy, cheap, patient goods go by sea. Because most trade is of the second kind, air carries only a small share of it, far less than the oceanic routes.
India’s Airports
According to the Annual Report of 2016-17, there were 25 major airports functioning in the country. They were Ahmedabad, Bengaluru, Chennai, Delhi, Goa, Guwahati, Hyderabad, Kolkata, Mumbai, Thiruvananthapuram, Srinagar, Jaipur, Calicut, Nagpur, Coimbatore, Cochin, Lucknow, Pune, Chandigarh, Mangaluru, Vishakhapatnam, Indore, Patna, Bhubaneswar and Kannur.
The network has widened since. From 2017, under the UDAN scheme — aimed at extending air service to unserved and underserved towns — a total of 73 such airports were brought into use, including 9 heliports, which are airfields for helicopters, and 2 water aerodromes, which are landing areas on water for seaplanes. This figure comes from the Press Information Bureau of the Ministry of Civil Aviation, 2023.
The general features of air transport in India were covered in the chapter on transport, which is worth turning back to. India’s air routes are mapped in Fig. 8.5.
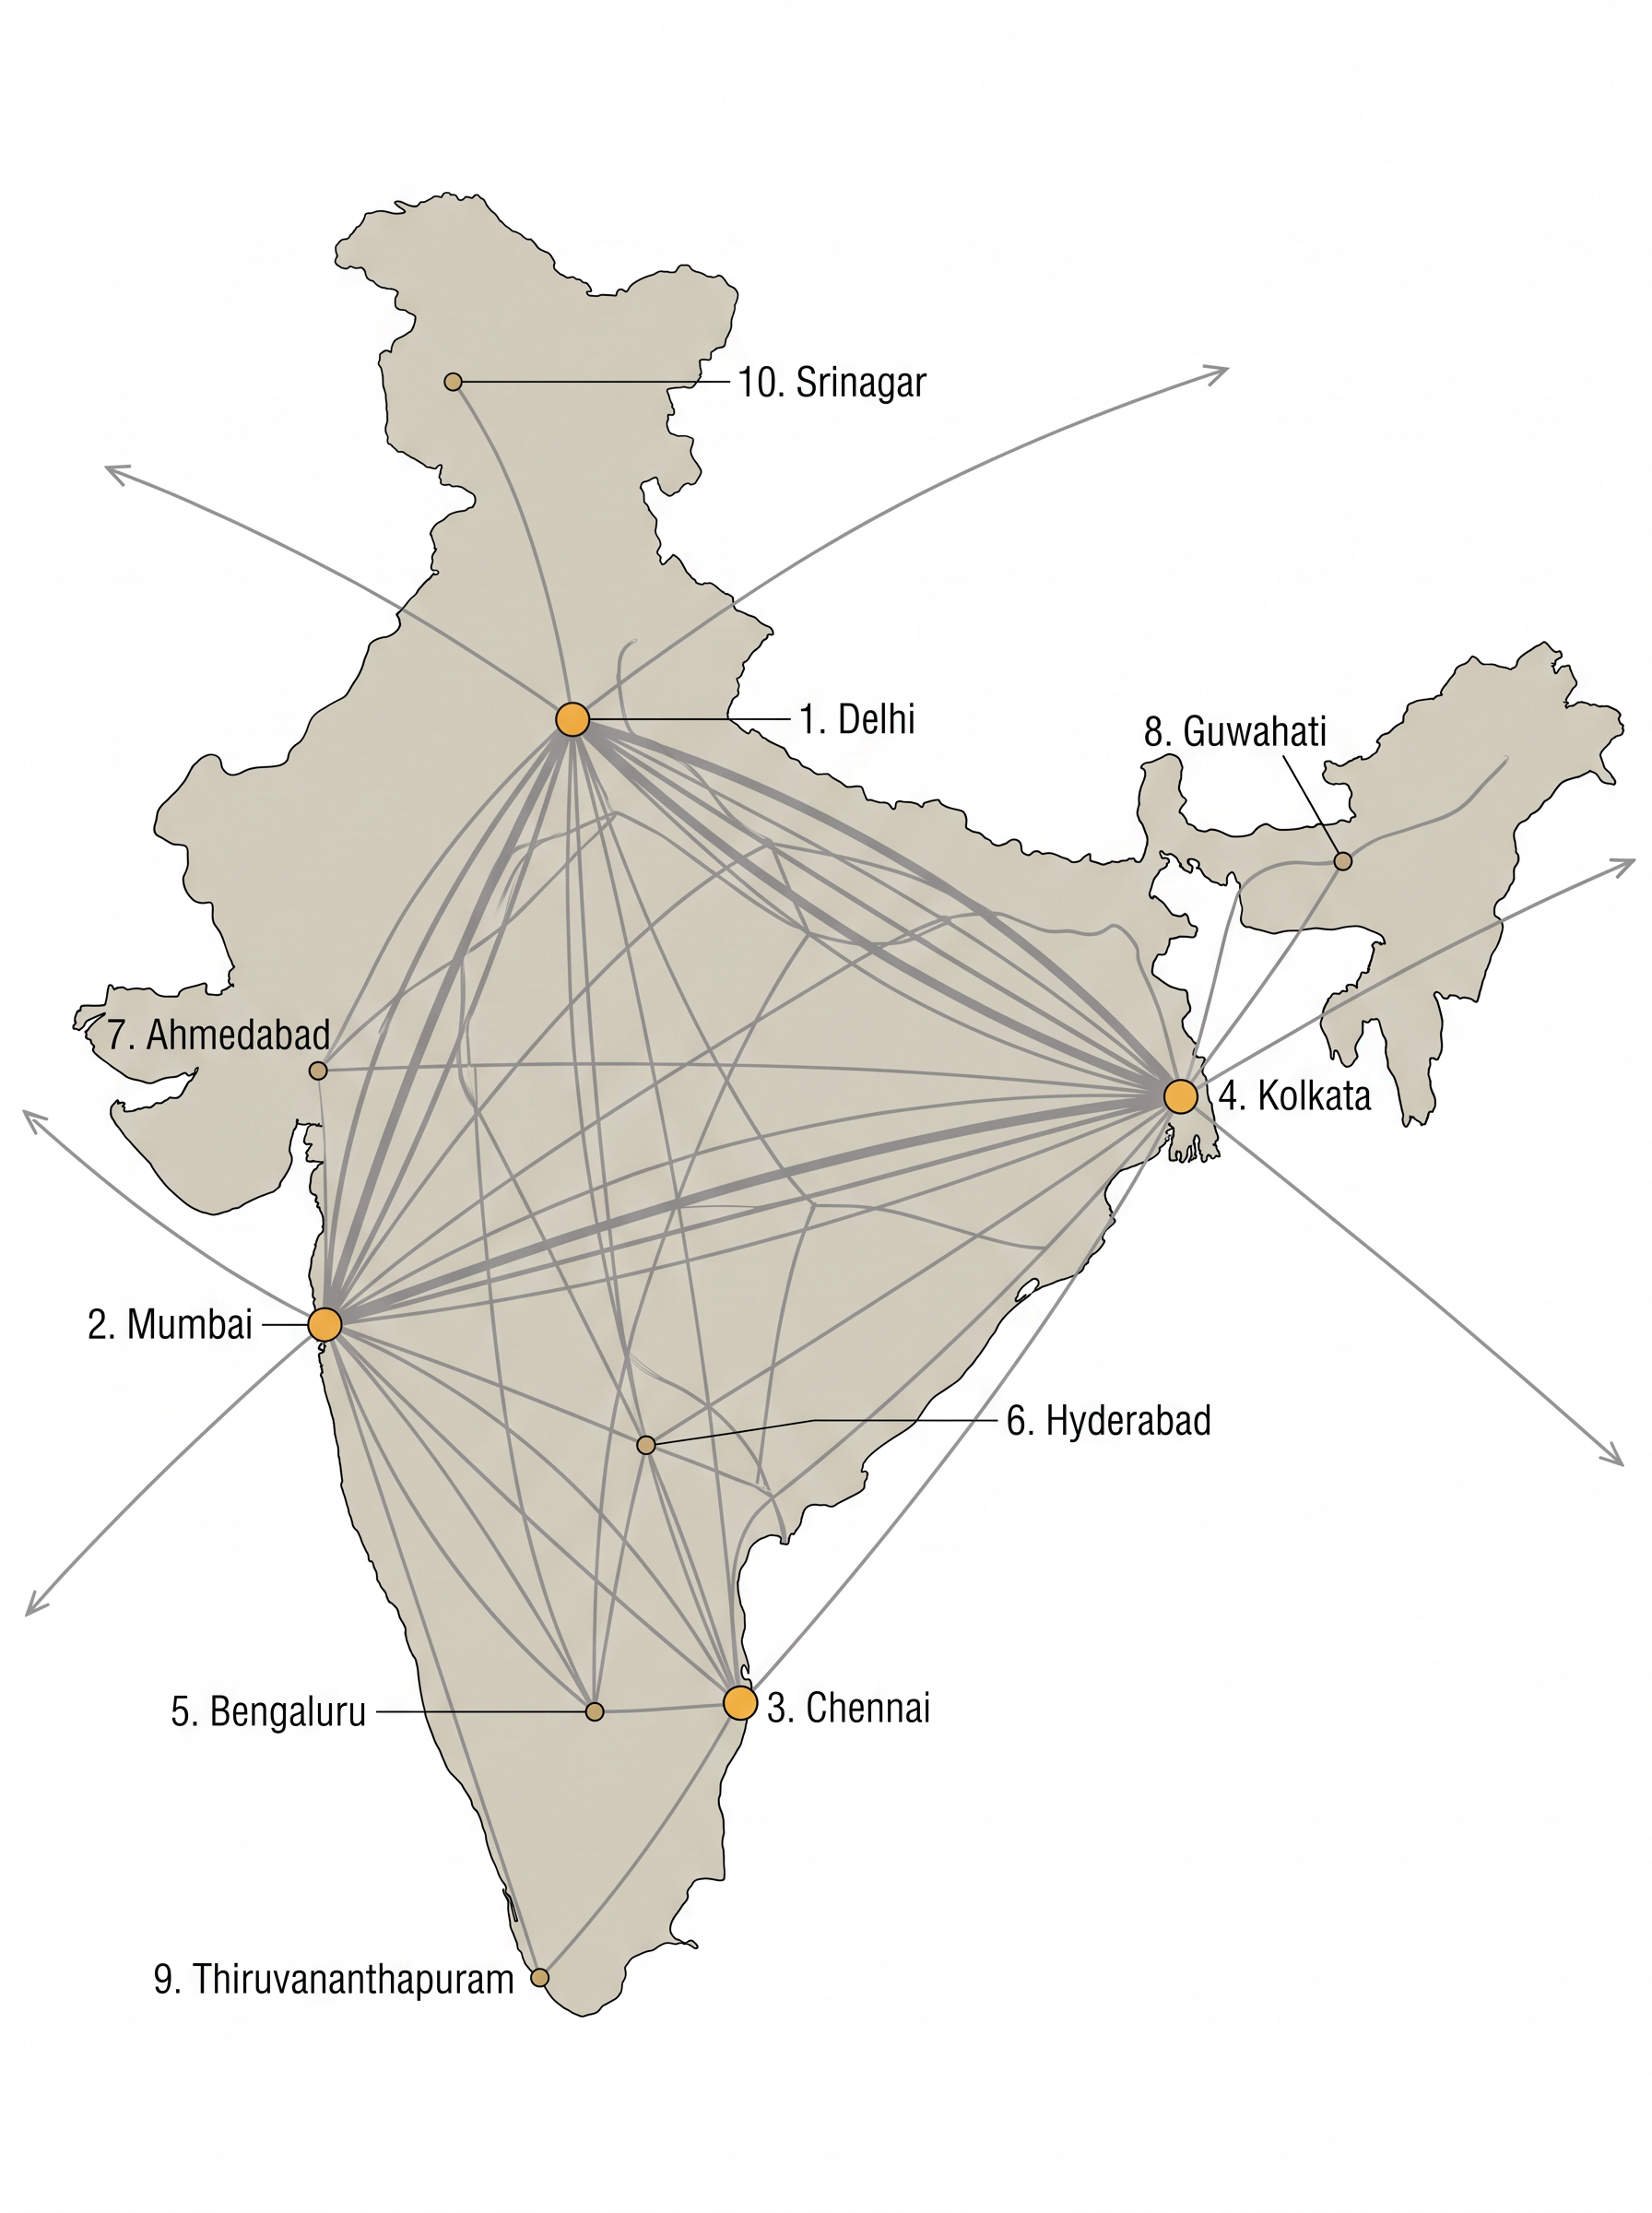
Fig. 8.5 – Domestic and international air routes of India.
Fig. 8.5 rewards some study of your own. Find the nearest domestic and international airports to where you live, and work out which state has the most domestic airports. Then look for the four cities where the largest number of air routes converge, and think about why the lines gather there rather than elsewhere.
8.7 Summary
- International trade is mutually beneficial, because no country is self-sufficient. India makes up only about one per cent of world trade, yet plays a significant role in the world economy, and its trade has grown enormously since 1950-51.
- India’s foreign trade has risen steeply in volume, but the value of imports has stayed higher than exports throughout, leaving a standing trade deficit.
- In the composition of exports, manufactured goods are by far the largest item, though their share has slipped; the shares of crude and petroleum products and of other commodities have risen. Traditional exports such as cashew have declined under international competition, while floriculture, fresh fruits, marine products and sugar have grown.
- In the composition of imports, the old items were foodgrain, capital goods and machinery. Foodgrain imports ended after the success of the Green Revolution, and petroleum, oil and lubricants is now the largest single import, with the fuel share climbing.
- In the direction of trade, India deals with most countries and trading blocks, but its trade leans most heavily on Asia and ASEAN.
- Most trade moves by sea and air, with only a small portion by land to the neighbours Nepal, Bhutan, Bangladesh and Pakistan.
- Sea ports are the main gateways. India has 12 major ports, run by the central government, and about 200 minor ports, run by the states; the west coast has more than the east. Each port serves an inland hinterland. Partition cost the country Karachi and Chittagong, prompting new ports like Kandla, and total port capacity grew from 20 million tonnes in 1951 to more than 837 million tonnes in 2016.
- Airports carry light, high-value and perishable goods quickly, but air transport is costly and cannot move heavy cargo, so it handles a much smaller share of trade than the sea.
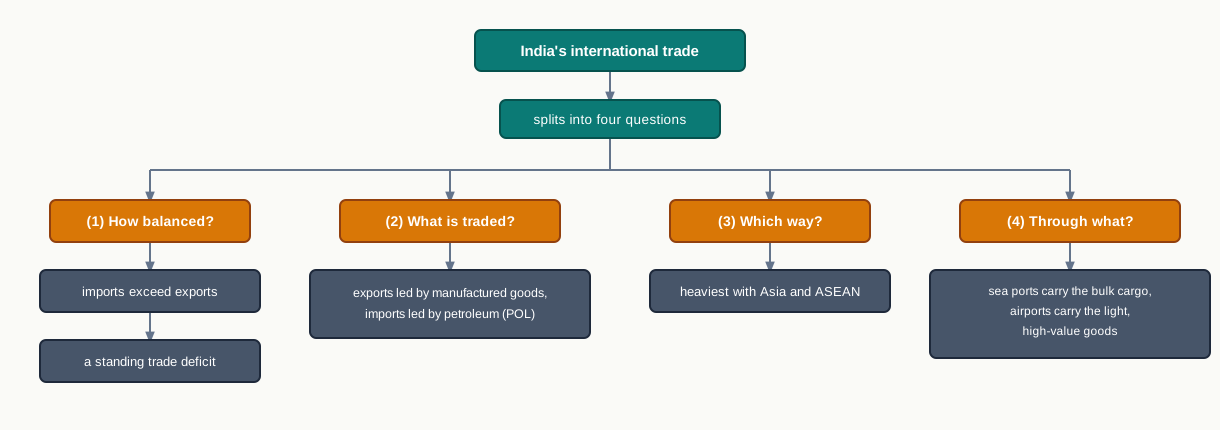
Fig. 8.6 – Four dimensions of India’s international trade.
What This Chapter Cannot Tell You
Much of this chapter is built from national totals and shares, and a national figure hides the detail beneath it. A commodity’s falling share of exports does not reveal whether its rupee value rose or fell, and the direction table counts imports alone, saying nothing about where India’s goods are sold. Several figures are also fixed to a past year — port capacity to 2016, the airport count to 2016-17 — so they mark a moment, not the present, and the real numbers have moved on since.
8.8 NCERT Questions
- Trade between two countries is termed as
- Internal trade
- External trade
- International trade
- Local trade
- Which one of the following is a land locked harbour?
- Vishakhapatnam
- Mumbai
- Kamarajar (Ennore)
- Haldia
- Most of India’s foreign trade is carried through
- Land and sea
- Land and air
- Sea and air
- Sea
- Mention the characteristics of India’s foreign trade. (30 words)
- Distinguish between port and harbour. (30 words)
- Explain the meaning of hinterland. (30 words)
- Name important items which India imports from different countries. (30 words)
- Name the ports of India located on the east coast. (30 words)
- Describe the composition of export and import trade of India. (150 words)
- Write a note on the changing nature of the international trade of India. (150 words)
8.9 Check Your Concepts
- Fig. 8.1 plots two lines for the years 2013-14 to 2021-22. State what each line represents, and explain what the widening gap between them tells you about India’s trade.
- Using Table 8.6, calculate the percentage growth in India’s imports from Africa between 2016-17 and 2021-22, showing your working.
- Using the value of petroleum, oil and lubricants in Table 8.5 and the total imports for 2021-22 in Table 8.1, work out what share of India’s import bill this one fuel made up.
- Trace, in order, the chain of events that removed foodgrain from India’s import basket after the 1970s and made petroleum its largest single import.
- Give the locational reasons the chapter offers for Mumbai being India’s biggest port, and say which of them you think matters most.
- Table 8.2 shows the share of manufactured goods in India’s exports falling from 72.9 per cent in 2015-16 to 67.8 per cent in 2021-22. Explain why this falling share does not by itself prove that India exported fewer manufactured goods.
- Table 8.6 records India’s imports region by region but not its exports. What does this prevent you from concluding about the overall balance of India’s trade with Asia and ASEAN?