Chapter 4: Water Resources
Every year the monsoon empties itself over India. Rivers swell, fields flood, reservoirs fill, and for a few weeks the country looks thoroughly drenched. Measure the year’s rain and the figure is enormous: about 4,000 cubic km of water falls on India as precipitation. It is easy to believe a country soaked like this can never run short.
Then follow the water. Most of it evaporates back into the air, runs off unused, or drains to the sea before anyone can hold it. What actually reaches the rivers and the replenishable groundwater together comes to 1,869 cubic km. Of even that, topography, timing and the sheer difficulty of catching water leave only about 1,122 cubic km that can be put to real use. The flood has shrunk to a trickle by the time it reaches a tap or a field.
Now share that trickle. India has about 2.45 per cent of the world’s land and 4 per cent of its water, yet more than 17 per cent of all the people alive. The same water must stretch across more mouths each year, even as factories, drains and fertiliser-laden fields foul the part that is left.
This is the puzzle of a cyclic resource: never destroyed, endlessly recycled, and still running short where it is needed. This chapter follows India’s water from the cloud to the crisis, and asks what can be done.
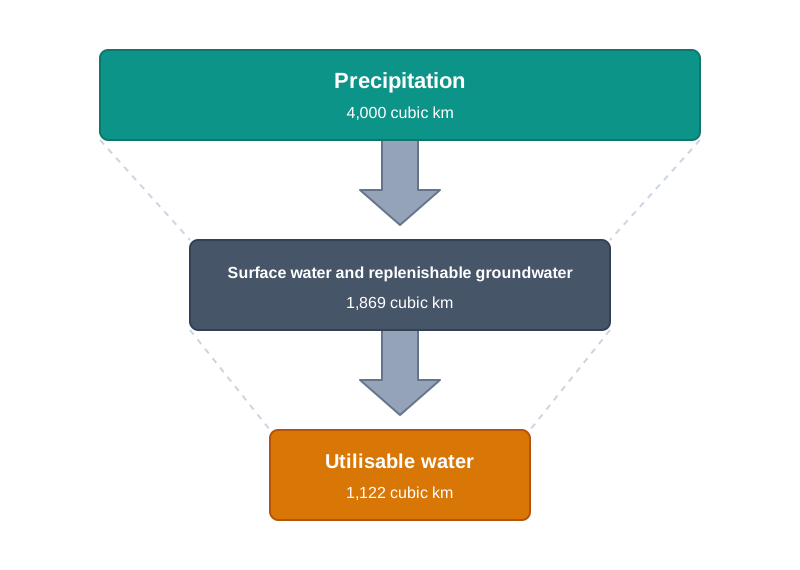
Fig. 4.0 – India’s water budget from precipitation to utilisable water.
4.1 Water Resources Of India
Look far enough ahead and a few changes to Indian society seem almost certain. Populations will shift across the map, technology will advance, the environment will be strained, and — this chapter argues — water will grow scarce. Of these, water scarcity may be the hardest to face, because demand keeps rising while supply shrinks under over-use and pollution.
This can feel surprising, because water is a cyclic resource — one that moves endlessly through evaporation, rain and run-off, and is renewed rather than used up. About 71 per cent of the earth’s surface is covered by water. Yet freshwater is only about 3 per cent of that total, and only a small part of even that freshwater is within reach for human use.
The catch is that freshwater is not spread evenly. Its availability changes from place to place and from season to season. Where it runs short, the sharing of it turns tense, and communities, regions and states fall into disputes over who controls a scarce supply. Assessing water honestly, using it efficiently and conserving it therefore become conditions for development, not luxuries. This chapter follows India’s water: how much there is, where it lies, who uses it, and how it can be protected.
India’s Water Budget
India holds a small share of the world’s water and a large share of its people. It has about 2.45 per cent of the world’s land area, about 4 per cent of its water resources, and more than 17 per cent of its population. Water that feels abundant in some countries must here be stretched very thin.
Start with what falls. In an average year, precipitation over India totals about 4,000 cubic km. A cubic km is a cube of water a full kilometre along each edge — an almost unimaginable volume. But rain that falls is not the same as water you can use. Much of it evaporates, much runs off to the sea, and only a part soaks in or is captured.
What actually reaches the rivers, together with the replenishable groundwater — the underground water that rain refills each year — comes to about 1,869 cubic km. And of even that, only about 60 per cent can be put to beneficial use, once the losses of terrain and timing are counted. The utilisable water resource, the water India can genuinely draw on, is therefore only about 1,122 cubic km.
The steps below trace this shrinking from cloud to canal.
The lesson of that arithmetic is sobering. Barely more than a quarter of the water that falls on India ends up available to use, and that same slice must serve more than a sixth of all humanity. It also tells us where the effort must go. Since so little of the rain is ever caught, catching more of it — through storage, recharge and careful use — matters far more than wishing for heavier rain. Scarcity here is as much about holding water as about receiving it.
4.1.1 Surface Water Resources
Surface water is the water we can see, and it comes from four major sources: rivers, lakes, ponds and tanks. A tank here is a built or dug reservoir that stores rain and run-off, a form of water storage long common across much of peninsular India.
India’s rivers are many. There are about 10,360 rivers and their tributaries — the smaller streams that feed a larger river — longer than 1.6 km each, roughly a mile. Together, the mean annual flow in all these river basins is estimated at about 1,869 cubic km.
But not all of that flow can be tapped. Because of the shape of the land, the behaviour of the rivers and other constraints, only about 690 cubic km — roughly 32 per cent — of the available surface water can actually be utilised.
How much water a river carries depends on two things: the size of its catchment area, or river basin — the whole stretch of land whose rainfall drains into that river — and how much rain falls within it. As the Class XI textbook ‘India: Physical Environment’ showed, precipitation in India varies enormously from place to place and is concentrated in the monsoon months. So a river with a large, rain-rich catchment carries far more water than one with a small or dry catchment.
The map of India’s river basins makes the pattern visible. Rivers like the Ganga, the Brahmaputra and the Indus each drain enormous catchments.
Map
Fig. 4.1 Caption: India’s river basins, showing the west-flowing and east-flowing rivers. Brief: Political-physical map of India with basin boundaries drawn for the major basins — Indus, Ganga, Brahmaputra, Barak, Sabarmati, Mahi, Narmada, Tapi, Mahanadi, Brahmani and Baitarani, Subarnarekha, Godavari, Krishna, Pennar and Kaveri. Shade west-flowing river groups and east-flowing river groups in two distinct tones per the key, and label the two west-flowing and two east-flowing river groups as shown. Mark the Tropic of Cancer, neighbouring countries and the seas for orientation. The map must show the full extent of India as officially defined.
These northern rivers matter out of proportion to their reach. Precipitation is heavy in the catchments of the Ganga, the Brahmaputra and the Barak — the last flowing through the north-east. Although these rivers together drain only about one-third of the country’s area, they carry about 60 per cent of its total surface water resources. It is the rain, not the land area, that decides the share.
This uneven bounty has shaped what has been done with the rivers. In the south, much of the annual flow of rivers like the Godavari, the Krishna and the Kaveri has already been harnessed — dammed and diverted so the water can be put to use. In the water-rich Brahmaputra and Ganga basins, by contrast, much of that work is still to be done.
4.1.2 Groundwater Resources
Beneath the surface lies a second store. India’s total replenishable groundwater — the underground water that rain refills each year — is about 432 cubic km. Where it is drawn on at all, it tends to be drawn on either very heavily or barely at all.
Groundwater use is highest in the north-western region and in parts of the south. It is very high in Punjab, Haryana, Rajasthan and Tamil Nadu, where farming leans hard on the water below. At the other extreme, states like Chhattisgarh, Odisha and Kerala use only a small share of what they have. Between these lie Gujarat, Uttar Pradesh, Bihar, Tripura and Maharashtra, drawing on their groundwater at a moderate rate.
This gap is a warning. If the present trend of heavy withdrawal continues where use is already high, demand will begin to outrun what the aquifers can refill. Groundwater pumped faster than rain can replace it does not simply level off — the water table falls, wells must be dug deeper, and the cost of reaching water climbs year by year. Such a squeeze would be detrimental to development, and could bring social upheaval and disruption as people compete for a shrinking supply.
4.1.3 Lagoons And Backwaters
India’s coastline is long and, in places, deeply indented, with the sea reaching inland in bays and inlets. Where this happens, sandbars and spits cut off shallow stretches of water, forming lagoons and coastal lakes. Behind them run backwaters — networks of channels and lagoons lying parallel to the coast.
Kerala, Odisha and West Bengal hold vast surface water in these lagoons and lakes. The water is generally brackish — saltier than river water but less salty than the open sea — because fresh river water and salt seawater mix within it. That saltiness limits what the water can do, but it is far from wasted: it supports fishing, and it irrigates certain salt-tolerant varieties of paddy, along with coconut and similar crops.
4.2 Water Demand And Utilisation
India has long been an agrarian country. About two-thirds of its people depend on agriculture, and farming needs water above all through irrigation. So when the country began planning its development, raising farm output through irrigation was given very high priority in the Five Year Plans — the government’s staged plans for the economy.
To store water and spread it across the land, India built multipurpose river valley projects — large dams and canal systems that serve several purposes together, irrigation chief among them. Bhakra-Nangal, Hirakud, Damodar Valley, Nagarjuna Sagar and the Indira Gandhi Canal Project are among the best known; the last carries water into the arid west of Rajasthan. Because of this history, India’s water demand today is still dominated by the needs of irrigation.
Who Uses India’s Water
Agriculture is by far the largest user of water, from both the surface and the ground. It accounts for about 89 per cent of surface water use and about 92 per cent of groundwater use. Industry and homes take only what is left.
The industrial sector uses a small share — about 2 per cent of surface water and 5 per cent of groundwater. The domestic sector, meaning households, takes about 9 per cent of surface water, a larger slice than it draws from the ground. Set side by side, the three tell one story: farming dominates, while industry and homes are minor users today. That balance is expected to shift. As the country develops, the shares taken by industry and domestic use are likely to grow, though agriculture will stay the largest.
4.2.1 Demand Of Water For Irrigation
Why Irrigation Is Necessary
In farming, water is used mainly for irrigation — supplying crops with water by human effort rather than leaving them to the rain. India needs it because rainfall is unevenly spread in both space and time. Large tracts receive too little rain and are drought-prone, among them north-western India and the Deccan plateau. And across most of the country, the winter and summer months are more or less dry.
Because of this, farming through the dry seasons is difficult without assured irrigation. Even in well-watered regions like West Bengal and Bihar, a break in the monsoon, or its outright failure, brings dry spells that damage crops. Some crops demand irrigation whatever the region: rice, sugarcane and jute all need large amounts of water that rain alone cannot reliably supply.
Irrigation does more than rescue a crop from drought. It makes multiple cropping possible — growing more than one crop on the same field in a single year — and irrigated land is generally more productive than unirrigated land. The high-yielding varieties (HYV) of seed at the heart of the green revolution need a steady, regular supply of moisture, which only a developed irrigation system can give. Here the green revolution simply means the strategy of raising crop output with these new seeds backed by assured irrigation.
This is why the green revolution took hold most strongly in Punjab, Haryana and western Uttar Pradesh. In these states, more than 85 per cent of the net sown area is irrigated, and wheat and rice are grown chiefly with irrigation. But much of that water is pumped from below the ground: of the total net irrigated area, about 76.1 per cent in Punjab and 51.3 per cent in Haryana is watered through wells and tubewells.
The Groundwater Bill Comes Due
Leaning so heavily on wells and tubewells means these states use up a large part of their groundwater potential, and the result is groundwater depletion. When water is drawn faster than rain can replace it, the water table falls, and wells must reach ever deeper to find water.
The damage does not stop at the falling table. Intensive irrigation in Punjab, Haryana and western Uttar Pradesh also raises the salt content of the soil, and salty soil slowly loses its fertility — threatening the very yields the irrigation was meant to lift. Meanwhile, heavy over-withdrawal in states like Rajasthan and Maharashtra has pushed up the concentration of fluoride in groundwater, and has led to rising arsenic in parts of West Bengal and Bihar. Both raise serious health risks when they build up in drinking water.
4.2.2 Emerging Water Problems
Two problems are now closing in on India’s water. The first is that the water available to each person is falling day by day. Per capita availability — the amount of water per person — drops as the population keeps rising, because the same limited supply must be divided among more and more people.
The second problem is pollution. Industrial, agricultural and domestic effluents — the waste liquids from factories, farms and homes — are fouling the water that is available, and this in turn shrinks the share that is clean enough to use. Rising demand and falling quality press on the resource from both sides at once.
4.3 Deterioration Of Water Quality
Water quality means the purity of water — water free of unwanted foreign substances. When such substances enter it, the water’s quality falls, and it can become unfit for people to use.
Water is fouled by many kinds of matter: micro-organisms, chemicals, and industrial and other wastes. When toxic substances reach lakes, streams, rivers, the ocean and other water bodies, they either dissolve into the water or hang suspended in it. The water is then polluted, its quality damaged, and the aquatic systems living in it are harmed. Worse still, these pollutants sometimes seep downward and pollute the groundwater below.
4.3.1 Water Conservation And Management
With freshwater growing scarcer and demand still rising, India has little choice but to conserve its water and manage it well for the long run. Seawater cannot fill the gap: turning it fresh means desalinisation — removing the salt from seawater — which is so costly that the sea is treated as a negligible source of supply.
So the effort must go into using freshwater wisely. India needs firm policies and laws, water-saving technologies, and steps to prevent pollution before it starts. Four approaches are singled out for encouragement: watershed development, rainwater harvesting, the recycling and reuse of water, and the conjunctive use of water — drawing on surface water and groundwater together, in a planned way, so that neither is exhausted. The sections that follow take up these methods in turn.
4.3.2 Prevention Of Water Pollution
India’s water resources are degrading rapidly, and the rivers show it most clearly. A major river usually keeps better quality in its upper stretches, where it runs through thinly settled hilly country. The trouble begins in the plains, where its water is used intensively — for irrigation, drinking, household needs and industry all at once.
There, drains empty into the river from every side. They carry agricultural waste — the fertilizers and insecticides washed off fields — along with domestic waste, the solid and liquid refuse of homes, and industrial effluents. The pollutants they bring pile up, and their concentration climbs highest in summer, when the river’s own flow is low and there is little clean water to dilute them.
The Rivers Under Watch
The scale of the problem is measured, not guessed. The Central Pollution Control Board (CPCB), working with the State Pollution Control Boards, monitors the quality of the country’s water at 507 stations. Their data point to organic and bacterial contamination — the waste of living things — as the main source of river pollution.
The worst-hit stretches are named. The Yamuna is the most polluted river in the country between Delhi and Etawah, a town downstream in Uttar Pradesh. Other severely polluted rivers include the Sabarmati at Ahmedabad, the Gomti at Lucknow, the Kali, the Adyar and the Cooum (fouled along their entire lengths), the Vaigai at Madurai, the Musi at Hyderabad, and the Ganga at Kanpur and Varanasi. Groundwater, too, is contaminated in places by high concentrations of heavy and toxic metals, fluoride and nitrates.
A map of the Ganga and the towns strung along it shows how quality changes from one reach to the next.
Map
Fig. 4.2 Caption: The Ganga and its tributaries, and the towns located along them. Brief: Map of northern India tracing the Ganga and its tributaries, including the Yamuna, with major cities marked as dots — Delhi, Prayagraj, Varanasi and other big cities — and Varanasi distinguished in the key. Add callout boxes marking stretches of good-quality water in the upper reaches and poor-quality water near Delhi and further downstream. Show neighbouring countries, the seas and the Tropic of Cancer for orientation. The map must show the full extent of India as officially defined.
It is worth tracing this pattern yourself: list the major towns that sit on the Ganga and its tributaries, and the industries each of them holds. Where the big cities and factories line a river, its pollution usually follows.
Laws On Paper
India does have laws for this. The Water (Prevention and Control of Pollution) Act of 1974 and the Environment Protection Act of 1986 were meant to guard water quality, but they have not been enforced effectively. The gap between law and practice shows in the numbers: as far back as 1997, some 251 polluting industries were still operating along the country’s rivers and lakes. The Water Cess Act of 1977, meant to curb pollution by charging for water use, made only marginal difference.
Because the law alone has fallen short, public awareness matters greatly. When people understand what water pollution costs them, their pressure and action can be very effective in cutting the pollutants that pour from farms, homes and industry. The chapter reproduces a set of news reports showing water as both a trigger of conflict and a reason for cooperation, and even a desert district struggling with floods; the issues those reports raise are worth discussing, close to home and across the world.
4.3.3 Recycle And Reuse Of Water
Another way to stretch the freshwater supply is to recycle and reuse it — using water more than once, and putting lower-quality water to jobs that do not need it clean. Reclaimed wastewater, for instance, is an attractive choice for industries that need water for cooling or fire-fighting, and it lowers their water costs.
The same idea works at home. In towns, the water left after bathing or washing utensils can water a garden, and so can the water used to wash a vehicle. Every such reuse saves the better-quality water for what really needs it — drinking. At present recycling is done only on a limited scale, but the scope for replenishing supply this way is enormous.
A good place to see this is your own home. Watch how much water each activity uses through a day, and list the ways that water could be reused or recycled — a discussion worth having as a class.
4.4 Watershed Management
Watershed management means the efficient management and conservation of a watershed’s surface and groundwater. A watershed is all the land whose rainfall drains to a common point — a stream, a river or a reservoir; to manage it is to care for that whole drainage area’s water and soil together.
At its narrowest, watershed management works to stop water running off and wasting, and instead to store it and send it underground. It does this through structures like percolation tanks — ponds built to let water soak, or percolate, slowly into the ground — and recharge wells, which guide water down to refill the aquifer. In its broad sense, though, it goes further: the conservation, regeneration and careful use of every resource within a watershed, natural and human alike — land, water, plants, animals and the people who live there.
The aim is balance: between the natural resources on one side and the society that draws on them on the other. And the single condition for success is people. Watershed development works only where the community takes part in it.
Programmes On The Ground
The Central and State Governments have launched many watershed programmes, some of them run by non-governmental organisations. Haryali is a Central Government project that helps rural people conserve water for drinking, irrigation, fisheries and afforestation — the planting of trees on bare land. It is carried out by the Gram Panchayats, the elected village councils, with the villagers’ own participation.
Other efforts are led locally. The Neeru-Meeru (‘Water and You’) programme in Andhra Pradesh, and the Arvary Pani Sansad in Alwar, Rajasthan, have built water-harvesting structures — percolation tanks, dug-out ponds known as Johad, and check dams, which are small barriers thrown across a stream to slow the water and help it soak in — all through people’s participation. Tamil Nadu has gone furthest, making rooftop water-harvesting structures compulsory: no building may be constructed without them.
The results so far are mixed. In some areas, watershed development has genuinely revived both the environment and the local economy. But the strong success stories are still few. In most places the programme is only in its early stage, and there is real need to spread awareness of what it can do. Through this integrated approach — managing all of a watershed’s water and resources as one system — water availability can be secured on a lasting basis.
A Village That Turned Itself Around
One place shows what is possible. Ralegan Siddhi, a small village in Ahmadnagar district of Maharashtra, has become a national model for watershed development.
Ralegan Siddhi’s real lesson is not the tank but the participation around it. That same tank had leaked for years; it held water only once the villagers chose to repair and maintain it themselves. Watershed work succeeds when a community treats the water as its own — which is exactly why the chapter insists that success rests on people’s participation, not on the structures alone. And the village’s lingering worry, its heavy use of fertilisers and pesticides, is a reminder that new prosperity brings new pressures on the very water it restored.
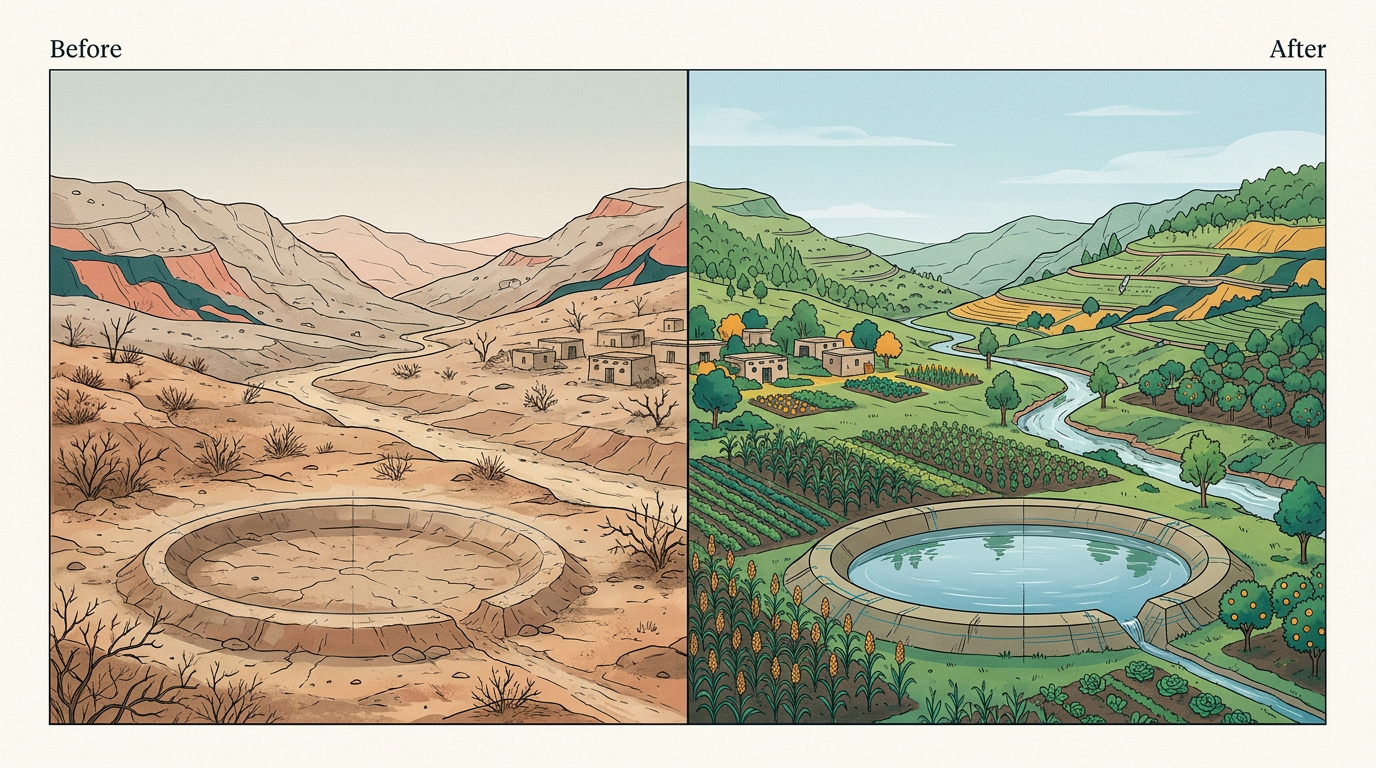
Fig. 4.3 – Ralegan Siddhi before and after watershed management.
4.5 Rainwater Harvesting
Rainwater harvesting is the method of catching and storing rainwater for use — and of guiding it underground to recharge the groundwater. It is a low-cost, eco-friendly way of saving every drop, leading rain to a borewell (a deep, narrow drilled well), or to pits and ordinary wells.
Its benefits run in several directions at once. It raises the amount of water available, and it checks the falling water table by refilling the ground. By diluting what is already down there, it improves groundwater quality, thinning out contaminants like fluoride and nitrates. And by catching rain before it can rush away, it guards against soil erosion and flooding — and, along the coast, against saltwater intrusion, the pushing of seawater into freshwater aquifers, the underground rock layers that hold water, when the harvested rain is used to recharge them.
Old Ways And New
People across India have harvested rainwater for a very long time. In the countryside, the traditional way is to use surface storage bodies — lakes, ponds and irrigation tanks. In Rajasthan, harvesting takes an underground form: structures called Kund or Tanka, covered underground tanks built in or near the house or village, store the caught rain.
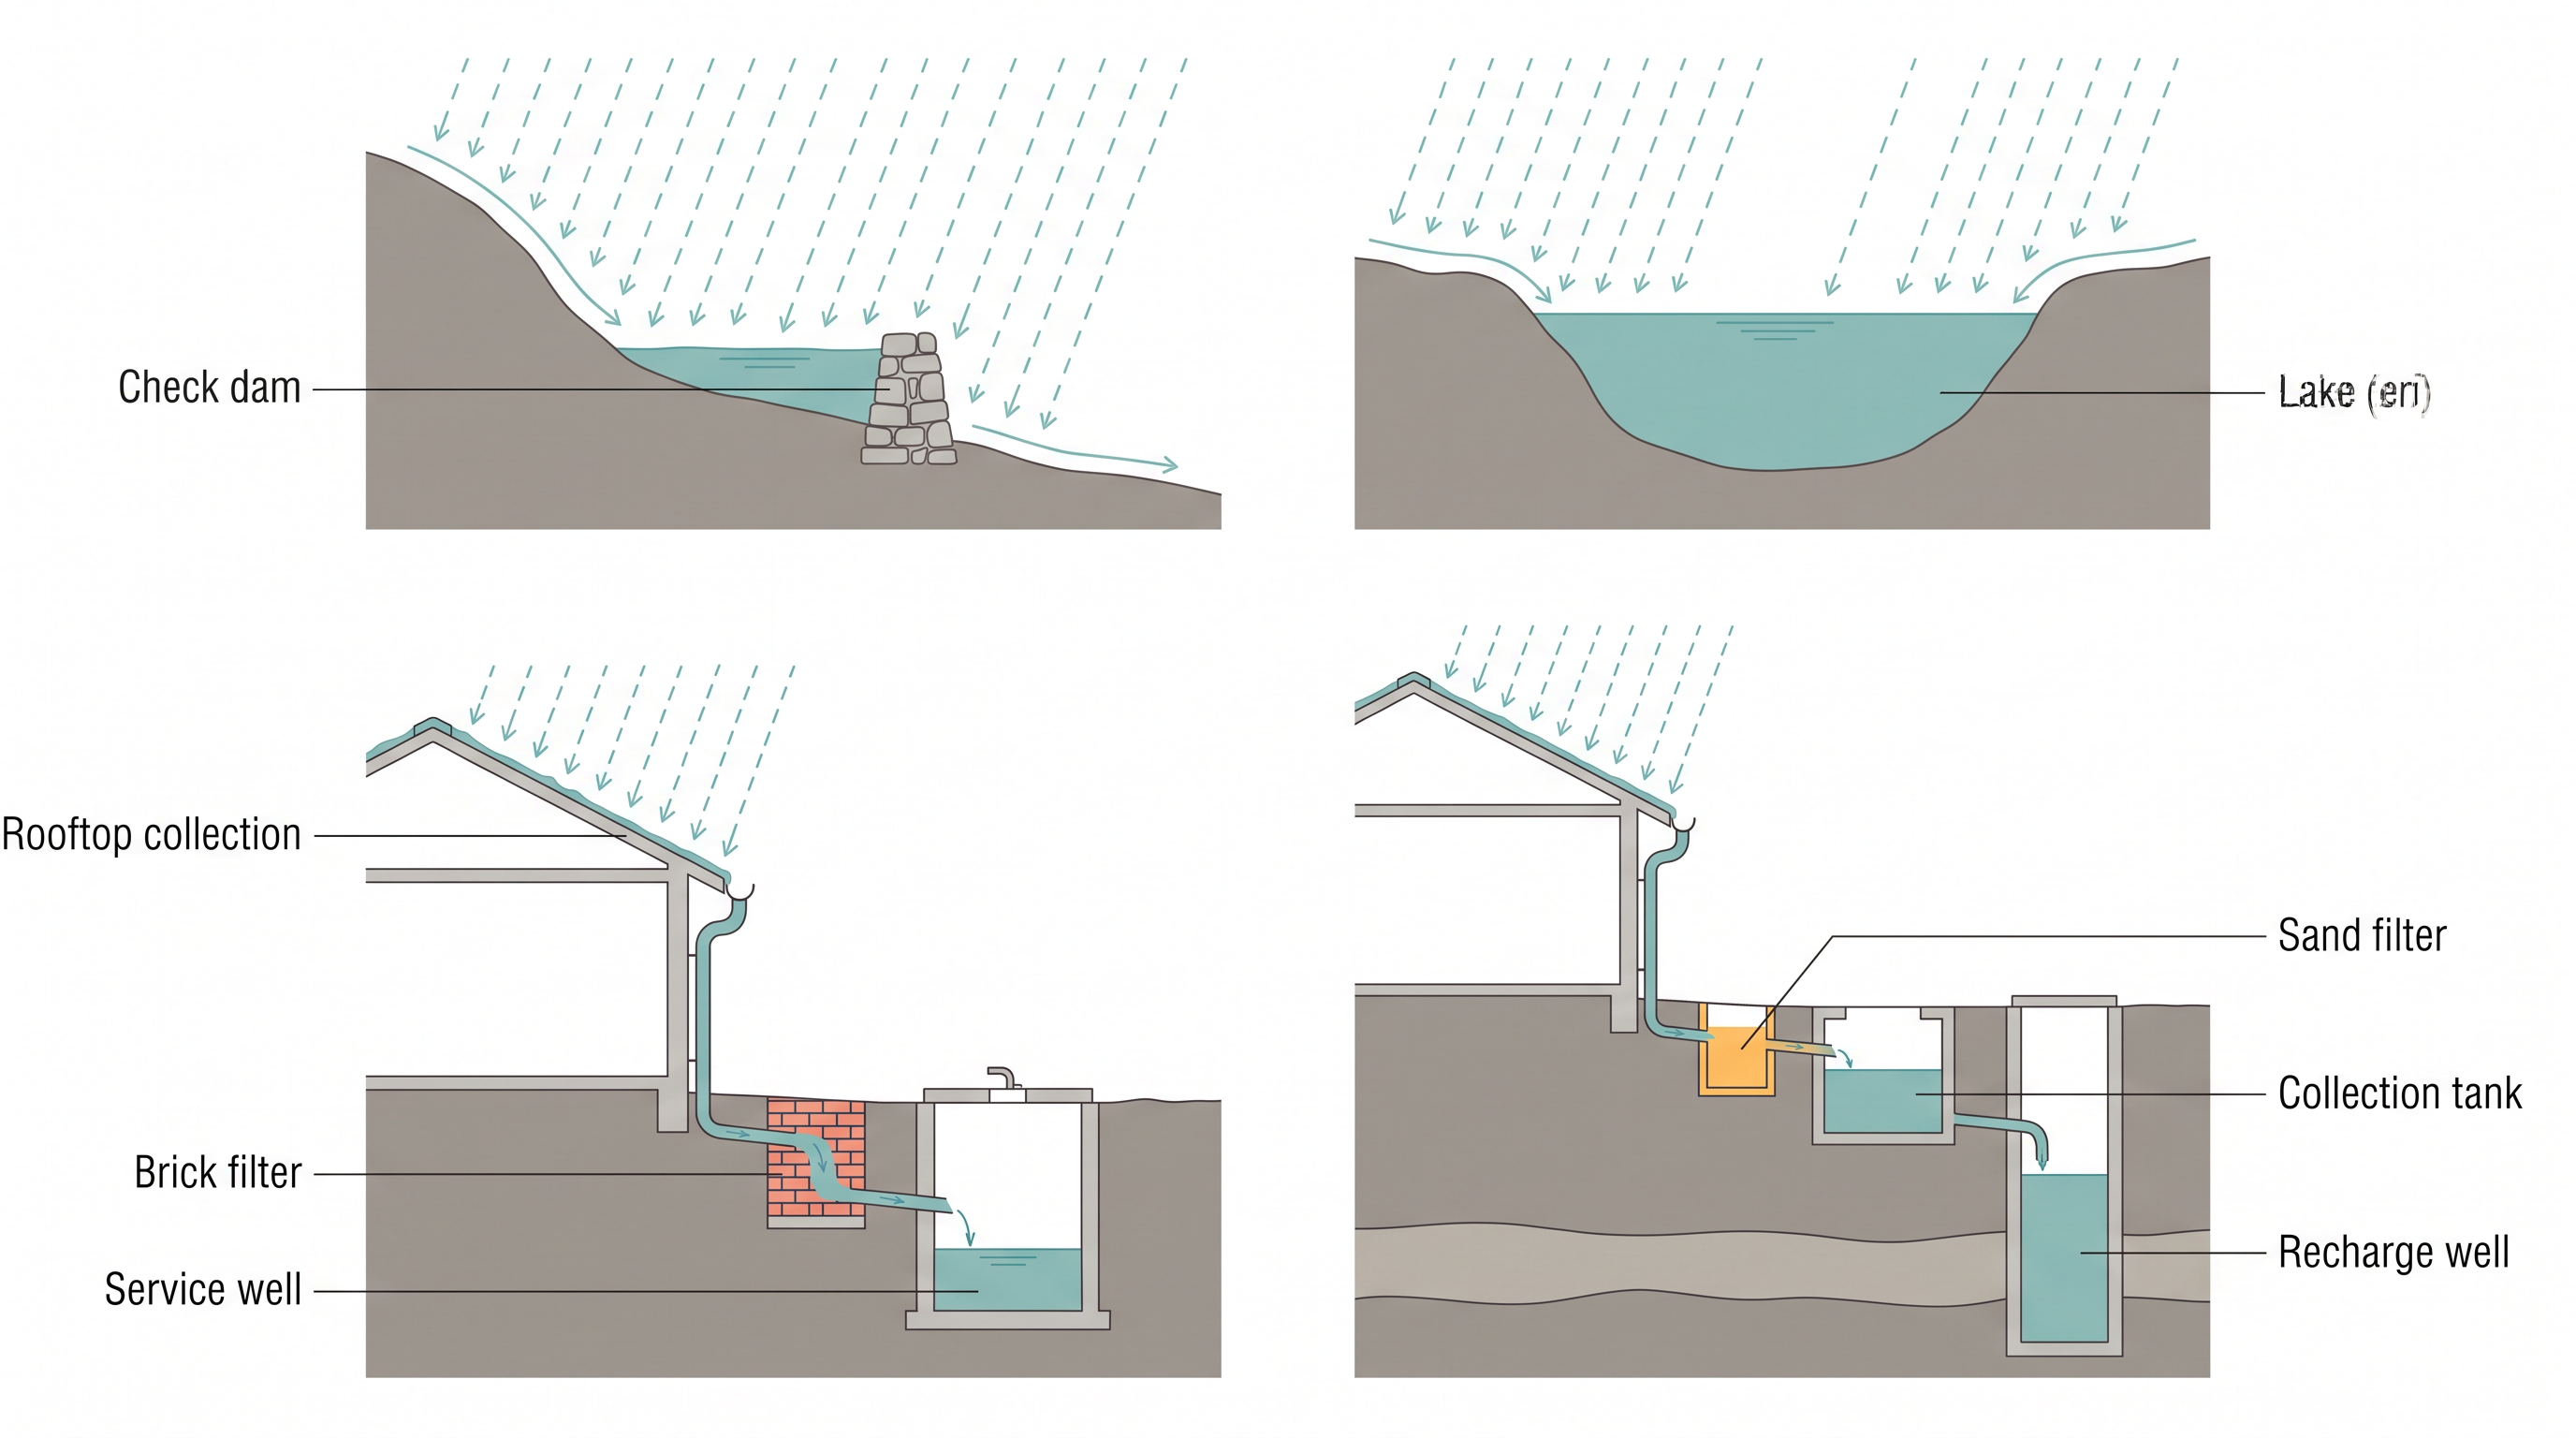
Fig. 4.4 – Methods of rainwater harvesting.
The scope for this is wide. Rainwater can be harvested from rooftops and open spaces alike, and doing so lessens a community’s dependence on groundwater for its daily domestic needs. It bridges the gap between demand and supply, and it even saves the energy spent pumping groundwater, because the recharge lifts the water table closer to the surface. Many states are now taking it up on a large scale. Cities and towns stand to gain most of all, since in most of them demand for water has already outstripped supply.
The Question Of Price
Rainwater harvesting is not the only remedy on the table. Along the coast, desalinisation could ease shortages; in arid and semi-arid tracts, so could the treatment of brackish water; and water might be moved from surplus regions to deficit ones by inter-linking rivers, a possibility the chapter raises for further reading rather than detail. Yet for the individual user, the household and the community, the chapter names one issue as the most important of all: the pricing of water.
Running alongside these policies is the Jal Kranti Abhiyan, launched by the Government of India in 2015-16 to secure water — and with it, per capita availability — across the country. Recognising that people in different regions had long practised traditional water conservation, it works by drawing in local bodies, NGOs and ordinary citizens to build awareness of its aims.
Its main activities are four. It picks one water-stressed village in each of the country’s 672 districts to develop into a model ‘Jal Gram’. It marks out model command areas — the areas a project irrigates — of about 1,000 hectares each (a hectare is 10,000 square metres, so this is roughly 10 square km) in different regions: Uttar Pradesh and Haryana in the north, Karnataka, Telangana and Tamil Nadu in the south, Rajasthan and Gujarat in the west, Odisha in the east and Meghalaya in the north-east.
It also abates pollution — through water conservation, artificial recharge, curbing groundwater pollution and building arsenic-free wells — and raises mass awareness through social media, radio, television, print, posters and school essay competitions. The whole effort is designed to deliver livelihood and food security through water security.
4.6 Summary
- Water is a cyclic resource: about 71 per cent of the earth’s surface is water, but freshwater is only about 3 per cent of it, and only a small part of that is usable. Availability varies over space and time.
- India has about 2.45 per cent of the world’s land, about 4 per cent of its water and more than 17 per cent of its people. Of roughly 4,000 cubic km of precipitation a year, only about 1,122 cubic km is utilisable.
- Surface water comes from rivers, lakes, ponds and tanks. India has about 10,360 rivers; the mean annual flow is about 1,869 cubic km, but only about 690 cubic km — 32 per cent — can be used.
- Rainfall decides the share: the Ganga, Brahmaputra and Barak basins carry about 60 per cent of the surface water on roughly a third of the land.
- Replenishable groundwater is about 432 cubic km. Use is very high in Punjab, Haryana, Rajasthan and Tamil Nadu, and low in states like Chhattisgarh, Odisha and Kerala.
- Along the coast, lagoons and backwaters in Kerala, Odisha and West Bengal hold brackish water, used for fishing and for salt-tolerant paddy and coconut.
- India’s water demand is dominated by irrigation. Agriculture takes about 89 per cent of surface water and 92 per cent of groundwater; industry and domestic use are small but likely to grow.
- Irrigation is needed because rainfall varies in space and time, and the green revolution’s high-yielding crops need assured moisture. Punjab, Haryana and western Uttar Pradesh irrigate over 85 per cent of their net sown area, largely from wells and tubewells.
- Heavy pumping has depleted groundwater and lowered the water table, and over-withdrawal has raised fluoride in Rajasthan and Maharashtra and arsenic in parts of West Bengal and Bihar.
- Per capita water availability is falling as population rises, while pollution shrinks the usable share further.
- Rivers stay cleaner in the hills and foul in the crowded plains, with pollution worst in the low-flow summer. The CPCB monitors 507 stations; the Yamuna between Delhi and Etawah is the most polluted river. Laws exist but are weakly enforced.
- Conservation rests on watershed development, rainwater harvesting, recycling and reuse, and conjunctive use — and, as Ralegan Siddhi shows, on community participation.
- Rainwater harvesting raises availability, recharges groundwater, improves its quality and saves pumping energy. National policy and the pricing of water are now central questions.
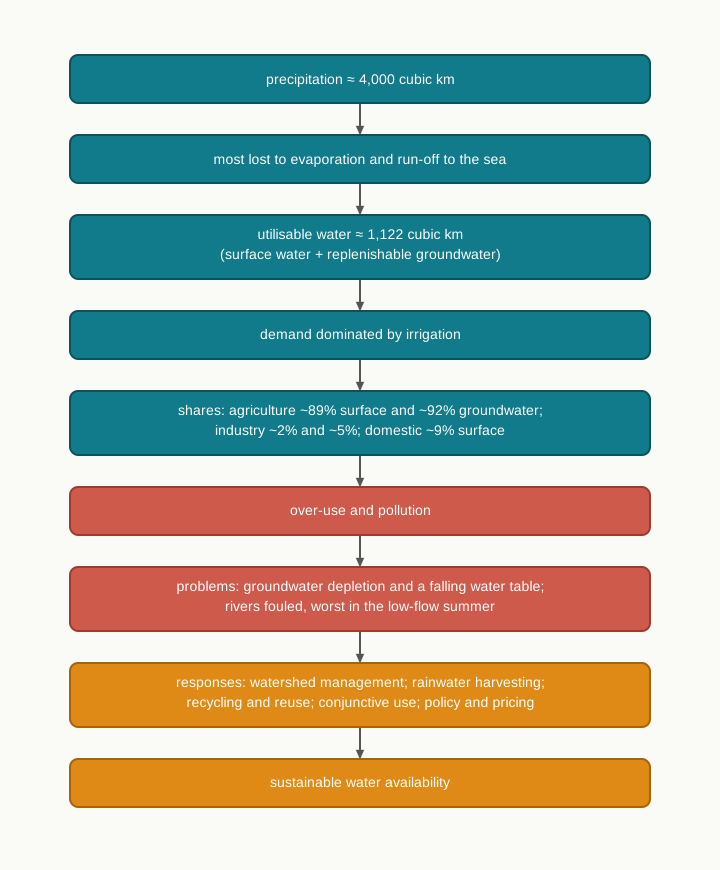
Fig. 4.5 – India’s water from precipitation to sustainable use.
What This Chapter Cannot Tell You
- A national figure like 1,122 cubic km hides enormous gaps in space and season: a country average says nothing about the district that runs dry in May or the basin that floods in July.
- Several numbers here are dated — the 1997 count of polluting industries, and older utilisation figures — and are kept exactly as the chapter gives them, not updated to today.
- A utilisation percentage tells you how water is divided between farms, factories and homes, not whether any one household actually has enough clean water to drink.
4.7 NCERT Questions
- Which one of the following types describes water as a resource?
- Abiotic resource
- Non-renewable Resources
- Biotic Resource
- Non-cyclic Resource
- Which one of the following south Indian states has the highest groundwater utilisation (in per cent) of its total groundwater potential?
- Tamil Nadu
- Karnataka
- Andhra Pradesh
- Kerala
- The highest proportion of the total water used in the country is in which one of the following sectors?
- Irrigation
- Industries
- Domestic use
- None of the above
- It is said that the water resources in India have been depleting very fast. Discuss the factors responsible for the depletion of water resources. (30 words)
- What factors are responsible for the highest groundwater development in the states of Punjab, Haryana and Tamil Nadu? (30 words)
- Why is the share of the agricultural sector in the total water used in the country expected to decline? (30 words)
- What can be the possible impacts of the consumption of contaminated or unclean water on the people? (30 words)
- Discuss the availability of water resources in the country and the factors that determine its spatial distribution. (150 words)
- The depleting water resources may lead to social conflicts and disputes. Elaborate with suitable examples. (150 words)
- What is watershed management? Do you think it can play an important role in sustainable development? (150 words)
4.8 Check Your Concepts
- On Fig. 4.1 the river basins are shaded into two groups. What does the shading distinguish, and to which seas do the two groups of rivers flow?
- Why are lagoons and backwaters found along the coasts of Kerala, Odisha and West Bengal, and why is the water they hold of only limited use?
- Study Fig. 4.2. Why does the Ganga carry good-quality water in some stretches but poor-quality water as it passes the big cities, and why would those stretches look worse in summer than in the monsoon?
- Contrast how far the rivers of south India — the Godavari, the Krishna and the Kaveri — have been harnessed with the position in the Ganga and Brahmaputra basins.
- Set out, as a chain, how harvesting rainwater from a rooftop can both raise the water table and improve the quality of the groundwater below.
- Arrange in order the steps by which intensive well and tubewell irrigation in the north-west leads first to a falling water table and then to rising fluoride and arsenic in groundwater.
- Using the chapter’s own figures, show how India’s yearly precipitation of about 4,000 cubic km comes down to about 1,122 cubic km of utilisable water. Roughly what share of the rain that falls can actually be used?
- India’s utilisable water resource is about 1,122 cubic km. Explain why this single national figure tells you little about whether a particular district or village has enough water through the year.