Chapter 9: Geographical Perspective On Selected Issues And Problems
The river reaches the city clean enough to drink from. It leaves the city a different thing.
Follow it downstream on any winter morning. Where the first factories back onto the water, the current darkens. Warm effluent slides in from a pipe, and a raft of grey-white foam gathers along the bank, thick enough to lift on a stick. Homes empty their drains into the same flow; farms upstream have washed their fertiliser into it. The water still moves, but it can no longer clean itself — there is simply too much in it for the river to break down.
On the bank, a boy of seventeen watches a boat go out through the foam. His family reached the city two years ago, after the land back in their village stopped yielding enough to live on. They came because the small town nearby had no work, and only the big city did. Now they share one rented room in a lane too narrow for a bicycle, breathing air that turns to grey smog by afternoon, beside a heap of waste that no one comes to clear.
Everything he can see — the foam, the smog, the shanty, the worn-out fields left behind — is one story told through different media. Human activity produces waste faster than air, water and land can absorb it. This chapter is about what happens next, and to whom.
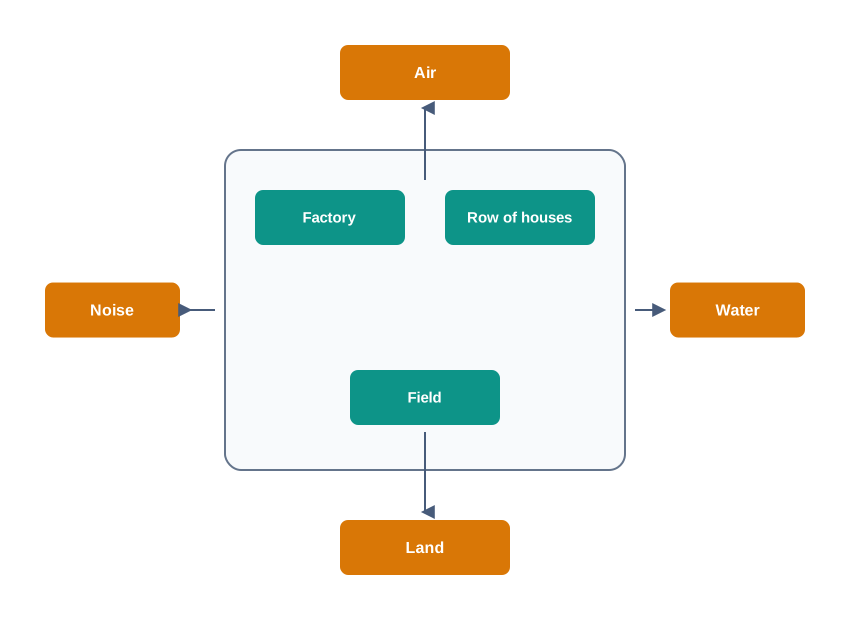
Fig. 9.0 – The four receiving media for settlement waste.
9.1 Environmental Pollution
Environmental pollution is the release of substances and energy from the waste products of human activities into the surroundings, in amounts the surroundings cannot absorb. The thing that does the damage is called a pollutant — the actual substance or form of energy, whether a chemical, a metal, heat or sound, added to air, water or land in a harmful quantity. Pollution is the condition; the pollutant is what causes it.
Pollution is classified by the medium through which the pollutant is carried and spread. On that basis there are four types: air pollution, water pollution, land pollution and noise pollution. The same activity can feed more than one type at once — a single factory may pour effluent into a river, smoke into the air and debris onto the land.
Table 9.1 sets the four types side by side, listing for each the contaminants involved and where they come from.
9.1.1 Water Pollution
The indiscriminate use of water by a growing population and by expanding industry has degraded water quality considerably. Surface water — the water we draw from rivers, canals, lakes and tanks — is never pure to begin with. It always carries small quantities of suspended particles and of organic and inorganic substances.
The trouble starts when the concentration of these substances rises. Every water body can break down and dilute a certain load of material on its own; this is its self-purifying capacity. Once the load pushed into the water exceeds that capacity, the water can no longer clean itself. It stays polluted, and becomes unfit for use.
The photograph in Fig. 9.1 shows what that failure looks like at close range — a boat rowing through a thick layer of foam on a heavily polluted river, where effluent (the liquid waste discharged by industries and towns) has overwhelmed the current.
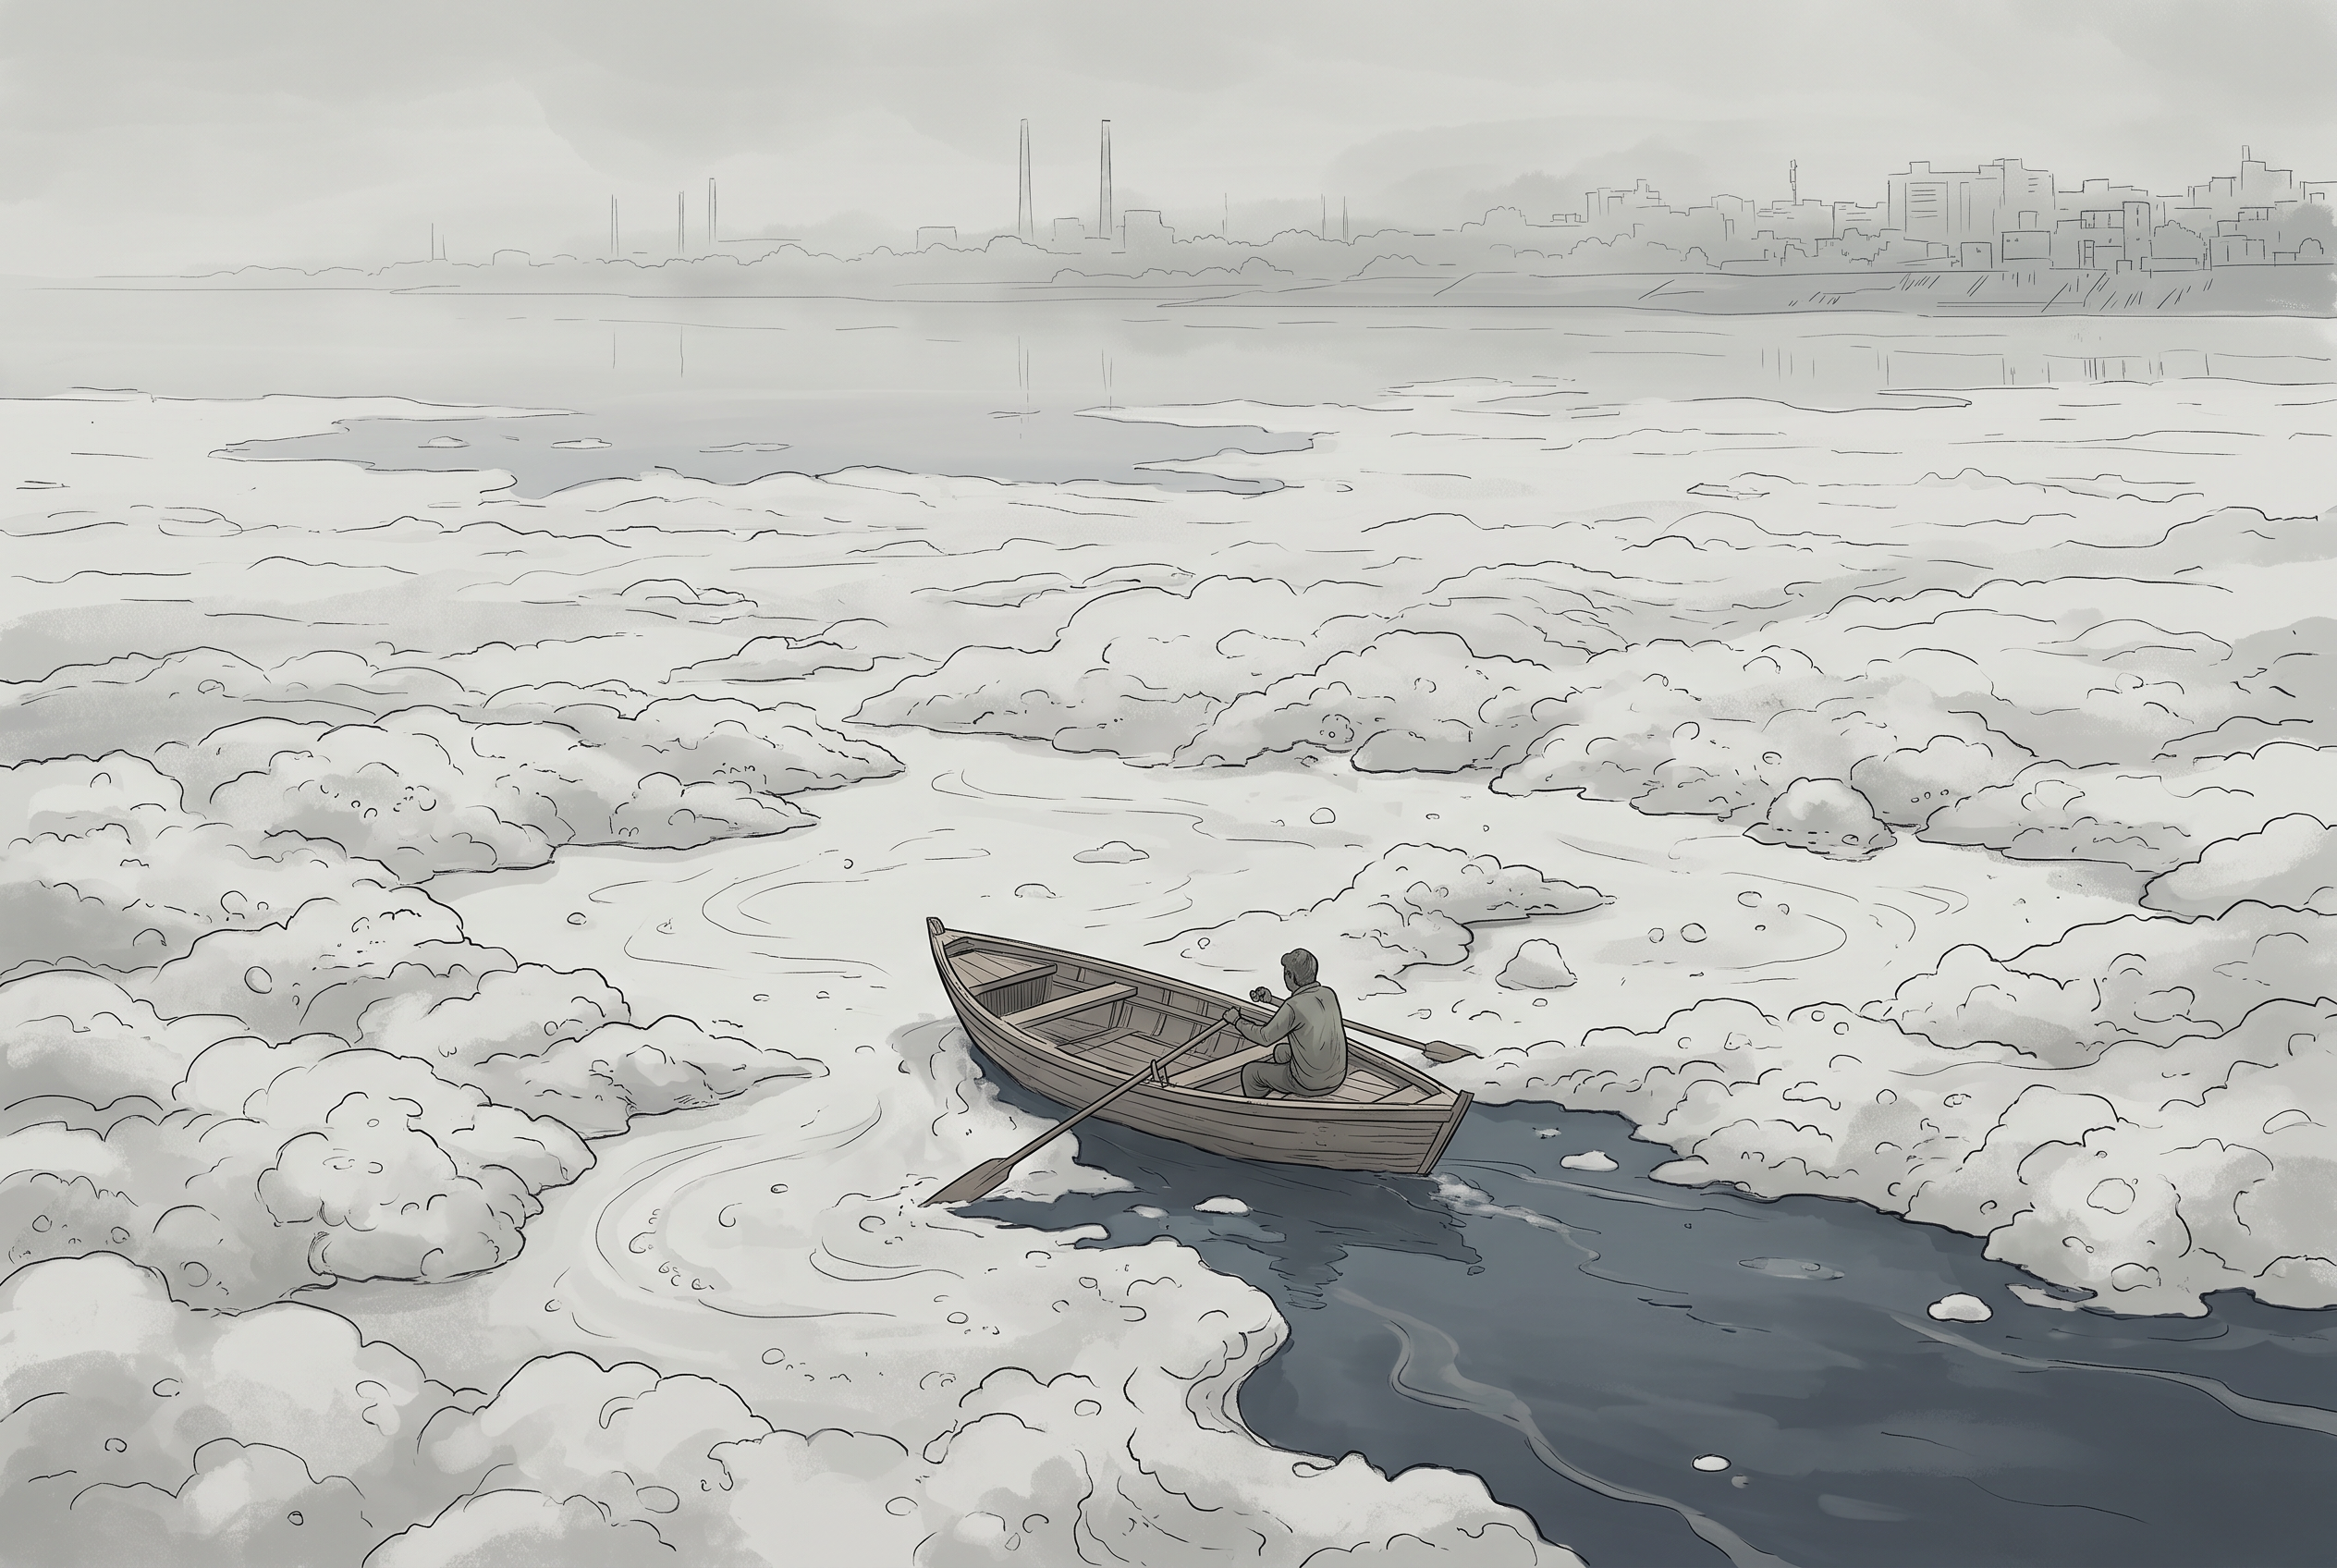
Fig. 9.1 – Heavy foam pollution on the Yamuna river.
Who Pollutes The Water
Water pollutants do come from natural sources — erosion, landslides, and the decay and decomposition of plants and animals. But the pollutants that arise from human activity are the real cause of concern. People pollute water through industrial, agricultural and cultural activities, and of these, industry is the single most significant contributor.
Industries turn out a long list of unwanted products: industrial wastes, polluted waste water, poisonous gases, chemical residues, heavy metals, dust and smoke. Most of these wastes are dumped into running water or lakes. From there the poisonous elements travel into reservoirs, rivers and other water bodies, where they destroy the living system of the water. The industries that pollute water most heavily are leather, pulp and paper, textiles and chemicals.
Modern agriculture adds its own chemicals — inorganic fertilisers, pesticides and herbicides. Rain and irrigation wash these down into rivers, lakes and tanks, and they also soak into the soil to reach the groundwater below. Fertiliser in particular pushes up the nitrate content of surface waters. On top of this, cultural activities such as pilgrimages, religious fairs and tourism add their own waste to the water.
Put together, these streams explain a stark fact: in India, almost all surface water sources are contaminated and unfit for human consumption. Fig. 9.2 traces how the separate sources converge to a single outcome.
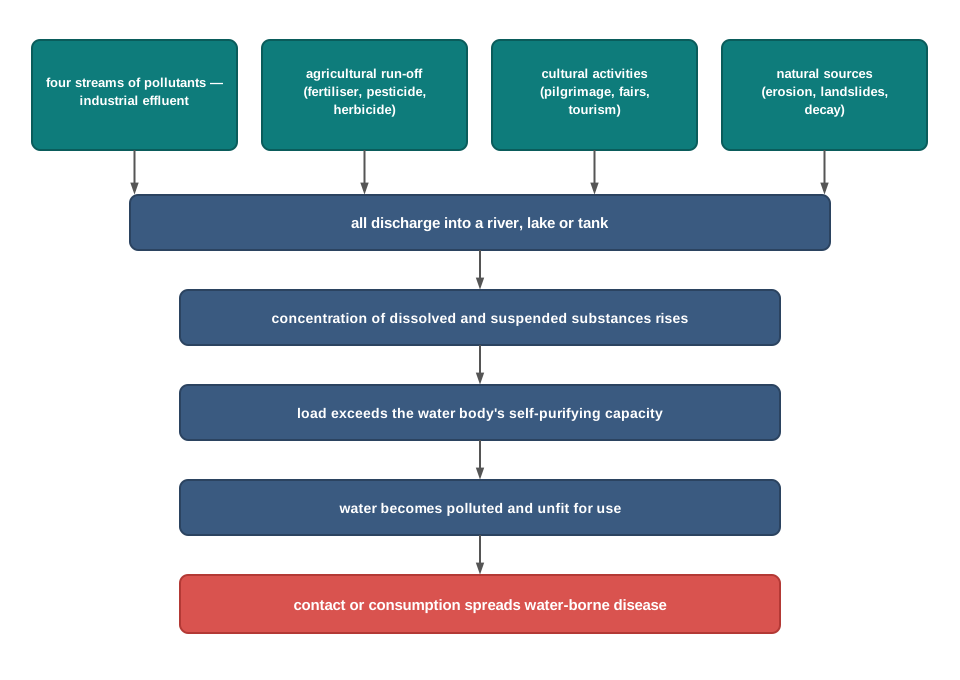
Fig. 9.2 – Exceeding a river’s self-purifying capacity.
Table 9.2 grounds this in two rivers, naming the stretches that are worst affected, the nature of the pollution in each, and the parties chiefly responsible.
The Cost In Disease
Polluted water is a source of many water-borne diseases — those spread by drinking or handling contaminated water — such as diarrhoea, intestinal worms and hepatitis. The scale is not small. The World Health Organization reports that about one-fourth of the communicable diseases in India are water-borne.
River pollution is common to every river. But the pollution of the Ganga has caused the greatest concern, because it flows through one of the most densely populated regions of the country, so more people depend on it and more waste enters it. To improve the river’s condition, the National Mission for Clean Ganga was set up, and the Namami Gange Programme was launched under it.
9.1.2 Air Pollution
Air pollution is the addition of contaminants — dust, fumes, gas, fog, odour, smoke or vapour — to the air in a proportion and for a duration great enough to harm flora (plant life), fauna (animal life) and property. As we burn a growing variety of fuels for energy, the emission of toxic gases into the atmosphere rises sharply, and the air is polluted as a result.
The main sources are the combustion of fossil fuels, mining and industries. These processes release oxides of sulphur and nitrogen, hydrocarbons, carbon dioxide, carbon monoxide, lead and asbestos into the air.
What Air Pollution Does To Health
Air pollution causes a range of diseases affecting the respiratory, nervous and circulatory systems — that is, the systems of breathing, of the nerves, and of the blood and heart. The toll is heavy enough that the World Health Organization has called air pollution the world’s biggest environmental health risk, linking it to at least one in eight deaths worldwide.
Smog And Acid Rain
The smoky fog that hangs over cities is called urban smog — literally smoke and fog together — and it is produced by atmospheric pollution. It is very harmful to human health.
Air pollution can also cause acid rain. Acid rain is rainfall made acidic when the oxides of sulphur and nitrogen in the air dissolve into it. Analysis of urban rainwater shows a telling pattern: the pH value of the first rain after summer is always lower than that of the rains that follow. Here pH is simply a measure of acidity — the lower the pH, the more acidic the water — so a lower pH in that first shower means it is the most acidic rain of the season.
9.1.3 Noise Pollution
Noise pollution is the state of unbearable and uncomfortable sound, caused by noise from different sources. Unlike the older forms of pollution, it has become a serious concern only in recent years, driven by a range of technological innovations.
Where The Noise Comes From
The main sources of noise pollution are various factories, mechanised construction and demolition work, automobiles and aircraft. To these are added bursts of noise from sirens and from loudspeakers used in festivals, programmes and community activities. The level of steady noise is measured by a sound level meter and expressed in decibels (dB), the standard unit for the loudness of sound.
Fig. 9.3 shows this being measured in the field — noise being monitored at a working mine, one of the many industrial sources on the list.
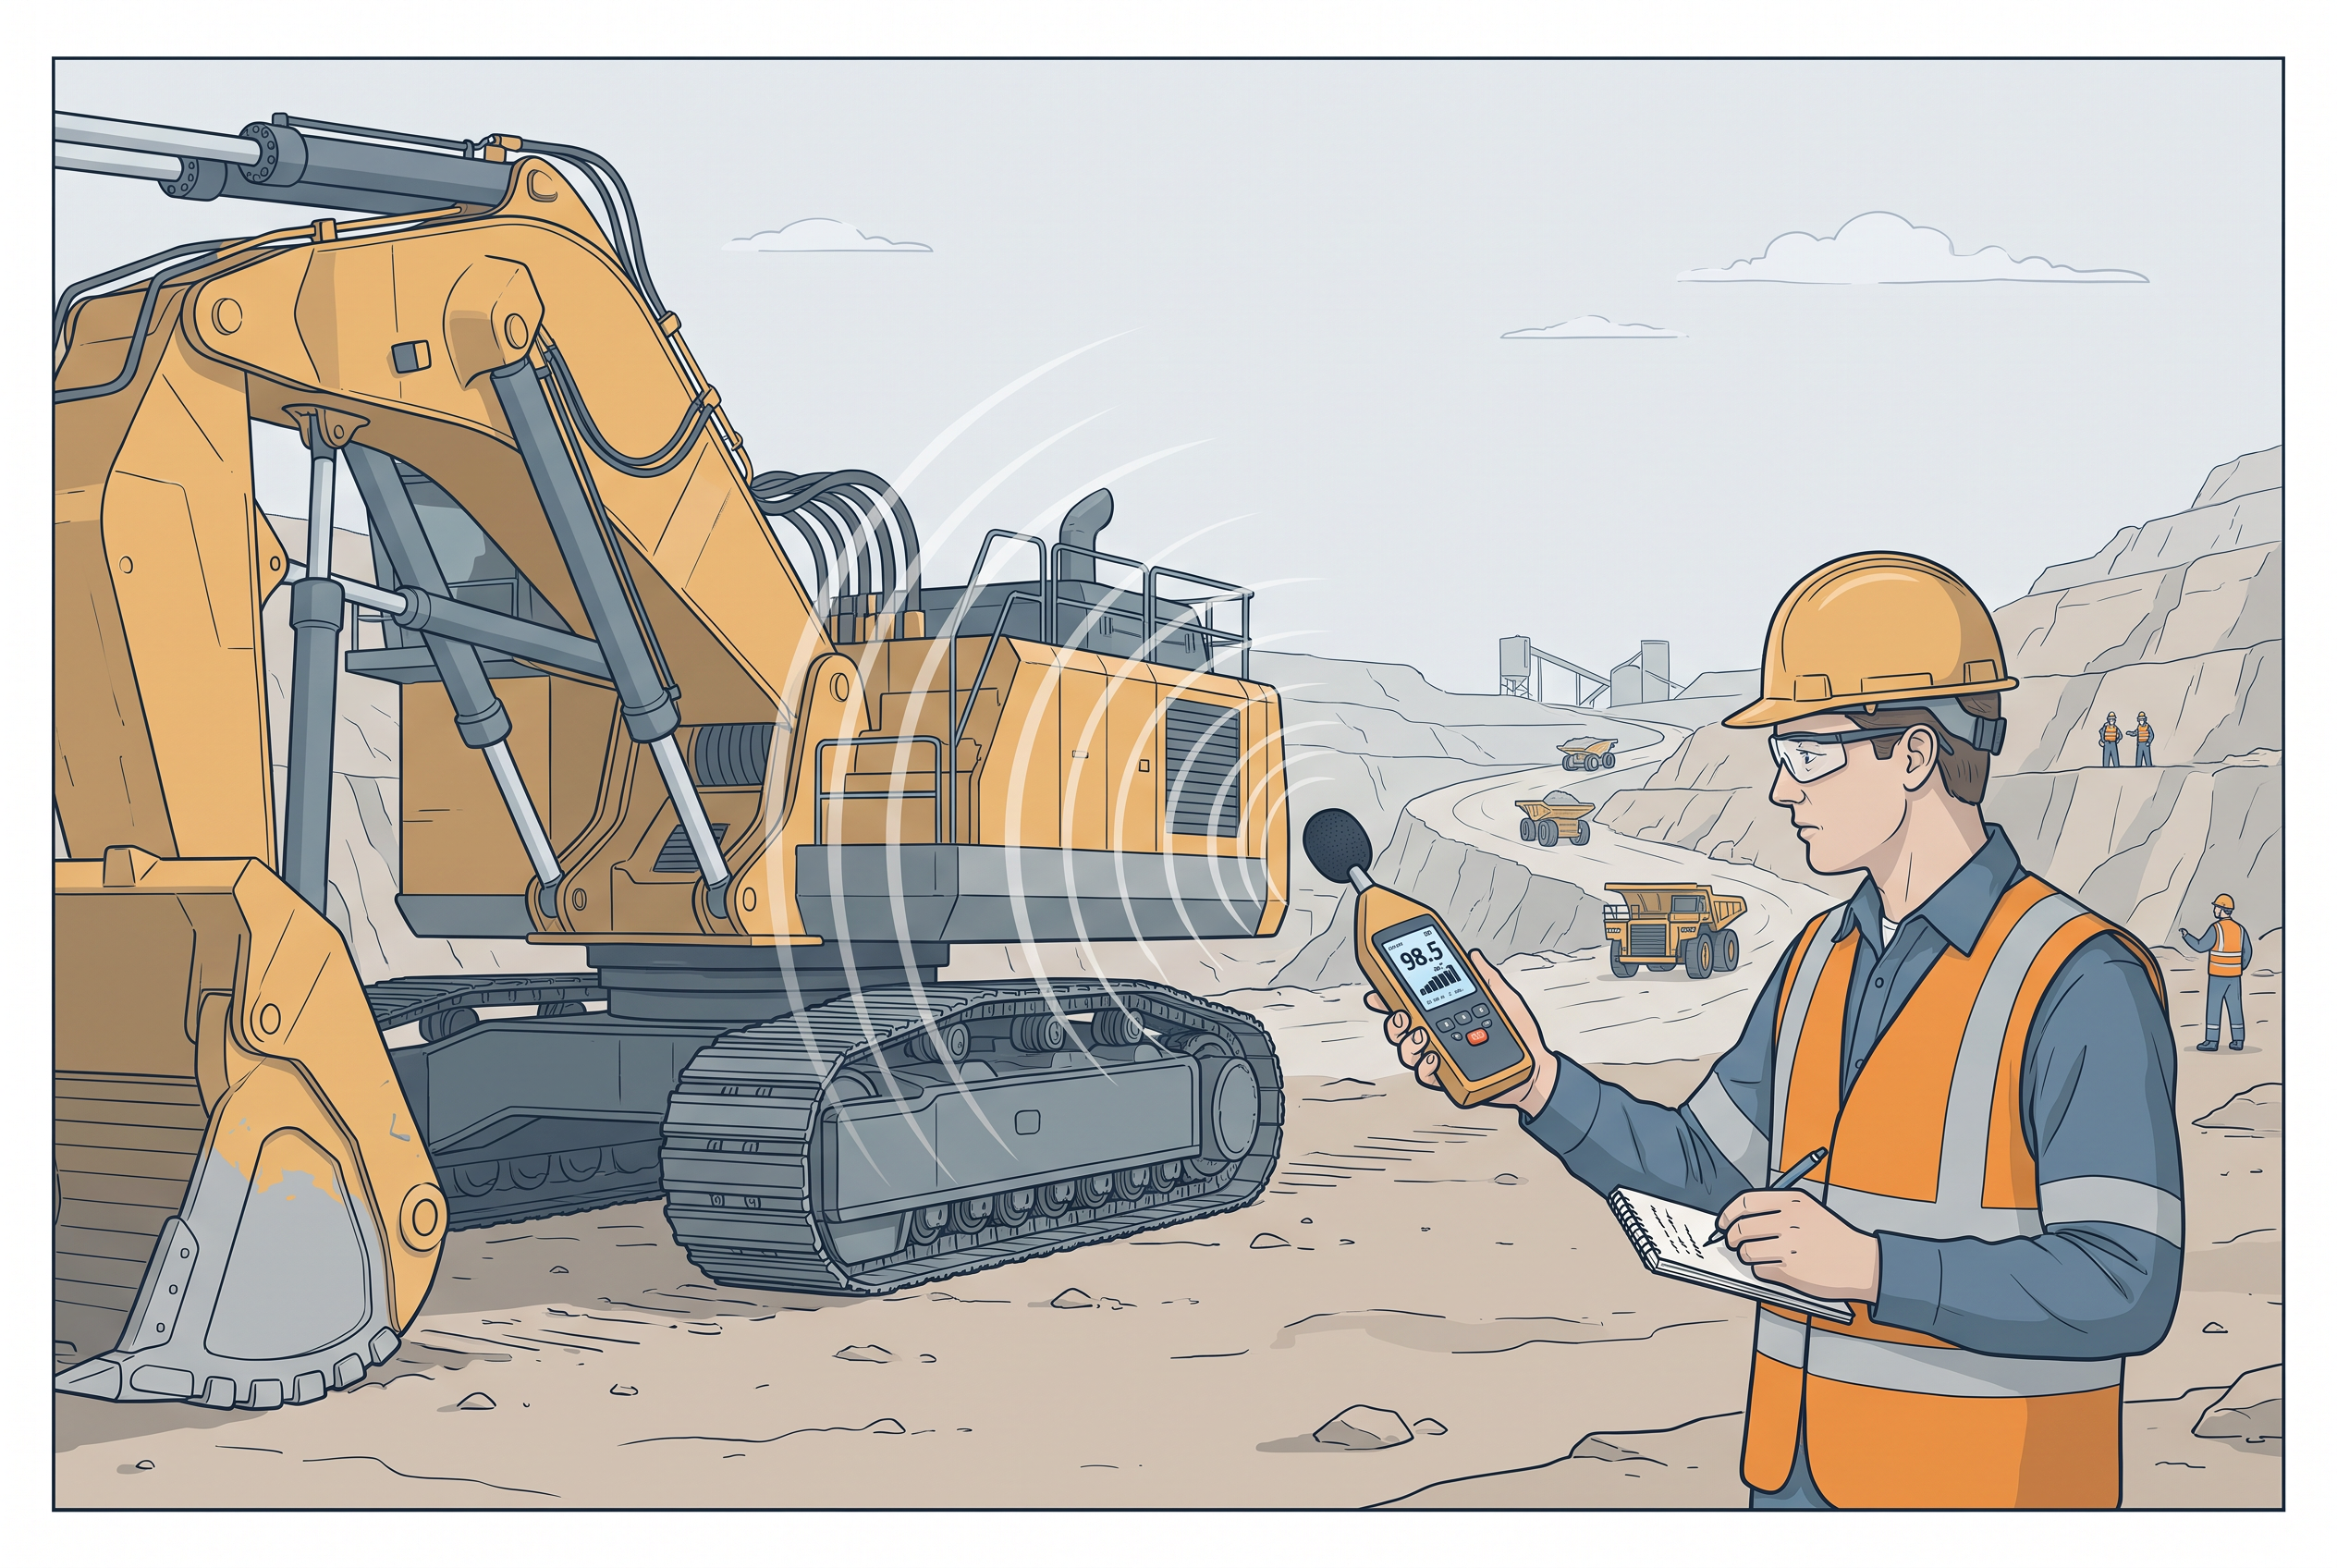
Fig. 9.3 – Noise monitoring at an open-cast mine.
Of all these sources, the biggest nuisance is the noise made by traffic. Its intensity and character depend on the type of aircraft, vehicle or train, on the condition of the road, and on the vehicle itself in the case of automobiles. In sea traffic, the noise is confined to the harbour, where loading and unloading go on. Industries too cause noise pollution, but with an intensity that varies from one type of industry to another.
Why Distance Matters
Noise pollution is location-specific: its intensity falls as you move away from the source, whether that source is an industrial area, an artery of transport or an airport. Because these sources cluster in cities, noise pollution is hazardous in many of India’s metropolitan and big cities.
9.2 Urban Waste Disposal
Urban areas are generally marked by overcrowding, congestion and facilities too few to serve a fast-growing population. The result is poor sanitary conditions and foul air. Within this setting, pollution by solid wastes has become a serious matter, simply because the quantity of waste generated has grown enormously.
What Counts As Solid Waste
Solid waste is the mass of old and used articles that a settlement throws away — for example, stained small pieces of metal, broken glassware, plastic containers, polythene bags, ash, floppies and CDs, dumped at different places. The same discarded material goes by the everyday names refuse, garbage and rubbish. Whatever we call it, it has to go somewhere, and where it goes decides how much harm it does.
The Two Streams Of Waste
Solid waste is disposed of from two sources: household or domestic establishments, and industrial or commercial establishments. The two streams are handled differently. Household wastes are dumped either on public lands or on the sites of private contractors. The solid wastes of industrial units, on the other hand, are collected and disposed of through public, municipal facilities at low-lying public grounds — the landfill areas, which are pits or hollows where waste is buried in bulk.
The volumes involved are large. Ashes and debris pour out from industries, thermal power houses and the constant construction and demolition of buildings, and their sheer bulk has posed problems of serious consequence.
Why Uncollected Waste Is Dangerous
Solid waste is a direct health hazard. It creates an obnoxious smell, and it harbours flies and rodents, which then act as carriers of diseases such as typhoid, diphtheria, diarrhoea, malaria and cholera. The danger grows whenever the waste is carelessly handled: wind spreads it about, and rainwater scatters it further. The problem is visible enough to have become the stuff of cartoons — garbage piling so high beside city homes that it blots out the very sea view for which people had moved a floor higher.
Industrial waste carries its harm into water as well. Because industrial units cluster in and around urban centres, their wastes accumulate there, and much of it is dumped straight into rivers. This turns solid-waste disposal into water pollution: untreated industrial discharge and untreated sewage from city-based industries create serious health problems for the communities living downstream.
Fig. 9.4 shows what accumulated urban waste looks like on the ground — refuse choking a narrow city lane, exactly the kind of open dumping that breeds disease.
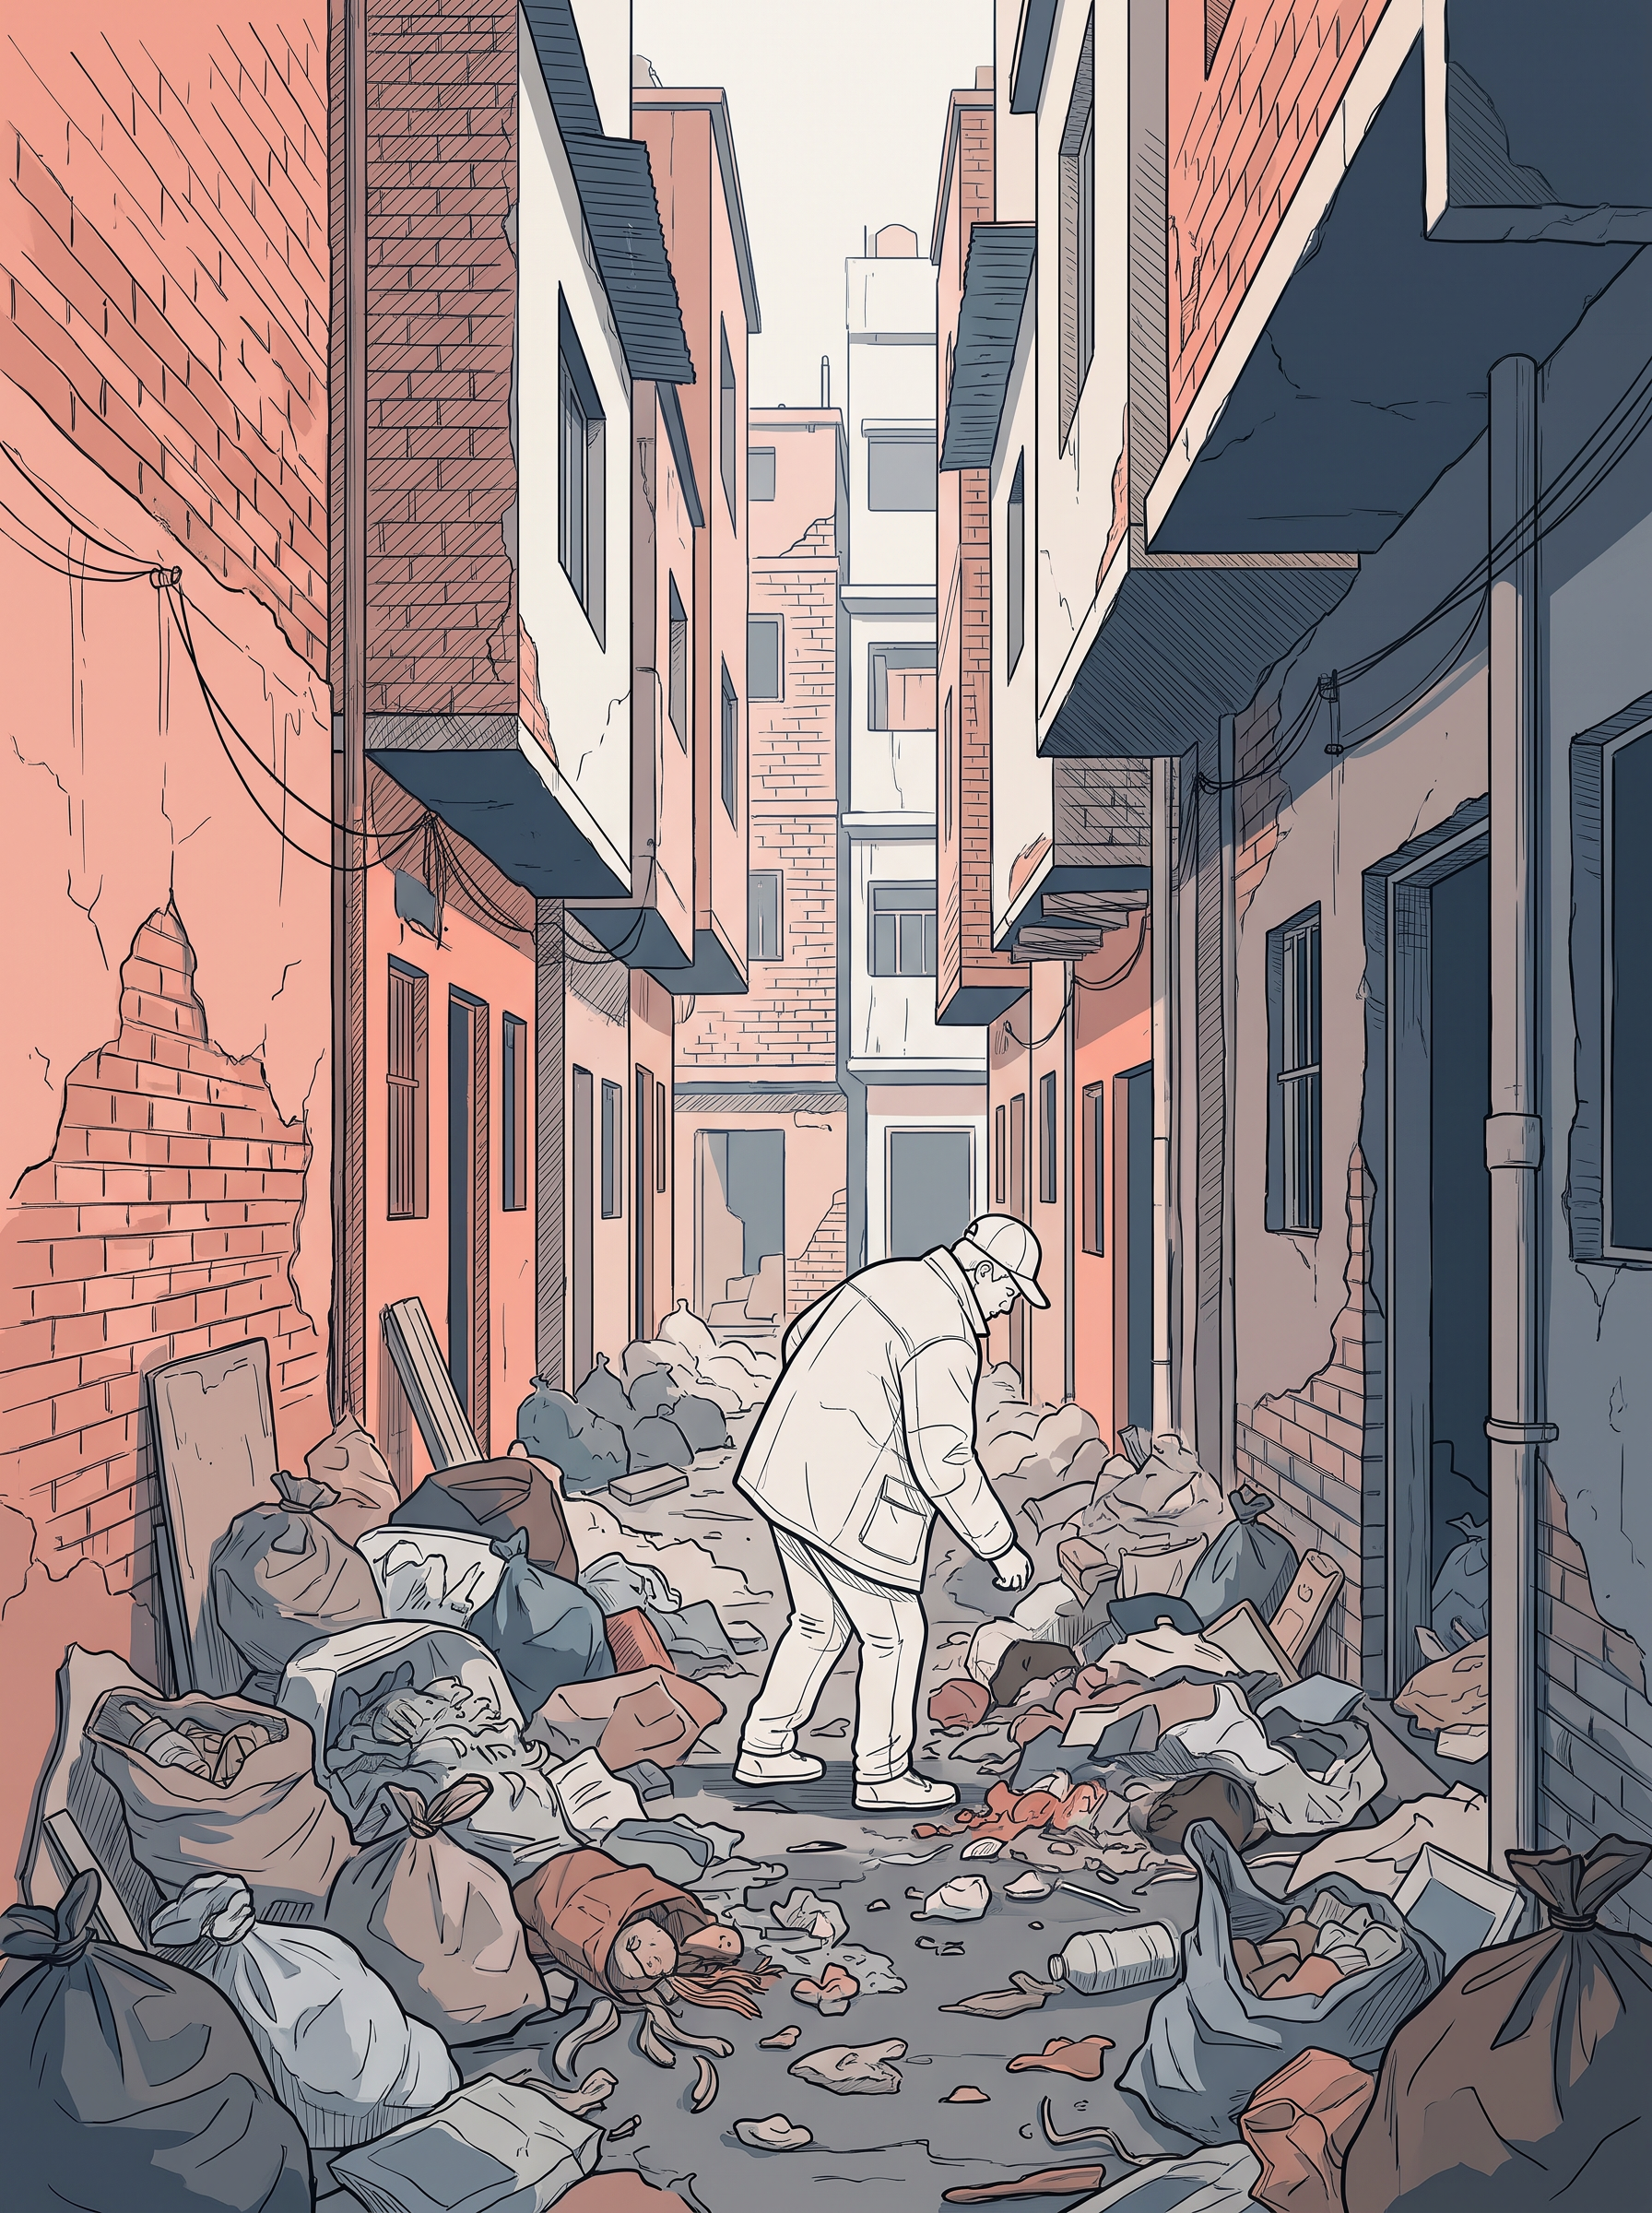
Fig. 9.4 – Uncollected urban waste in a narrow lane.
Urban waste disposal is a serious problem across India, and the burden is very unevenly shared between cities. In the large metropolitan cities — Mumbai, Kolkata, Chennai, Bengaluru and the like — about 90 per cent of the solid waste is collected and disposed of. But in most other cities and towns, roughly 30 to 50 per cent of the waste generated is left uncollected. It piles up on streets, in the open spaces between houses and on wastelands, where it becomes a serious health hazard.
Waste As A Resource
There is another way to see all this. Waste need not be only a burden — it should be treated as a resource and put to use for generating energy and compost, the crumbly, nutrient-rich material that rotted organic matter becomes. Left untreated, waste ferments slowly and releases toxic biogas, including methane, into the atmosphere; captured, that same gas can be burned for energy instead of warming the air.
This is worth pausing over as a reader. What do we throw away, and why? Where does our waste actually end up? Why do ragpickers sort through rubbish dumps at all — does the waste have value to them? And if it does, is our urban waste worth something after all? These questions are the doorway to treating garbage as a resource rather than a nuisance.
The village of Daurala shows that even the worst outcome of careless disposal — poisoned groundwater — can be turned around when the right people act together.
What Daurala really teaches is where the responsibility lay and who had to act. The pollution began with one source — untreated industrial wastewater — yet fixing it needed the NGO, the villagers, their representatives and the industrialists working as one. The measures attacked both the symptom and the cause: a new pipeline and tank gave people safe water at once, while desilting, recharge and rainwater harvesting slowly rebuilt the poisoned aquifer itself. The result also carries a caution — it took three years and the cooperation of every party, so recovery on this scale is neither quick nor automatic.
9.3 Rural–Urban Migration
The flow of people from rural to urban areas is set off by many factors working together. On one side there is a high demand for labour in the cities; on the other there are low job opportunities in the villages, and an unbalanced pattern of development that has left rural and urban areas far apart.
Push And Pull
It helps to sort these factors into two kinds. Push factors are the conditions in the village that drive people out — poverty, debt, too few jobs, and lopsided development. Pull factors are the conditions in the city that draw them in — a strong demand for labour and the promise, real or perceived, of better earnings. A person moves when the pull ahead outweighs the push behind.
In India, the urban population is rising rapidly. But not every city gains equally. Because smaller and medium cities offer few opportunities, the poor generally bypass them altogether and come directly to the mega cities in search of a livelihood. Fig. 9.5 sets out this whole process from the first push to its final human cost.
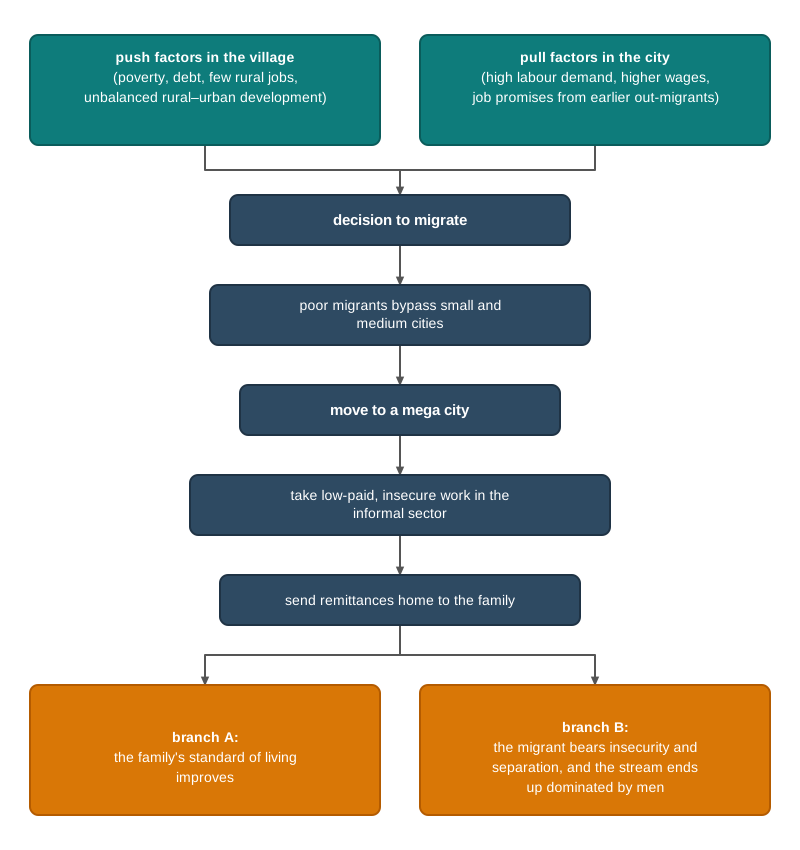
Fig. 9.5 – Rural–urban migration and its outcomes.
9.3.1 A Case Study
To understand the process from the inside, follow one migrant’s path. The case below is worth reading slowly, because it holds the whole process — push, pull, movement, remittance and separation — in a single life.
Ramesh’s story is one instance of a wider pattern, and NCERT draws out the general lesson. In developing countries, the poor, semi-literate and unskilled — people in exactly Ramesh’s position — who migrate from rural areas frequently end up in menial, low-wage jobs in the informal sector of the cities. Because those wages are too low to support a whole family at the destination, the spouse usually stays behind in the village to look after the children and the elderly. This is why the rural-urban migration stream is dominated by men. The single life shows both sides of the ledger at once: rural poverty pushed and urban wages pulled; the remittances genuinely lifted the family; yet the very insecurity that keeps the work temporary keeps the family apart.
9.4 Problems of Slums
In settlement geography, the idea of an ‘urban centre’ is defined precisely so as to separate it from the ‘rural’, which you have met in earlier chapters. You may also recall from ‘Fundamentals of Human Geography’ that what counts as urban is drawn differently in different countries.
The Urban–Rural Divide
Urban and rural settlements differ in their functions, and often they complement one another. But beyond function, the two have drifted into a wider divide — cultural, social, political, economic and technological.
India still has a predominance of rural population, approximately 69 per cent of the total population in 2011, and Mahatma Gandhi once called its villages the ideal republics. Yet most rural areas remain poor, working mainly at primary activities such as farming. Many villages now exist almost as an appendix to a core urban centre, forming its hinterland — the surrounding area that a town or city serves and draws its resources and labour from.
The Two Extremes Of The City
It would be wrong to picture urban centres as one uniform block set against the villages. In fact, cities in India are more sharply differentiated — by income, culture, politics and every other indicator of development — than any other kind of area. At the top are farm houses and high-income localities, marked by well-built infrastructure: wide roads, streetlights, water and sanitation, lawns, green belts, parks, playgrounds, and the security and privacy that money buys.
At the other extreme lie the slums — the jhuggi-jhopari clusters (clusters of makeshift shanty huts) and colonies of shanty structures. These are inhabited by people forced to migrate from rural areas in search of a livelihood, who then could not afford proper housing because rents and land prices were too high. Left with no other option, they occupy environmentally incompatible and degraded areas — the land nobody else wants.
Inside A Slum
A slum is a residential area of the least choice. Its houses are dilapidated, its conditions unhygienic, its rooms poorly ventilated, and its basic amenities — drinking water, light, toilets — missing. Open defecation, an unregulated drainage system and overcrowded, narrow street patterns turn daily life into a serious health and socio-environmental hazard.
The Swachh Bharat Mission, part of the Government of India’s urban renewal effort, aims to improve the quality of life in exactly these urban slums.
Most of the slum population works in the low-paid, high-risk, unorganised sectors of the city economy — the very labour that keeps a city running. Slum-dwellers are, in this sense, the backbone of the urban workforce. Yet the return to them is thin. They are undernourished, prone to disease and illness, and unable to afford proper schooling for their children. Deepening poverty leaves them vulnerable to drug abuse, alcoholism, crime, vandalism, escapism and apathy, and finally to social exclusion.
It is worth asking these questions for yourself. Have you ever visited a slum? Visiting one in your own city, and writing down the problems its residents face, would show you at first hand what these words only describe.
Dharavi’s Paradox
The sharpest picture of the slum condition comes from Dharavi, in central Mumbai, Asia’s largest slum. Buses only skirt its edge and autorickshaws are barred from it. A single main road runs through it — the so-called ‘ninety-foot road’, reduced to less than half that width along most of its length — while many side lanes are so narrow that not even a bicycle can pass. The buildings are temporary, two or three storeys high with rusty iron stairways, and a single rented room may hold a whole family of twelve or more people.
And yet, from this place of uncollected garbage and stagnant water come some of the most beautiful and valuable articles made in India. Dharavi turns out delicate ceramics and pottery, exquisite embroidery and zari work (embroidery in fine metallic thread), sophisticated leather goods, high-fashion garments, finely wrought metalwork, delicate jewellery settings, wood carvings and furniture — goods that reach the richest houses in India and abroad.
The place was once an arm of the sea, filled in over time by waste, and it is inhabited largely by Scheduled Castes and poor Muslims. Corrugated-metal buildings, up to 20 metres high in places, are used for the treatment of hides and tanning. Its poverty and its productivity are two faces of the same fact: the revulsion it inspires in the rich is in direct proportion to the role it plays in creating the city’s wealth. The newspaper headline puts it plainly — slum-dwellers are the backbone of the labour force.
9.5 Land Degradation
The pressure on agricultural land grows for two reasons at once: there is only so much of it, and the quality of what exists keeps deteriorating. Four processes do most of the damage — soil erosion (the stripping of fertile topsoil by water and wind), waterlogging (soil so saturated that roots cannot breathe), salinisation (a build-up of salts that poisons crops) and alkalinisation (soil turning harmfully alkaline).
What Degrades Land
Ask what happens when land is cropped year after year without ever managing its fertility. The answer is simple and hard: the land is degraded and its productivity falls. Land degradation is generally understood as a decline — temporary or permanent — in the productive capacity of the land. Not every degraded patch is a wasteland, but degradation left unchecked can turn into one.
Sorting The Wastelands
Two kinds of process induce land degradation: natural, and those created by human beings. Using remote sensing — surveying the land from satellites — the National Remote Sensing Centre (NRSC) has classified wastelands, and it is possible to sort them by the process that created each. Fig. 9.6 sets out that classification as a branching tree.
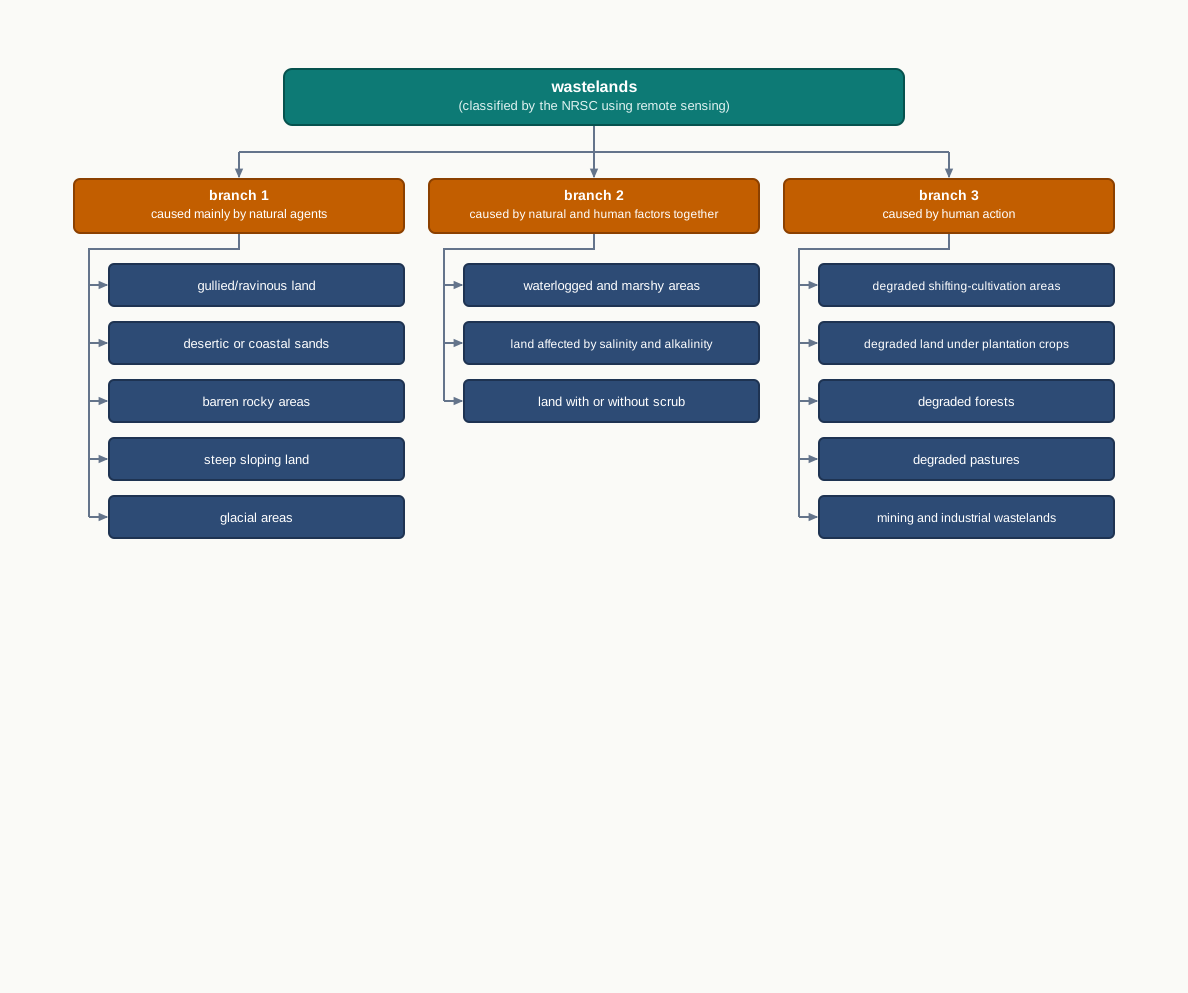
Fig. 9.6 – Wastelands classified by their cause.
Reading down that classification carries one clear message: the wastelands created by human action are more significant than those produced by natural processes. Degradation, in other words, is largely something we do — which also means it is largely something we can undo.
9.5.1 A Case Study
The clearest proof that degraded land can recover comes from one of the country’s poorest districts.
Jhabua teaches that land degradation is not a one-way road. The recovery worked because it treated land, water and vegetation as one system and because the community, not an outside agency, owned the effort — one tree per household, fenced and rested pastures, stall feeding in place of open grazing. Even the conflict over the common land was resolved by inclusion rather than exclusion, which is why the settlement held. The caution is real too: this is one of the five most backward districts, and even here only a fifth of the area was treated in five years. Restoration is possible, but it is slow, partial and demanding of cooperation.
Reviving The Commons
The encroachment is worth dwelling on, because it shows how the sharing of a common resource is managed in practice. When a villager from a neighbouring village encroached on the common land, the villagers first called the tehsildar — the local revenue officer for the sub-district — to establish the rights over the land. They then resolved the dispute themselves, by offering to make the encroacher a member of their user group and to share with him the benefits of greening the common pastures. (The idea of common property resources is developed further in the chapter ‘Land Resources and Agriculture’.)
Fig. 9.7 and Fig. 9.8 show this work on the ground — the trees the community planted and the collective labour of levelling their common land.
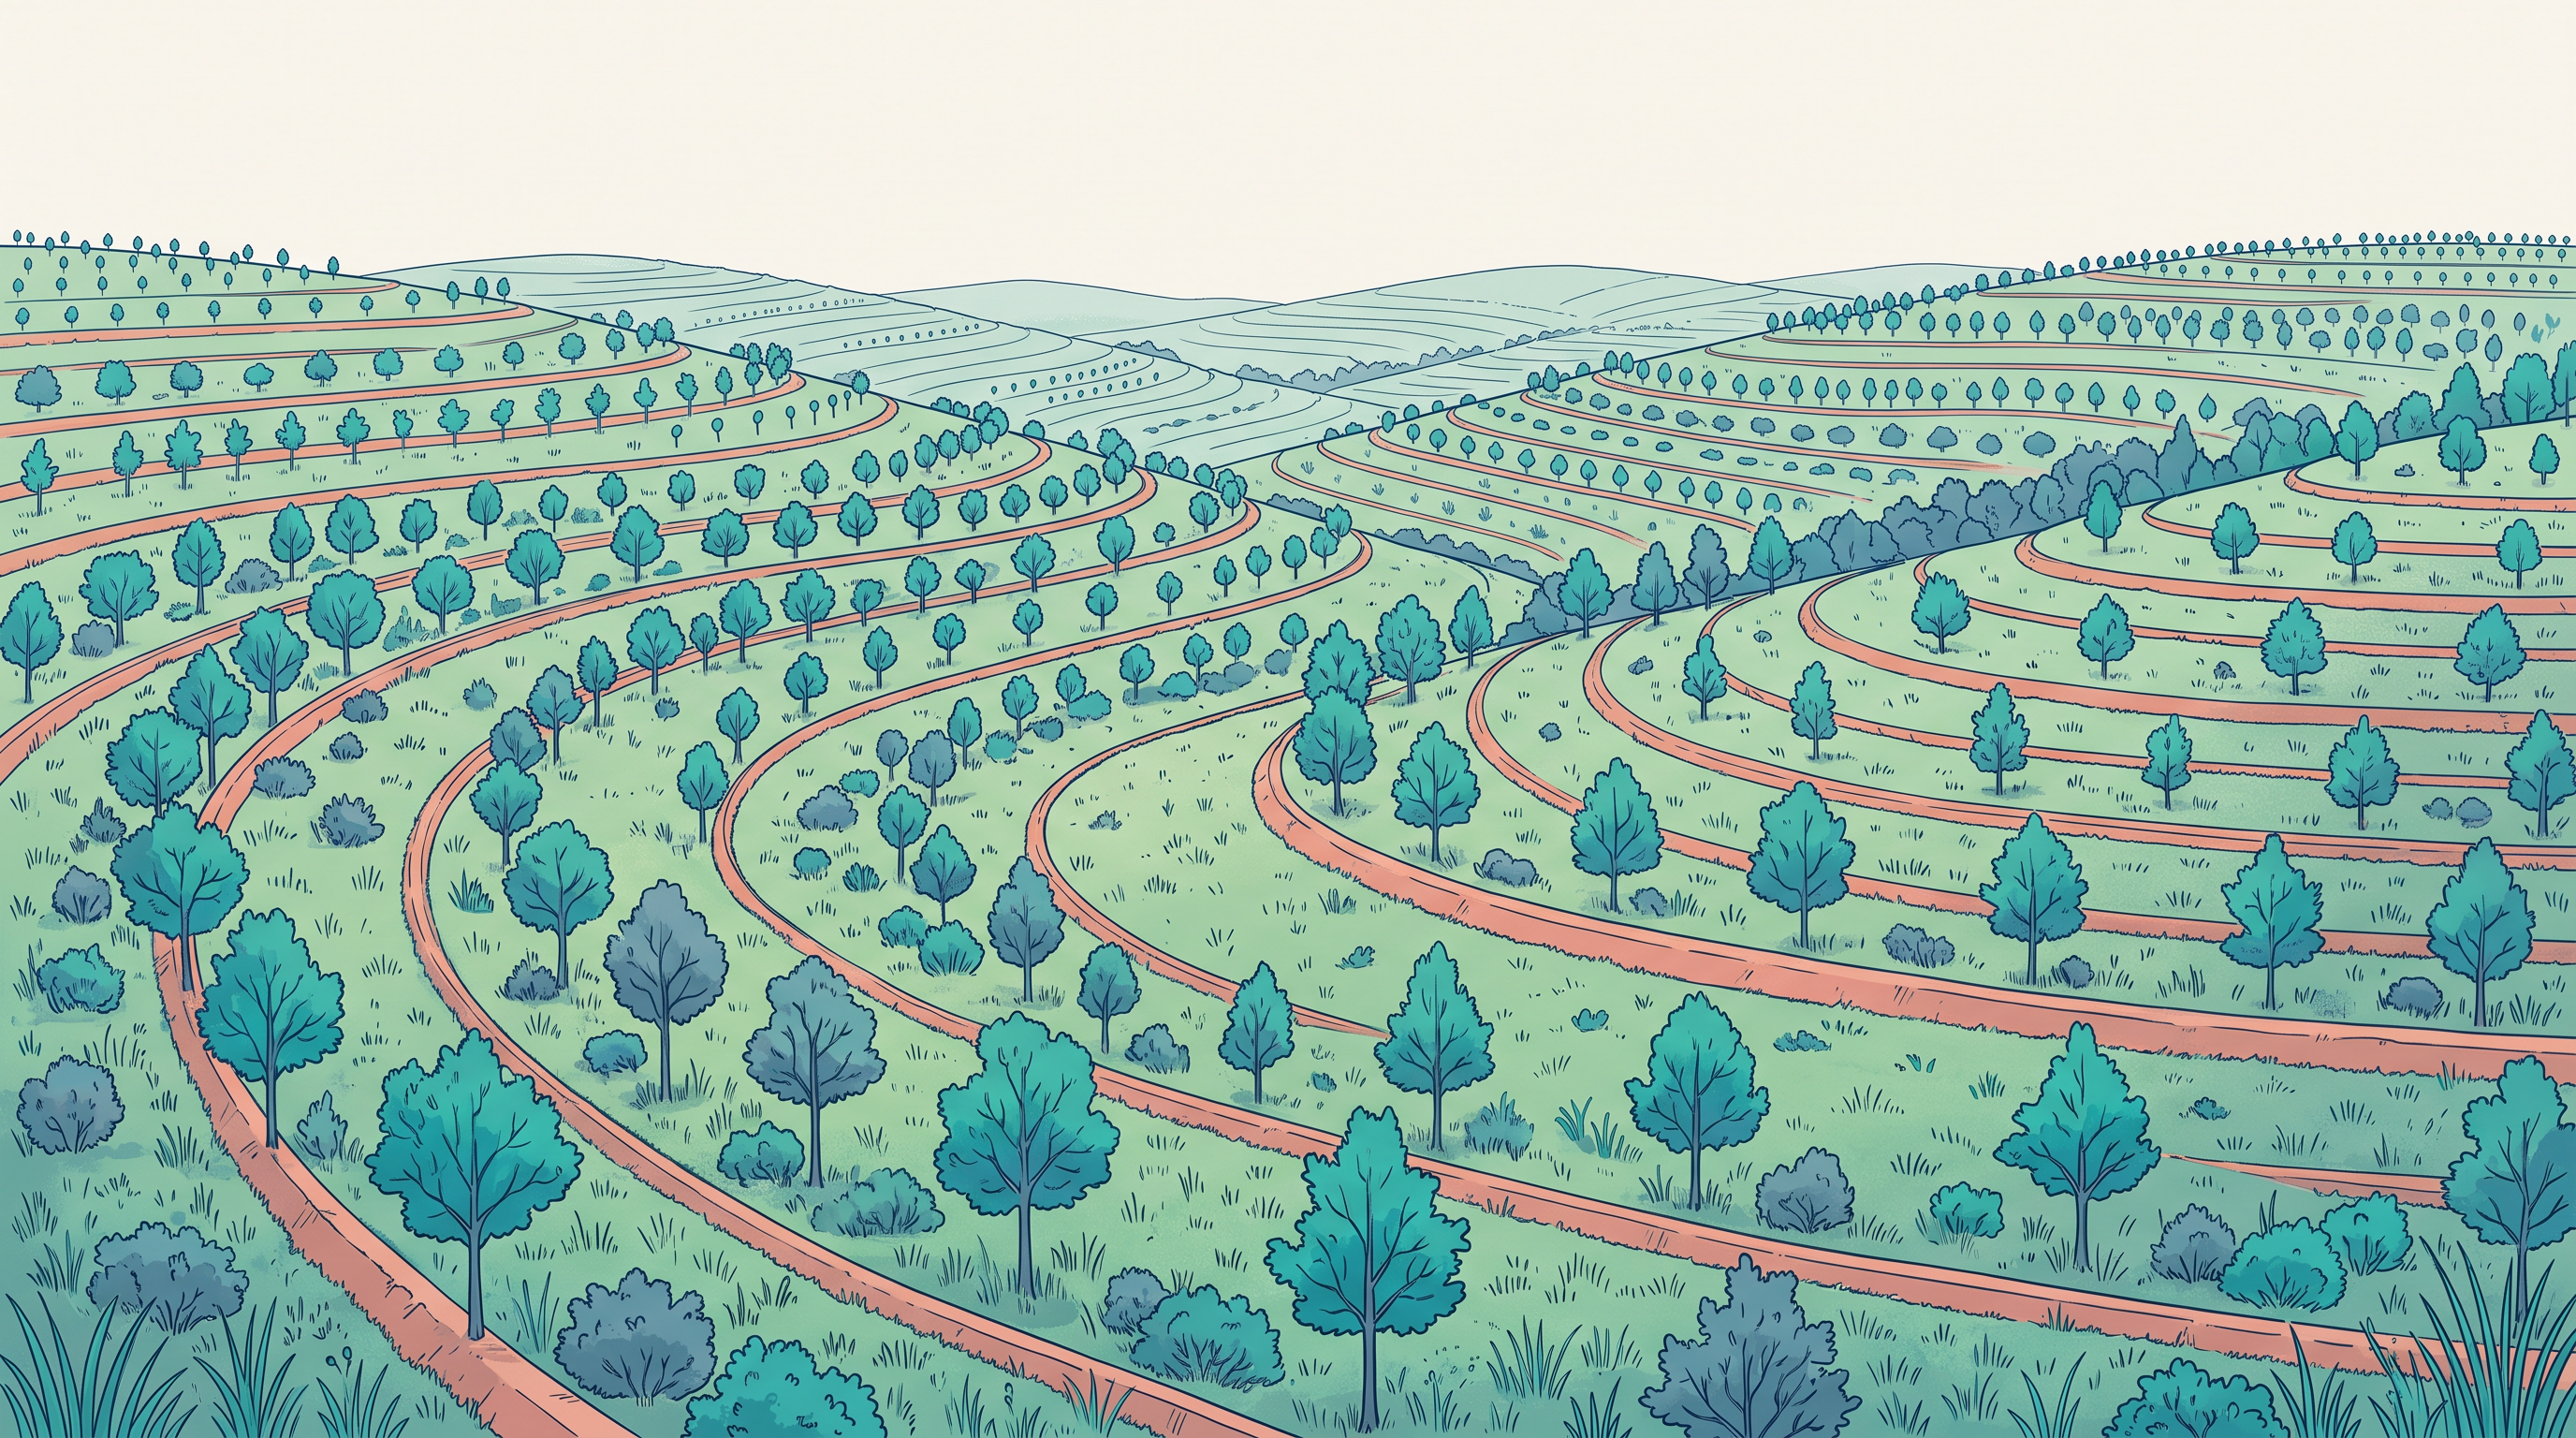
Fig. 9.7 – Trees planted on common property resources.
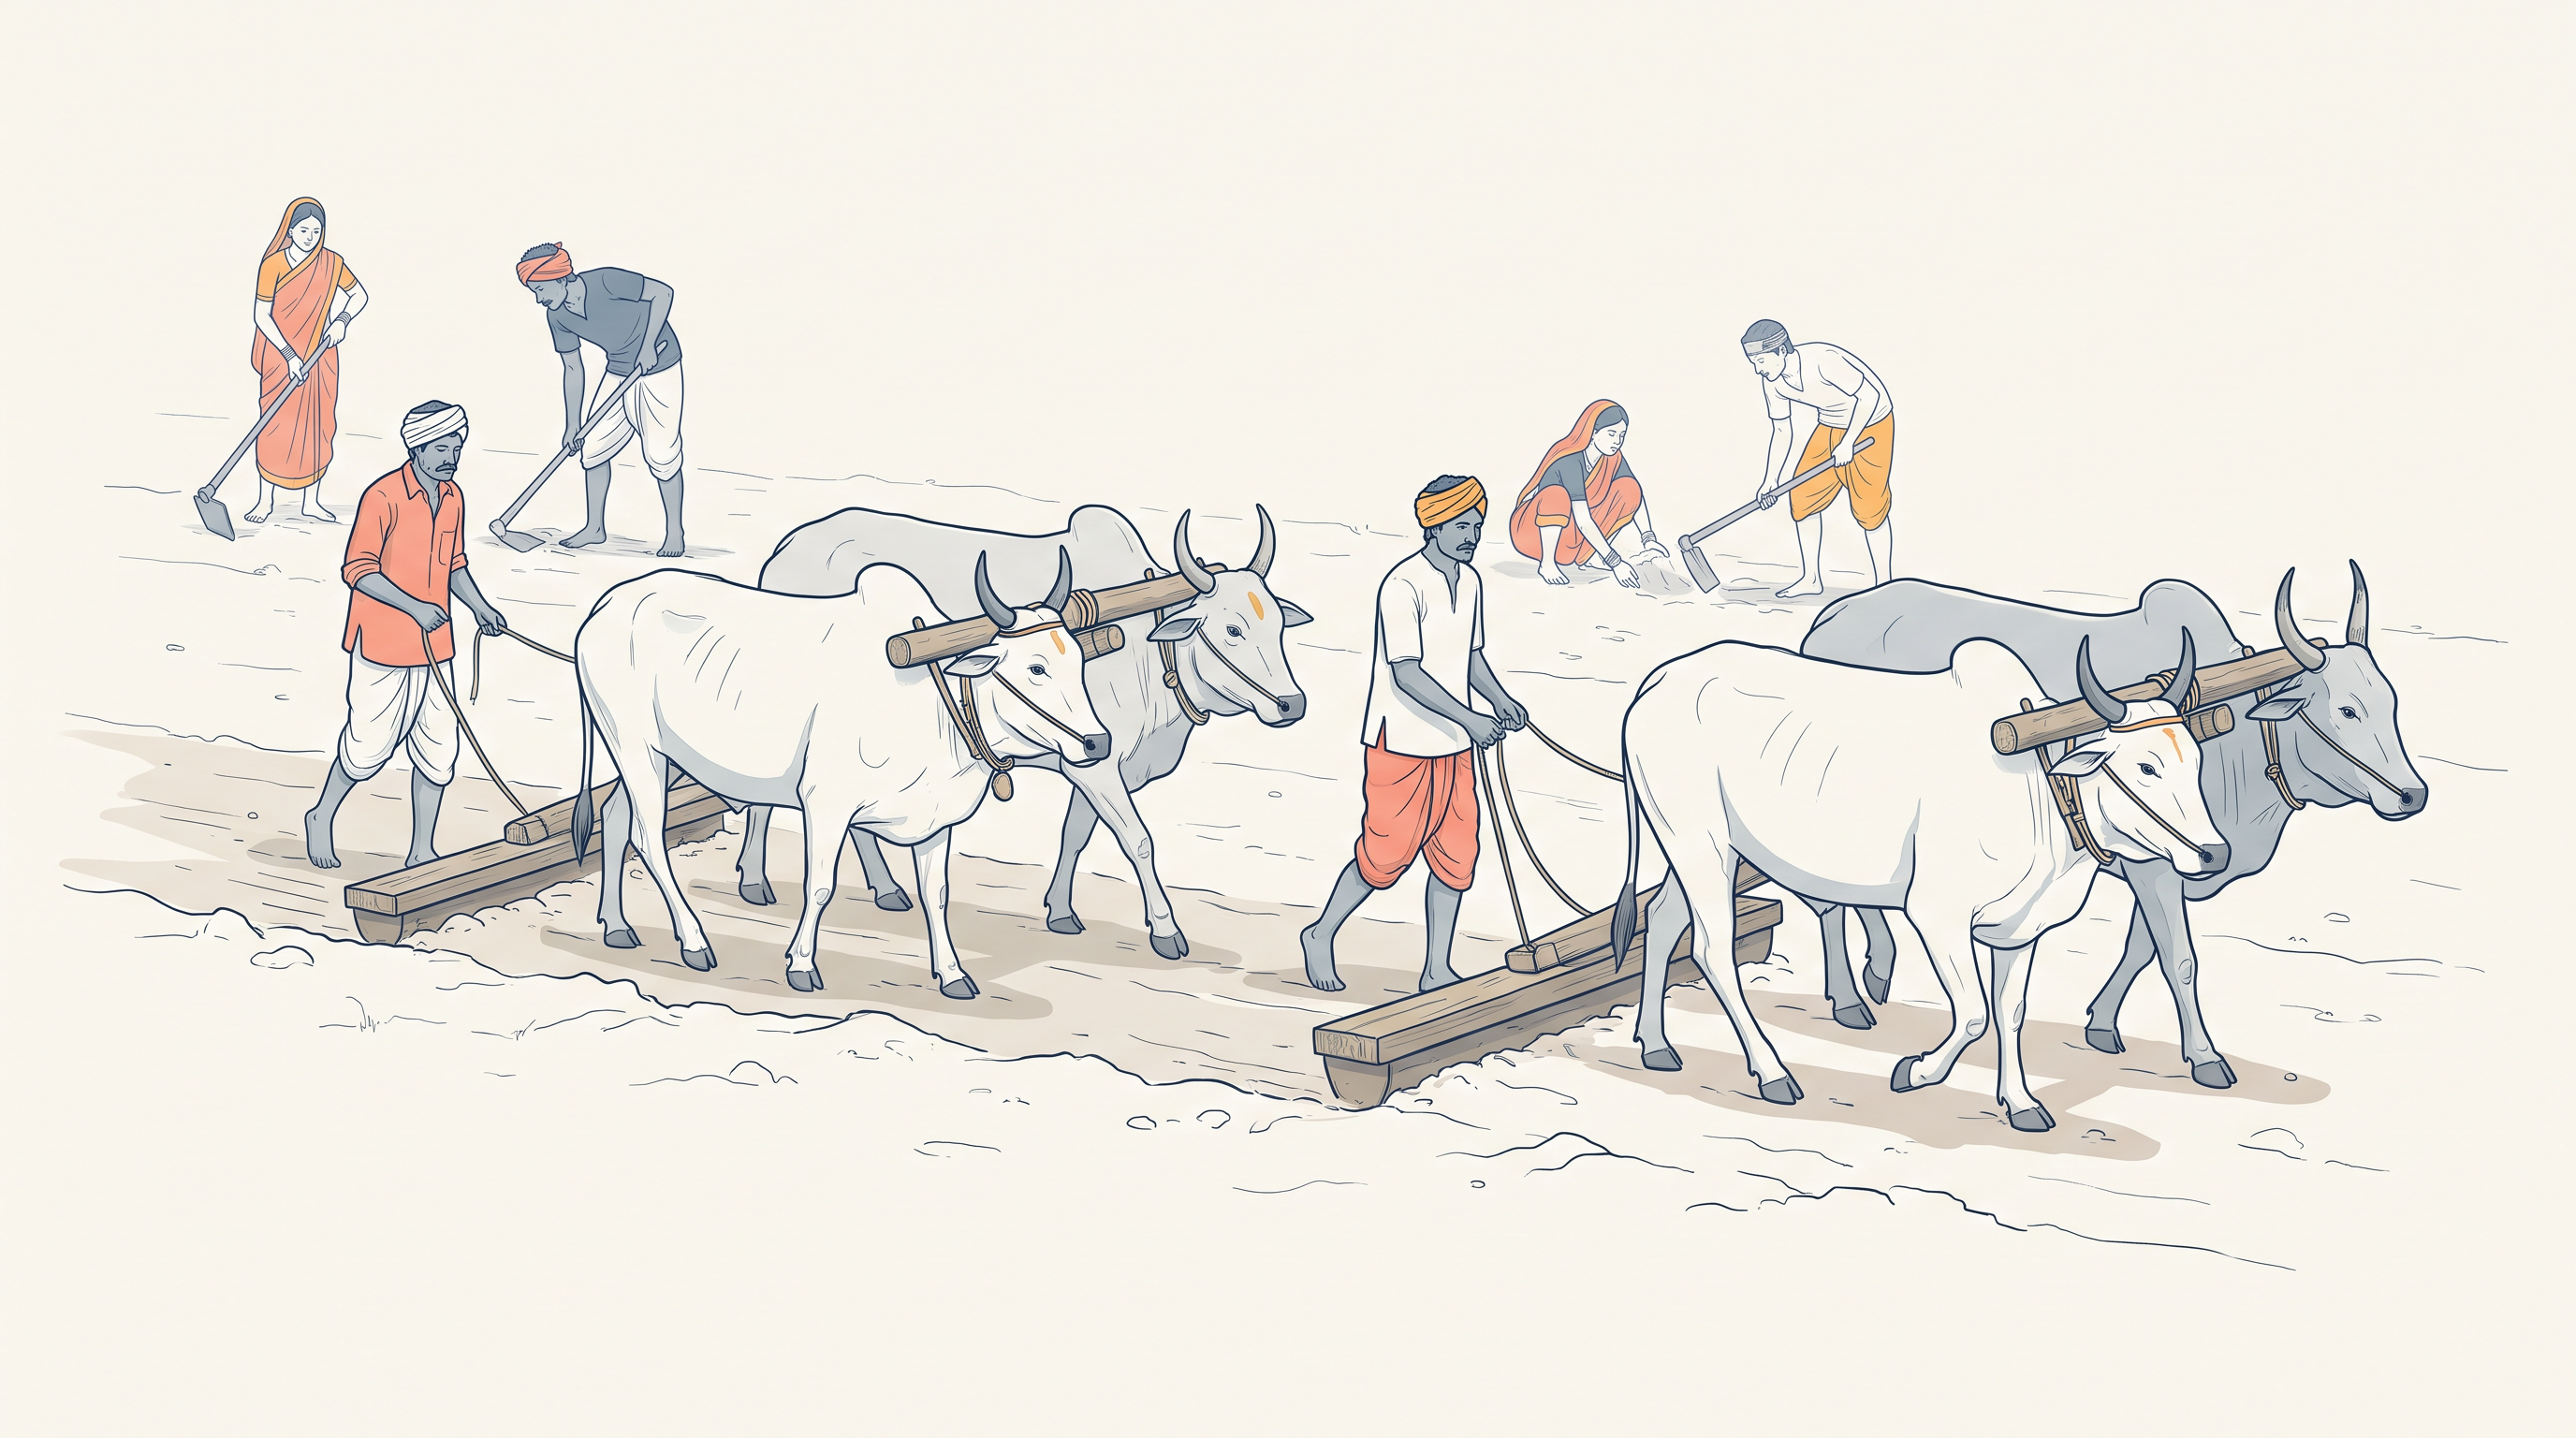
Fig. 9.8 – Community participation in land levelling.
9.6 Summary
- Environmental pollution is the release of substances and energy from the waste of human activities; it is classified by the medium carrying the pollutant into air, water, land and noise pollution.
- Water becomes polluted when the load of substances rises past a water body’s self-purifying capacity; industry is the largest contributor, with agriculture and cultural activities adding more.
- Polluted water spreads water-borne disease — about one-fourth of India’s communicable diseases are water-borne — and the pollution of the Ganga led to the National Mission for Clean Ganga and the Namami Gange Programme.
- Air pollution comes mainly from burning fossil fuels, mining and industry, which release oxides of sulphur and nitrogen and other gases; it harms the respiratory, nervous and circulatory systems and produces smog and acid rain.
- Noise pollution, measured in decibels, comes chiefly from traffic, industry and construction; it is location-specific and its intensity falls with distance from the source.
- Urban solid waste has grown enormously; household and industrial wastes are handled differently, and uncollected waste breeds disease and pollutes water when dumped into rivers.
- Metropolitan cities collect about 90 per cent of their solid waste, but 30 to 50 per cent is left uncollected in most other towns; waste is better treated as a resource for energy and compost than left to release methane.
- Rural-urban migration is driven by push factors such as rural poverty and few jobs and by pull factors such as urban labour demand; the poor often bypass small cities for the mega cities.
- Migrants commonly take low-paid, insecure work in the informal sector and send remittances home; the stream is dominated by men, and families bear the cost of separation.
- Indian cities are sharply differentiated, and at the bottom lie the slums, occupied by migrants priced out of proper housing and pushed onto degraded land.
- Slum-dwellers are the backbone of the urban labour force yet face poverty, disease and social exclusion; missions such as Swachh Bharat aim to improve their conditions.
- Land degradation is a temporary or permanent decline in the productive capacity of land, caused by soil erosion, waterlogging, salinisation and alkalinisation.
- The National Remote Sensing Centre classifies wastelands by cause; human-made wastelands now outweigh natural ones, but watershed management and community participation can slow and even reverse degradation.
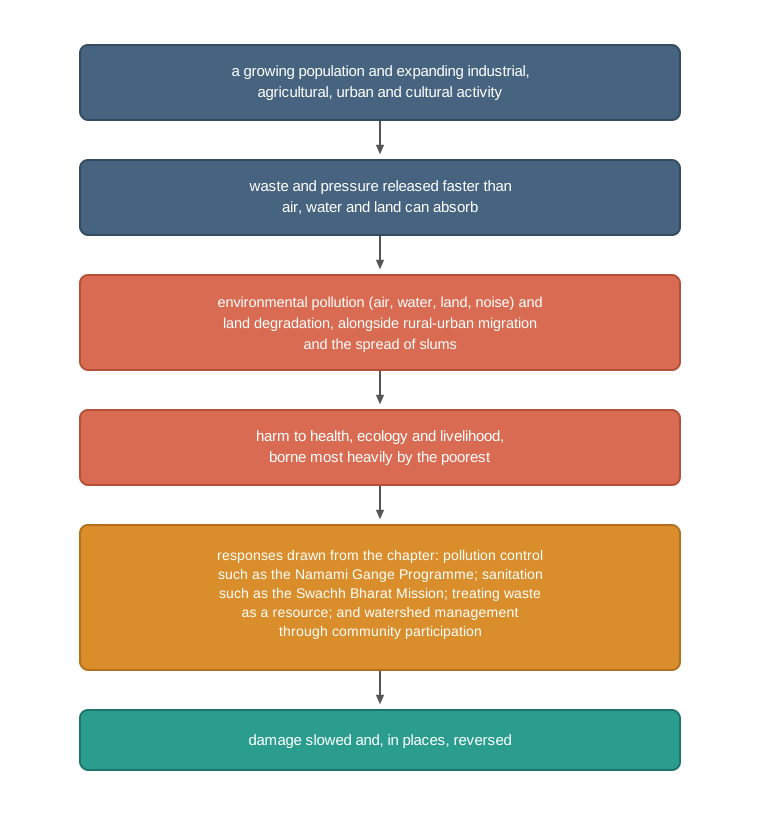
Fig. 9.9 – Environmental pressures, impacts, and responses.
What This Chapter Cannot Tell You
The chapter names polluted stretches, polluters and cities, but gives almost no measured amounts, so it cannot say how bad any one place is, or whether it is getting better or worse. Its case studies — one village, one migrant, one district — show what is possible, not what is typical, and a single success does not prove the same will work everywhere. And figures like ‘90 per cent of waste collected’ or ‘69 per cent rural’ are metro or national averages that hide wide differences between one city, district or household and the next.
9.7 NCERT Questions
- Which one of the following rivers is highly polluted?
- Brahmaputra
- Satluj
- Yamuna
- Godavari
- Which one of the following diseases is caused by water pollution?
- Conjunctivitis
- Diarrhoea
- Respiratory infections
- Bronchitis
- Which one of the following is the cause of acid rain?
- Water pollution
- Land pollution
- Noise pollution
- Air pollution
- Push and pull factors are responsible for—
- Migration
- Land degradation
- Slums
- Air pollution
- What is the difference between pollution and pollutants? (30 words)
- Describe the major source of air pollution. (30 words)
- Mention major problems associated with urban waste disposal in India. (30 words)
- What are the effects of air pollution on human health? (30 words)
- Describe the nature of water pollution in India. (150 words)
- Describe the problem of slums in India. (150 words)
- Suggest measures for reduction of land degradation. (150 words)
9.8 Check Your Concepts
- The exercise above does not touch noise pollution. Name two of its main sources given in the chapter, and explain why noise pollution is described as location-specific.
- Using Table 9.1, identify which type of pollution each of these belongs to: (a) oxides of sulphur and nitrogen; (b) a high level of noise above the tolerance level.
- Read Table 9.2. For the Ganga, list the three types of pollution named in the table, and identify the barrage marked as one of its polluted stretches.
- The chapter says push and pull factors together cause rural-urban migration. Sort the factors it names into push factors, acting in the village, and pull factors, acting in the city.
- Explain why slum-dwellers end up occupying environmentally incompatible and degraded areas rather than better land in the city.
- Reconstruct, in order, the steps by which land that is cropped continuously without managing its fertility becomes wasteland, naming the four degradation processes involved.
- The NRSC classifies wastelands by their cause. Give one example of a wasteland caused mainly by natural agents and one caused by human action, and state what the chapter concludes about which kind now matters more.
- Table 9.2 names the main polluters of the Ganga and the Yamuna but gives no measured pollution levels. State one thing the table therefore cannot tell you about these rivers.