Chapter 8: Solar Radiation, Heat Balance And Temperature
Sunlight has fallen on the Earth for more than four billion years. Enough energy arrives each day to power everything that lives, drive every wind, and lift every drop of water into the sky. Yet the planet has not slowly cooked itself. Its long-term temperature has held remarkably steady. How?
Follow a single patch of ground through one day. At dawn the Sun climbs and its short-wave rays strike the surface. The ground warms, and the air touching it warms too — first by direct contact, then by rising currents that carry the heat upward. By afternoon the surface is hot. Then the Sun sets. Now the ground does the radiating, sending its heat back towards the sky as invisible long waves. It loses more than it gains, and by dawn it is colder than the air above it.
Over a whole year the gains and losses cancel out. Widen the view and the same balance holds for the whole planet: the tropics take in a surplus of energy and the poles run a deficit, yet the tropics do not keep heating and the poles do not freeze ever deeper. Winds and ocean currents carry the surplus poleward. The Earth is not a store of heat. It is a place where heat is constantly received, moved, and returned.
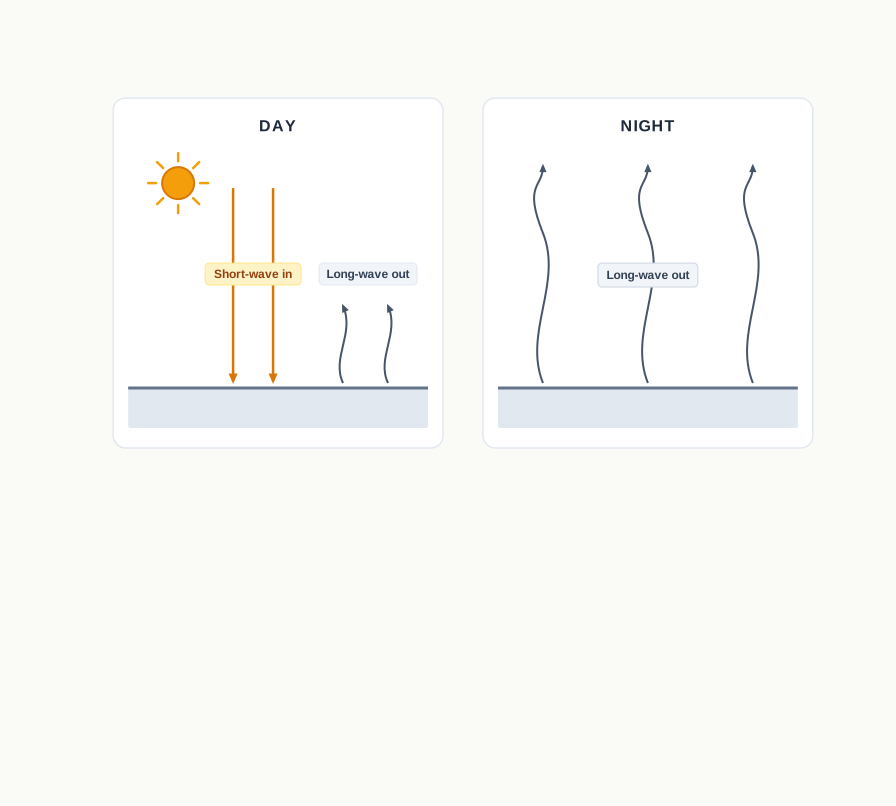
Fig. 8.0 – Day and night surface radiation.
By the end of this chapter you will be able to answer each of these.
8.1 Solar Radiation
The Earth runs almost entirely on energy borrowed from the Sun. That energy arrives as radiation, and most of it comes in short wavelengths. The energy the Earth receives from the Sun is called incoming solar radiation, or insolation for short.
The Earth is a geoid — a body shaped very nearly like a sphere, slightly flattened at the poles. Because its surface curves away in every direction, the Sun’s rays reach the top of the atmosphere obliquely almost everywhere, and the planet catches only a tiny fraction of the Sun’s total output. On average the Earth receives 1.94 calories per square centimetre per minute at the top of its atmosphere. A calorie is a small unit of heat, and a square centimetre is about the size of a fingernail, so this is the steady trickle of solar heat landing on each such patch every minute before the atmosphere has touched it.
The Distance to the Sun
That figure is not perfectly constant through the year, because the Earth’s distance from the Sun changes as it travels its orbit. The Earth is farthest from the Sun, 152 million km away, on 4th July; this position is called aphelion. It is nearest to the Sun, 147 million km away, on 3rd January; this position is called perihelion.
Being closer in January means the Earth actually receives slightly more insolation on 3rd January than it does on 4th July. Yet you do not feel January as the Sun’s strongest month, because this small distance effect is masked by far larger ones — the uneven spread of land and sea, and the circulation of the atmosphere. So the yearly change in solar output has little effect on day-to-day weather.
8.1.1 Variability of Insolation at the Surface of the Earth
The amount and intensity of insolation change through a single day, from season to season, and across the year. Five factors drive these changes: the rotation of the Earth on its axis; the angle at which the Sun’s rays strike; the length of the day; the transparency of the atmosphere; and the configuration of the land — its aspect, meaning the direction a slope faces. The last two matter least.
The Tilt of the Axis
The Earth spins on an axis that is not upright. That axis makes an angle of 66½° with the plane of its orbit around the Sun. This single fact has a strong influence on how much insolation different latitudes receive, because it changes the height of the noon Sun through the year — and it is why the planet has seasons at all.
Vertical Rays and Slant Rays
The second factor, the angle at which rays strike, depends on the latitude of a place. Latitude is the distance north or south of the Equator, measured in degrees. The higher the latitude, the lower the angle the rays make with the ground, so they arrive as slant rays rather than as near-vertical ones.
That angle matters for two reasons, and both reduce the heat that reaches the ground. First, a slanting beam is smeared over a larger area than a vertical beam of the same width, so the energy in it is shared out more thinly and each patch of ground gets less. Second, slant rays travel a longer path through the atmosphere, which absorbs, scatters and diffuses more of them on the way down. Fig. 8.1 shows why a slant beam delivers less to each square of ground.
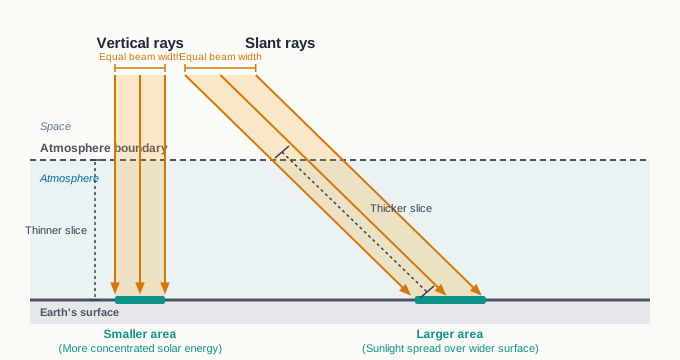
Fig. 8.1 – Vertical and slant rays.
Fig. 8.2 puts this geometry to work for one moment in the year — the June solstice — showing how the tilted axis sets the Sun directly over the Tropic of Cancer while the rays reach other latitudes at their own angles.
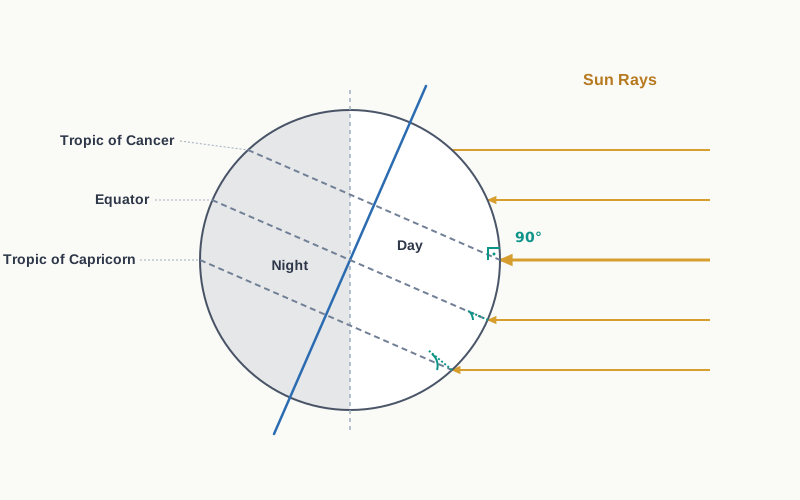
Fig. 8.2 – Summer solstice.
8.1.2 The Passage of Solar Radiation through the Atmosphere
The atmosphere is largely transparent to short-wave solar radiation, so most incoming sunlight passes straight through it and strikes the surface. It is not a clean pass, though. Within the troposphere — the lowest layer of the atmosphere, where weather happens — water vapour, ozone and other gases absorb much of the near-infrared part of the radiation before it lands.
Scattering and Sky Colour
Very small particles suspended in the troposphere scatter the visible part of sunlight, throwing it in all directions — some back to space, some down towards the surface. This scattering is what paints the sky. The red of a rising or setting Sun and the blue of the daytime sky are both the result of light being scattered as it travels through the air.
8.1.3 Spatial Distribution of Insolation at the Earth’s Surface
By the time insolation reaches the ground, its strength varies sharply from place to place. It falls from about 320 watts per square metre in the tropics to about 70 watts per square metre at the poles. A watt per square metre measures solar power — energy each second — landing on one square metre of surface, so the tropics receive more than four times the power per square metre that the poles do.
The pattern holds a surprise. The greatest insolation is not received at the Equator but over the subtropical deserts, where cloud cover is at its thinnest. The Equator, for all its strong overhead Sun, actually receives comparatively less at the surface than the tropics on either side of it. Two smaller rules complete the picture: at the same latitude, insolation is generally higher over a continent than over an ocean; and in winter, the middle and higher latitudes receive less radiation than they do in summer.
8.2 Heating and Cooling of Atmosphere
The atmosphere is heated and cooled in several different ways, and it is worth naming each, because they act on different parts of the air and over different distances.
Once the Sun has heated the ground, the ground passes that heat to the air directly touching it. The air in contact with warm land heats slowly, and the layers just above heat in turn as they touch the layers below. This passing of heat between things in direct contact is conduction. Conduction always runs from the warmer body to the cooler one, and it continues until the two reach the same temperature or the contact is broken. It matters most for warming the lowest layers of the atmosphere.
Heated air does not stay put. It rises in vertical currents, carrying its heat upward, and this vertical transport of heat is convection. Convection is confined to the troposphere, the lowest layer of the atmosphere, and does not reach above it.
Heat is also carried sideways. The transfer of heat by the horizontal movement of air is advection, and over most of the Earth it moves more heat than the vertical currents do. In the middle latitudes, most of the day-to-day (diurnal) change in weather is the work of advection alone. In tropical regions, and especially over northern India in summer, advection shows up as the ‘loo’ — a hot, dry wind that sweeps across the plains by day.
8.2.1 Terrestrial Radiation
The insolation that reaches the Earth arrives in short waves and heats the surface. Once warmed, the surface itself becomes a source of radiation. It sends energy back out, but in long waves rather than short, and this outgoing long-wave energy from the Earth is terrestrial radiation. It is what heats the atmosphere from below.
The long-wave radiation is absorbed by gases in the air, in particular carbon dioxide and the other greenhouse gases. This is the key point about how the air is warmed: the atmosphere is heated only indirectly by the Sun. The Sun heats the ground, and the ground heats the air.
The atmosphere, once warmed, radiates and passes heat onward to space in its turn. In the end, the heat the Earth took from the Sun is returned to space, which is what keeps the temperature at the surface and in the air steady over time. Fig. 8.3 traces this whole pathway, from the short-wave energy arriving to the long-wave energy leaving.

Fig. 8.3 – Pathway of solar and terrestrial radiation.
8.2.2 Heat Budget of the Planet Earth
Fig. 8.4 depicts the heat budget of the planet Earth. The Earth as a whole neither piles up heat nor loses it; it holds its temperature. That can only happen if the heat it receives as insolation equals the heat it loses as terrestrial radiation. To see how the two balance, treat the insolation arriving at the top of the atmosphere as 100 units.
As those 100 units pass down through the atmosphere, some are reflected, some scattered and some absorbed, and only the rest reach the surface. The share that is thrown straight back to space, before it can warm anything, is the albedo of the earth. Fig. 8.4 lays out the full accounting in two panels — the short-wave energy coming in, and the long-wave energy going back out.
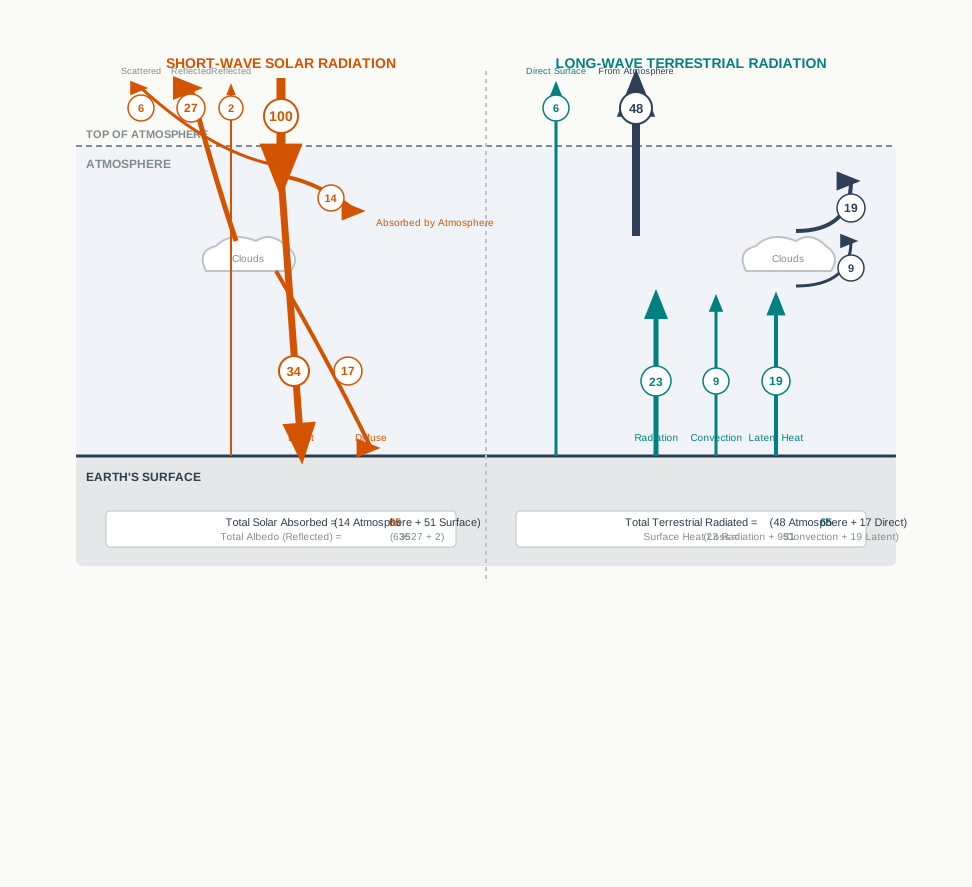
Fig. 8.4 – Heat budget of the earth.
The two totals are the whole point. Of the 100 units that arrive, 35 bounce straight back and 65 are absorbed - and that same 65 is eventually radiated back out, as 17 plus 48. Incoming equals outgoing, so nothing accumulates. This is what the chapter calls the heat budget, or heat balance, and it is the reason the Earth neither warms up nor cools down despite the enormous flow of heat passing through it every moment.
8.2.3 Variation in the Net Heat Budget at the Earth’s Surface
The budget balances for the planet as a whole, but not for every latitude. Some parts of the Earth run a surplus in their radiation balance, taking in more than they give back, while others run a deficit.
Fig. 8.5 shows how this net radiation balance varies with latitude across the Earth-atmosphere system. It reveals a surplus between about 40 degrees north and 40 degrees south, and a deficit in the regions near the poles. Read the two curves together: where the solar radiation line sits above the terrestrial radiation line, the belt is in surplus; where it falls below, the belt is in deficit.
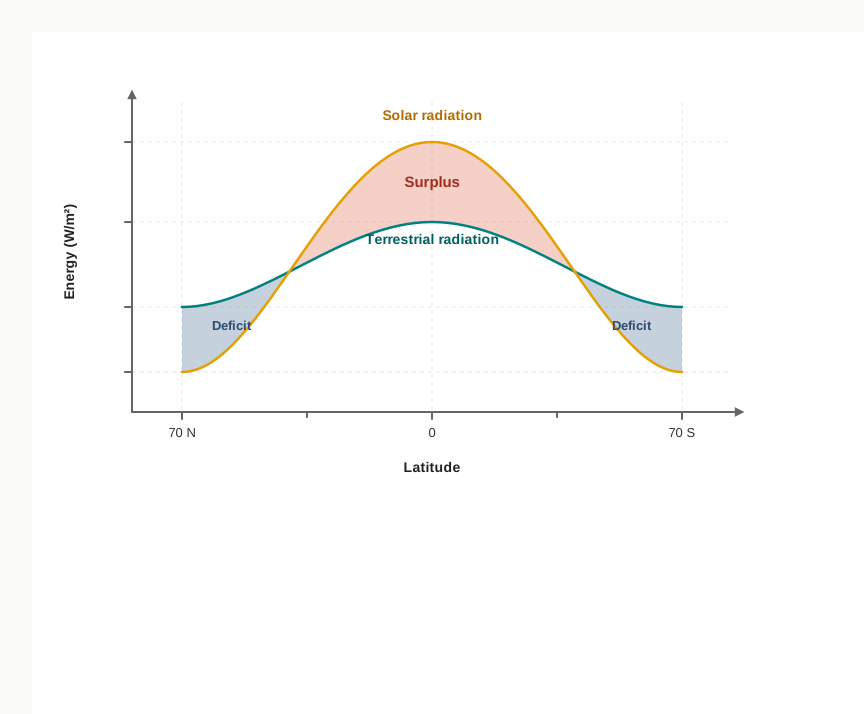
Fig. 8.5 – Latitudinal variation in net radiation balance.
If nothing carried heat across these belts, the tropics would grow hotter year on year and the poles would sink into permanent, deepening ice. That does not happen because the surplus heat of the tropics is redistributed towards the poles. The transfer keeps the tropics from overheating and the high latitudes from freezing solid.
8.3 Temperature
When insolation interacts with the atmosphere and the Earth’s surface, it creates heat, and that heat is measured as temperature. The two words are not the same thing. Heat is the movement of the tiny particles that make up a substance — the faster they move, the more heat there is. Temperature is the measurement, in degrees, of how hot or cold a thing, or a place, actually is.
8.3.1 Factors Controlling Temperature Distribution
The temperature of the air at any place is set by several things acting together: the latitude of the place; its altitude; its distance from the sea, together with the way air masses circulate; the presence of warm or cold ocean currents; and local aspects. Take them one at a time.
The Latitude
Temperature follows insolation, and insolation, as section 8.1 showed, depends on latitude. The Sun’s rays strike high latitudes at a low angle and are spread thin, so those places receive less energy and stay cooler. Temperature therefore varies with latitude in step with the insolation.
The Altitude
The atmosphere is heated from below, by terrestrial radiation rising from the ground, not from the Sun above. So the air is warmest where it is closest to that warm surface. A place near sea level records a higher temperature than a place high up a mountain at the same latitude. In short, temperature generally falls as height increases.
The rate at which it falls is the normal lapse rate, and it is 6.5°C for every 1000 m of height. You can turn this into a simple rule for the drop between any two heights:
\[\text{Fall in temperature} = \frac{\text{height climbed (in m)}}{1000\ \text{m}} \times 6.5\ ^\circ\text{C}\]
So climb 1000 m and the air is about 6.5°C cooler; climb 2000 m and it is about 13°C cooler. This is why a hill station stays cool while the plain below it bakes.
Distance From The Sea
Location with respect to the sea matters because land and water behave very differently. The sea heats up slowly and loses its heat slowly; land heats up and cools down quickly. As a result, temperatures over the sea swing far less than temperatures over land. Places near the coast come under the moderating influence of sea and land breezes, which smooth out both the day’s heat and the night’s chill.
Air Masses And Ocean Currents
Moving air and moving water carry their temperatures with them. When a warm air mass passes over a place, that place grows warmer; when a cold air mass arrives, it grows colder. Ocean currents work the same way along a coast: a shore washed by a warm current is warmer than a shore of the same latitude washed by a cold current.
8.3.2 Distribution of Temperature
The best way to see how temperature is spread over the globe is to compare two months at opposite ends of the year — January and July. On a map, this distribution is drawn with isotherms, which are lines joining places that have the same temperature. Figures 8.6 (a) and (b) map the surface air temperature for the two months.
The strongest single control is latitude, and it shows: for the most part the isotherms run parallel to the lines of latitude. Where they bend away from that pattern, some other influence — land, sea or a current — is at work.
Temperature in January
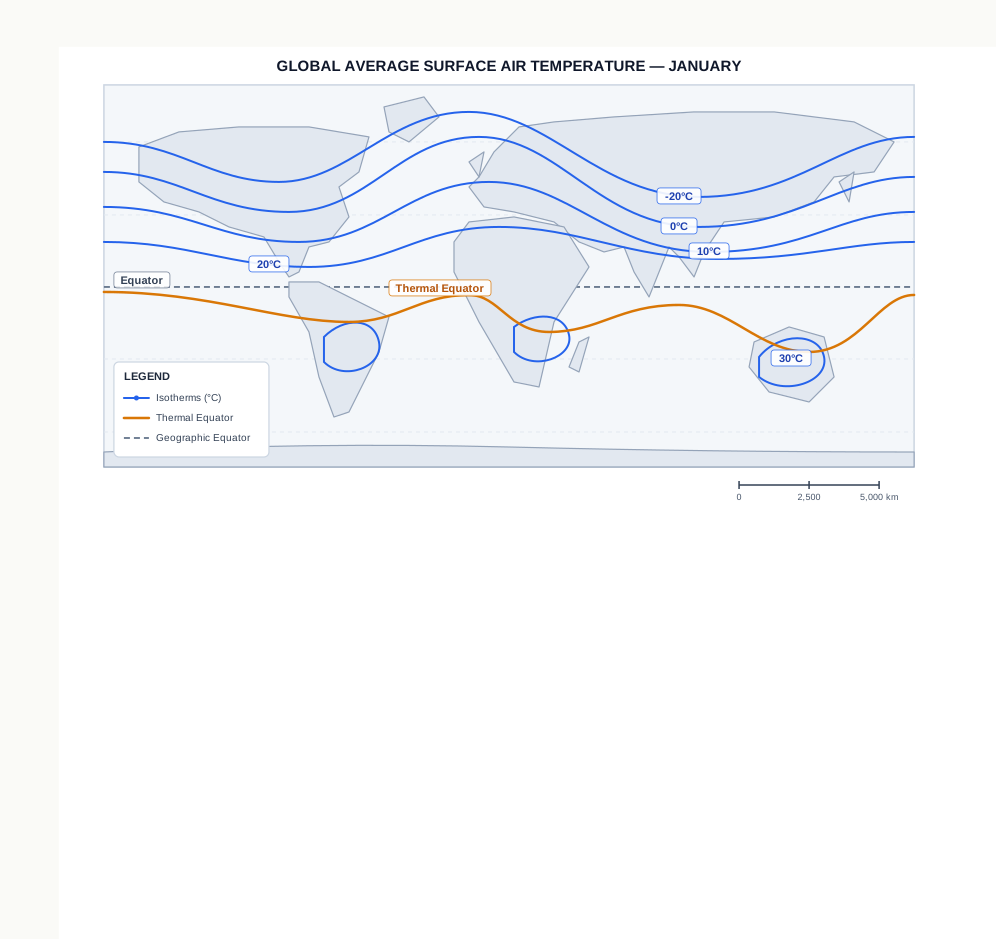
Fig. 8.6 (a) – Surface air temperature in January.
The departures from the latitude pattern are sharper in January than in July, and sharper in the northern hemisphere, where there is far more land than in the south. Over the North Atlantic the warm Gulf Stream and North Atlantic drift keep the ocean mild, so the isotherms bend north; over the land nearby, in Europe, temperatures fall steeply and the isotherms bend south. The contrast is at its most extreme over the Siberian plain, deep in northern Asia, where the mean January temperature along the 60°E meridian is minus 20°C at both 80°N and 50°N — two very different latitudes sharing one temperature, which shows how powerfully the inland cold overrides latitude. Across the hemisphere, the mean January figures run above 27°C over the equatorial oceans, above 24°C in the tropics, between 2°C and 0°C in the middle latitudes, and from minus 18°C to minus 48°C in the Eurasian continental interior.
The southern hemisphere, dominated by ocean, tells a calmer story. There the isotherms lie more or less parallel to latitude and the change from belt to belt is gradual: the 20°C, 10°C and 0°C isotherms run parallel to 35°S, 45°S and 60°S respectively.
Temperature in July
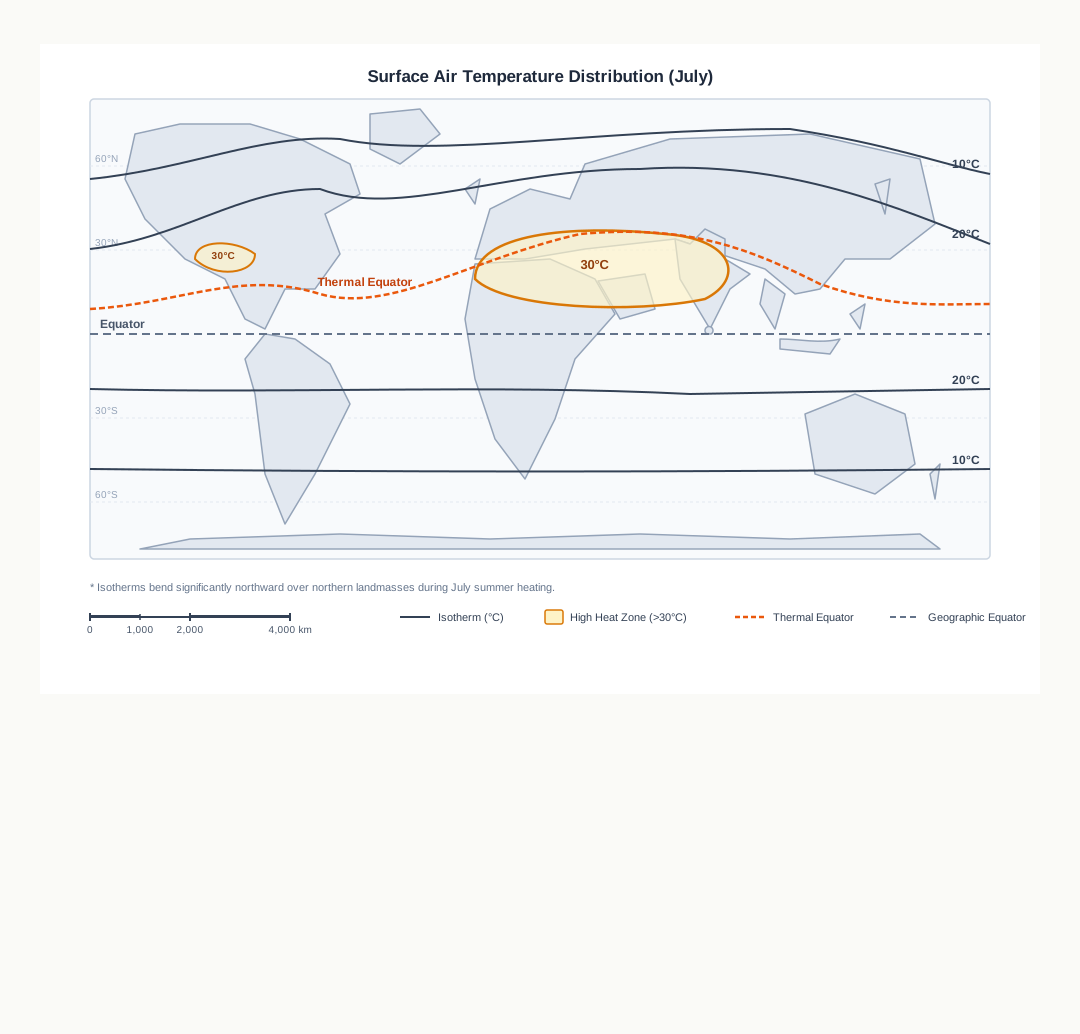
Fig. 8.6 (b) – Surface air temperature in July.
In July the isotherms generally run parallel to latitude. The equatorial oceans are warmer than 27°C. Over land, temperatures above 30°C appear in the subtropical continental region of Asia, along 30°N. The 10°C isotherm runs along 40°N, and along 40°S the temperature is likewise 10°C.
The Range Between January and July

Fig. 8.7 – Annual temperature range.
Fig. 8.7 maps the range between the two months — how far a place swings from its coldest to its warmest. The largest range, more than 60°C, is found over the north-eastern part of the Eurasian continent. This is the mark of continentality: the tendency of places far from the sea, with no ocean to moderate them, to roast in summer and freeze in winter. The smallest range, just 3°C, lies in the belt between 20°S and 15°N, where the sea is close and the Sun’s strength barely changes through the year.
8.4 Inversion of Temperature
Normally, as section 8.3 showed, air grows cooler with height at the normal lapse rate. Sometimes this is turned upside down: the air near the ground is colder than the air above it, so temperature rises with height instead of falling. This reversal is called inversion of temperature.
An inversion usually lasts only a short time, but it is common. The ideal conditions are a long winter night with clear skies and still air. Through such a night the ground radiates away the heat it gained by day, and by the early morning hours the Earth’s surface is cooler than the air resting above it. Over polar areas, where the ground stays cold, temperature inversion is the normal state all year round.
Surface Inversion
An inversion at the surface makes the lowest layers of the air stable — they resist rising and mixing. Smoke and dust collect beneath the inversion layer and spread out sideways to fill the lower air, because nothing lifts them away. Dense morning fogs are a common result, especially in winter. This kind of inversion usually breaks up within a few hours, once the Sun climbs and begins to warm the ground again.
Air Drainage In The Hills
Inversion also happens in hills and mountains, by a different route. During the night the air chilled against the high slopes becomes cold and dense. Being heavy, it behaves almost like water: it flows downhill under gravity, gathering deep in hollows and valley bottoms, while warmer air sits above it. This downslope flow and pooling of cold air is called air drainage. Fig. 8.8 shows how it fills a valley floor.
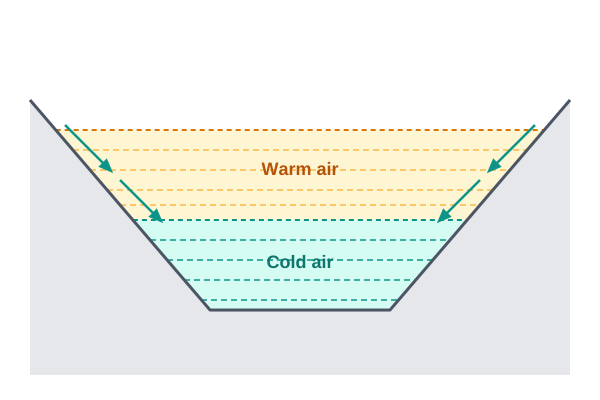
Fig. 8.8 – Air drainage in a valley.
Far from being only a hazard, air drainage does useful work: by keeping the coldest air pooled below and warmer air above the plants, it can protect them from frost damage.
8.5 Summary
- The Earth runs almost entirely on energy from the Sun. Incoming short-wave solar radiation is called insolation, and the Earth receives about 1.94 calories per square centimetre per minute at the top of its atmosphere, intercepting only a tiny share of the Sun’s output.
- The Earth’s distance from the Sun changes through the year — aphelion (152 million km) on 4th July, perihelion (147 million km) on 3rd January — so January brings slightly more insolation, but this effect is masked by the spread of land and sea and by atmospheric circulation.
- Insolation at the surface varies with the Earth’s rotation, the angle of the Sun’s rays, the length of day, atmospheric transparency and land aspect. Because the axis is tilted 66½° to its orbit, latitude sets the angle of the rays: slant rays spread over a larger area and cross more atmosphere, so they deliver less energy than vertical rays.
- The atmosphere is largely transparent to short-wave radiation; water vapour, ozone and other gases absorb the near-infrared, and scattering by suspended particles colours the sky.
- Surface insolation falls from about 320 watts per square metre in the tropics to about 70 at the poles. It is greatest over the subtropical deserts, where cloud is least, and is higher over continents than over oceans at the same latitude.
- The atmosphere is heated in three ways: conduction by contact, convection by rising currents, and advection by horizontal winds.
- The heated Earth radiates long-wave terrestrial radiation, which greenhouse gases such as carbon dioxide absorb, so the atmosphere is warmed from below.
- In the heat budget, of 100 units arriving, about 35 are reflected (the albedo) and 65 are absorbed; the Earth returns 65 units to space, so it neither warms nor cools over time.
- This balance is uneven by latitude — a surplus between about 40° N and 40° S and a deficit near the poles — and the surplus is carried poleward by winds and ocean currents.
- Temperature is the measure of heat, and its distribution is controlled by latitude, altitude (temperature falls 6.5°C per 1,000 m, the normal lapse rate), distance from the sea, air masses and ocean currents.
- Temperature is mapped with isotherms. Deviations from latitude are sharper in January and in the land-heavy northern hemisphere; continentality gives the widest annual range (over 60°C in north-eastern Eurasia), and the narrowest range (3°C) lies near the Equator.
- When the lapse rate reverses, the air near the ground becomes colder than the air above — an inversion of temperature. Clear, still winter nights produce surface inversions that trap fog and smoke, while air drainage pools cold air in valley bottoms and shields hillside plants from frost.
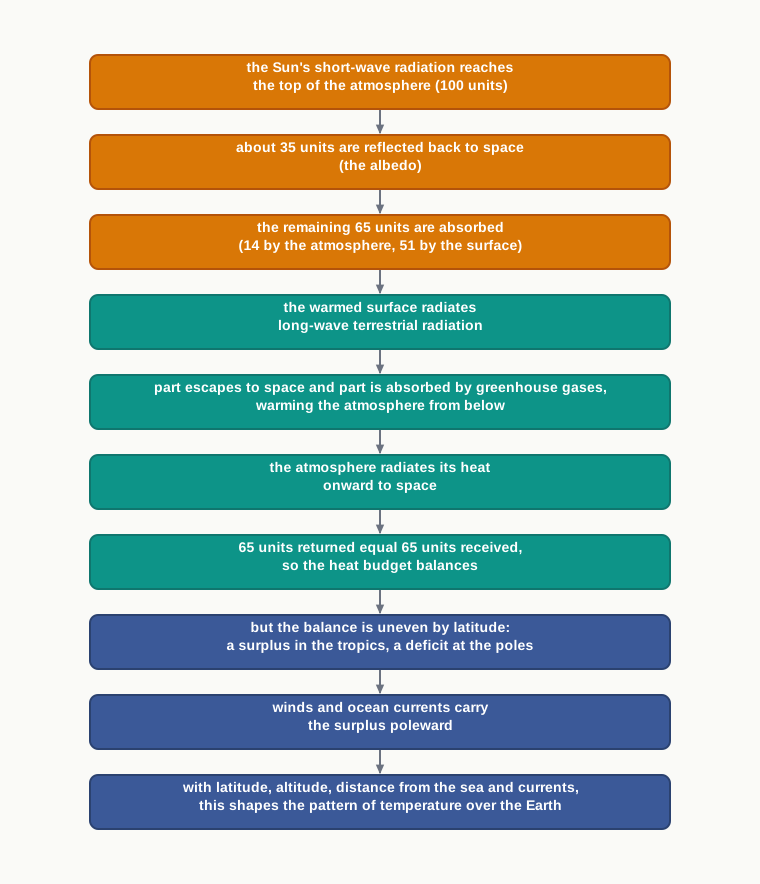
Fig. 8.9 – Heat balance and temperature summary.
What This Chapter Cannot Tell You
- The heat budget is drawn for the whole planet in round units. It does not tell you whether energy balances at any single place, or on any single day.
- The January and July maps are monthly means. They hide the daily highs and lows, the record extremes, and how the heat is spread through each month.
- The lapse rate of 6.5°C per 1,000 m and the budget figures are averages. On a real day, in a real valley, the air can invert or depart from them entirely.
8.6 NCERT Questions
- The sun is directly overhead at noon on 21st June at:
- The equator
- 23.5° S
- 23.5° N
- 66.5° N
- In which one of the following cities, are the days the longest?
- Tiruvanantpuram
- Chandigarh
- Hyderabad
- Nagpur
- The atmosphere is mainly heated by the:
- Short wave solar radiation
- Reflected solar radiation
- Long wave terrestrial radiation
- Scattered solar radiation
- Make correct pairs from the following two columns.
| Column 1 | Column 2 |
|---|---|
| a. Insolation | i. The difference between the mean temperature of the warmest and the coldest months |
| b. Albedo | ii. The lines joining the places of equal temperature |
| c. Isotherm | iii. The incoming solar radiation |
| d. Annual range | iv. The percentage of visible light reflected by an object |
The main reason that the earth experiences highest temperatures in the subtropics in the northern hemisphere rather than at the equator is:
- Subtropical areas tend to have less cloud cover than equatorial areas.
- Subtropical areas have longer day hours in the summer than the equatorial.
- Subtropical areas have an enhanced ‘green house effect’ compared to equatorial areas.
- Subtropical areas are nearer to the oceanic areas than the equatorial locations.
How does the unequal distribution of heat over the planet earth in space and time cause variations in weather and climate? (30 words)
What are the factors that control temperature distribution on the surface of the earth? (30 words)
In India, why is the day temperature maximum in May and why not after the summer solstice? (30 words)
Why is the annual range of temperature high in the Siberian plains? (30 words)
How do the latitude and the tilt in the axis of rotation of the earth affect the amount of radiation received at the earth’s surface? (150 words)
Discuss the processes through which the earth-atmosphere system maintains heat balance. (150 words)
Compare the global distribution of temperature in January over the northern and the southern hemisphere of the earth. (150 words)
Select a meteorological observatory located in your city or near your town. Tabulate the temperature data as given in the climatological table of observatories:
- Note the altitude, latitude of the observatory and the period for which the mean is calculated.
- Define the terms related to temperature as given in the table.
- Calculate the daily mean monthly temperature.
- Draw a graph to show the daily mean maximum, the daily mean minimum and the mean temperature.
- Calculate the annual range of temperature.
- Find out in which months the daily range of temperature is the highest and the lowest.
- List out the factors that determine the temperature of the place and explain the possible causes for temperature variation in the months of January, May, July and October.
This is the method the project asks you to carry out for a station near your own town. A range of 18.55°C means the average May day at this station runs about that much warmer than the average January day — a figure you can then set beside the range you calculate for your own observatory.
8.7 Check Your Concepts
Distinguish between conduction, convection and advection as three ways in which the atmosphere is heated.
Using Fig. 8.4, account for the 100 units of incoming solar radiation: state how many units are reflected before reaching the surface, how many are absorbed, and show that the radiation returning to space also adds up to 65 units.
Using the normal lapse rate, calculate how much the air temperature would fall over a climb of 2,000 m, and explain why places higher up are colder even though they lie nearer to the Sun.
Describe, step by step, how a surface temperature inversion forms over the ground on a clear, still winter night.
Explain how air drainage in hilly areas can protect the plants growing on the slopes from frost damage.
From Fig. 8.7, identify where the annual range of temperature is smallest, and explain why the range is so small there.
An isotherm map such as Fig. 8.6 (a) shows the mean January temperature of a place. State one thing this map does not tell you about that place’s weather.