Chapter 11: World Climate And Climate Change
Greenland is one of the largest islands on Earth, set in the cold North Atlantic just below the Arctic. Its name promises green, but its interior lies under a vast ice cap where the temperature stays below freezing even at the height of summer. It looks like a land that has always been frozen. It has not.
A thousand years ago, in the warm tenth and eleventh centuries, Norse settlers — the Vikings — crossed the open ocean and built farms along Greenland’s coast. For a time the climate was mild enough to keep a settlement alive in a place that today would not allow it. Then, from about 1550, the cold returned. Europe slid into a long chill lasting until roughly 1850 — the episode remembered as the Little Ice Age.
Climate, then, is not a fixed backdrop. It swings. The same patch of Earth can be warm enough to farm and, centuries later, gripped by ice. For almost all of the past, those swings were natural — driven by the Sun, by the slow wobble of the Earth’s orbit, and by the occasional volcano.
Today Greenland’s ice is retreating once again. But this time the cause is new: we are changing the air itself, thickening the blanket of gases that traps the planet’s heat (Fig. 11.0). To follow that story we need two things — a way to sort the world’s climates, and a way to read how they change.
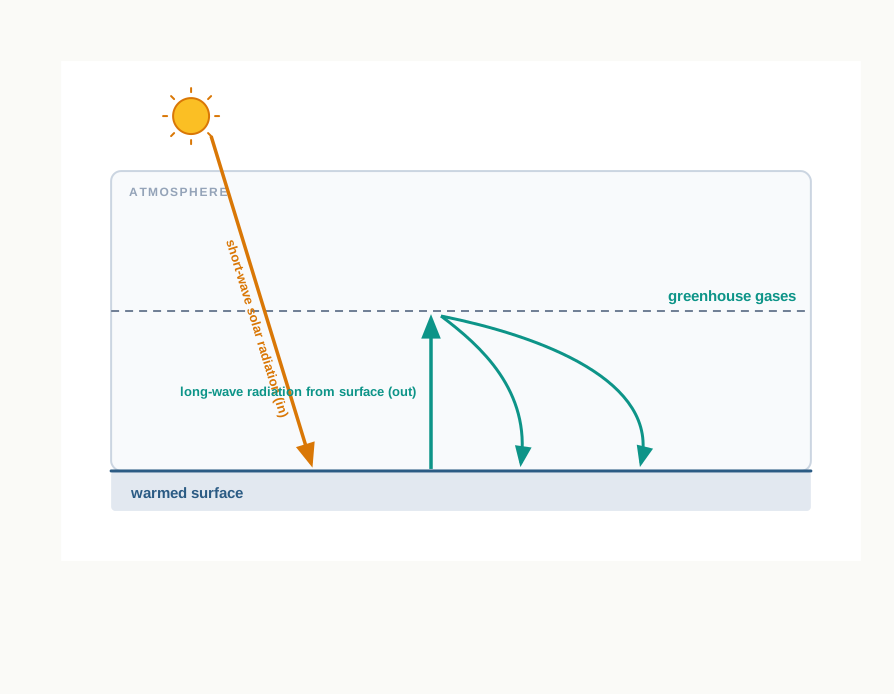
Fig. 11.0 – The greenhouse effect.
This chapter gives you the tools to answer each of these — first a way to classify the world’s climates, then a way to read how and why they change.
11.1 Koeppen’s Scheme Of Classification Of Climate
World climate is easier to study when we break it into smaller, similar units that can be described and compared. Geographers have taken three broad approaches to this sorting. An empirical classification rests on observed data — chiefly measured temperature and precipitation (the rain, snow and other moisture that reaches the ground). A genetic classification instead groups climates by their causes — the winds, pressure belts and air masses that produce them. An applied classification is built for one specific purpose, such as farming or construction.
The most widely used scheme is the empirical one built by V. Koeppen. Koeppen saw a close tie between natural vegetation and climate: where the plants change, the climate has changed beneath them. He chose particular values of temperature and precipitation that matched these vegetation boundaries, and used them to draw the lines between climates. His scheme works on mean annual and mean monthly temperature and precipitation — long-run averages, not single readings. Developed in 1918 and refined since, it is still popular and in use today.
How The Codes Work
Koeppen labelled his climates with letters, and the labels are worth learning to read. He recognised five major groups, marked by the capital letters A, B, C, D and E. Four of them — A, C, D and E — are fixed by temperature; only B, the dry group, is fixed by precipitation. The capitals A, C, D and E mark humid climates, while B marks dry ones. Table 11.1 lists the five groups and the exact temperature or moisture condition that defines each.
Reading down Table 11.1, you can see that the sorting is really a short run of questions. Is the place dry, its potential evaporation — the water that could evaporate if it were available — outrunning its rainfall? Then it is B. If not, the temperature of the coldest month settles the rest. Fig. 11.1 lays out that decision as a branching chart.
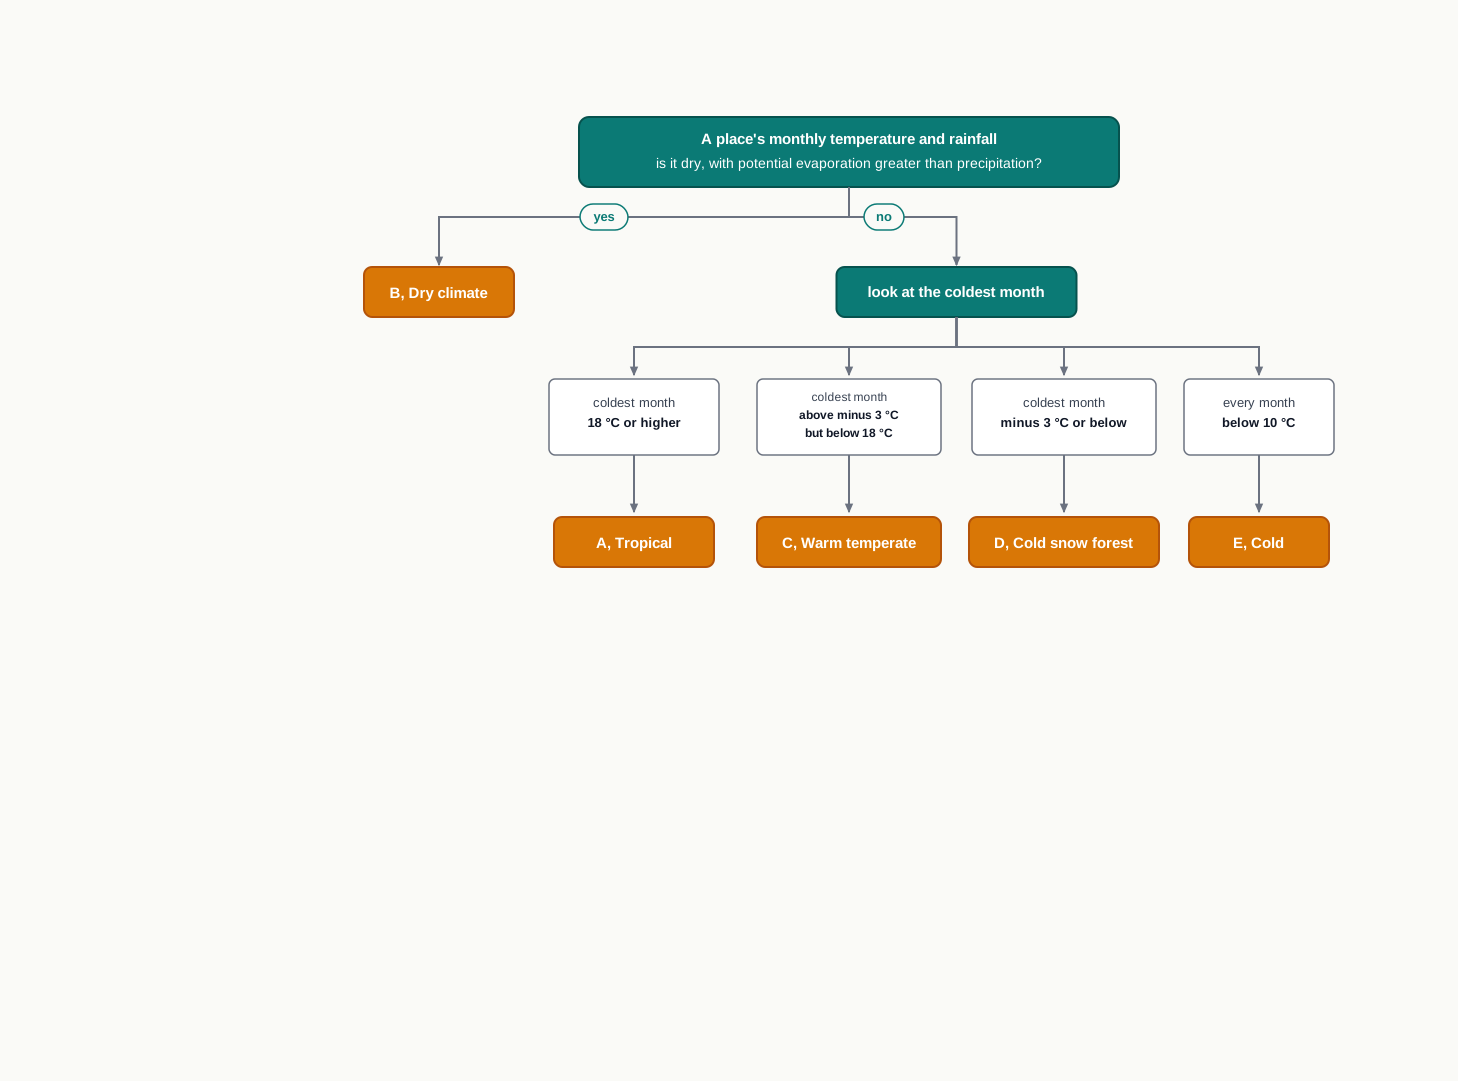
Fig. 11.1 – Koeppen’s climate classification decision tree.
Within each group, small letters mark finer types, based on the season of dryness and the severity of temperature. For moisture, f means no dry season, m a monsoon pattern, w a dry winter and s a dry summer. For temperature, the letters a, b, c and d grade the severity from mild to extreme. The dry B group takes two capitals of its own: S for steppe, the semi-arid grassland, and W for true desert. Table 11.2 gathers all the types with their letter codes.
11.1.1 Group A : Tropical Humid Climates
Tropical humid climates lie in the warm belt between the Tropic of Cancer and the Tropic of Capricorn. Here the midday sun stands nearly overhead through the year, and the Inter Tropical Convergence Zone (ITCZ) — the equatorial belt where the trade winds meet and moist air is forced to rise — sits over or near the region. Rising moist air cools and sheds heavy rain, so the climate is hot and wet.
The annual range of temperature is very low, because the Sun’s angle over the year barely changes, and annual rainfall is high. The group divides into three types: Af, tropical wet; Am, tropical monsoon; and Aw, tropical wet and dry.
11.1.1.1 Tropical Wet Climate (Af)
Tropical wet climate is found close to the equator. Its major regions are the Amazon Basin in South America, western equatorial Africa and the islands of the East Indies in Southeast Asia. Rain falls in every month of the year, usually as thunder showers built by the afternoon heat.
Temperature stays uniformly high and its annual range is negligible — the maximum on any day is around 30°C and the minimum around 20°C. These warm, wet, unchanging conditions support tropical evergreen forests, with a dense canopy and very large biodiversity.
11.1.1.2 Tropical Monsoon Climate (Am)
Tropical monsoon climate is found over the Indian sub-continent, the north-eastern part of South America and northern Australia. Heavy rain falls mostly in summer, while winter is dry — the seasonal reversal that gives the monsoon its name. NCERT notes that this type is described more fully in the companion book, India: Physical Environment.
11.1.1.3 Tropical Wet And Dry Climate (Aw)
Tropical wet and dry climate lies just north and south of the Af regions. On the western side of a continent it borders the dry climates, and on the eastern side the Cf or Cw types. Extensive Aw country is found north and south of the Amazon forest — across parts of Brazil and neighbouring Bolivia and Paraguay in South America — and again in Sudan and the land south of Central Africa.
Its annual rainfall is considerably less than in the Af and Am types, and far more variable. The wet season is shorter and the dry season longer, so droughts here are more severe. Temperature stays high through the year, and the day-to-night, or diurnal, range is greatest in the dry season, when there is little moisture to hold the day’s heat overnight. Deciduous forest and grassland dotted with trees grow in this climate.
11.1.2 Dry Climates : B
Dry climates are marked by rainfall too low to support a full cover of plants. They spread across a very large area, roughly 15° to 60° north and south of the equator — but for two different reasons at two sets of latitudes.
In the low latitudes, from about 15° to 30°, they sit under the subtropical high, a belt of descending air. As this air sinks it warms, and warming air tends to hold moisture rather than release it, so clouds and rain seldom form; a temperature inversion — warmer air lying over cooler air, which blocks rising currents — deepens the dryness. On the western margins of continents, beside cold ocean currents, these dry climates push further towards the equator and reach right to the coast.
In the middle latitudes, from about 35° to 60°, the dryness has a different source. These areas lie deep in continental interiors where the moist sea winds never reach, often walled off further by mountains.
The B group divides into steppe or semi-arid climate (BS) and desert climate (BW). Each splits again by latitude: subtropical steppe (BSh) and subtropical desert (BWh) between about 15° and 35°, and mid-latitude steppe (BSk) and mid-latitude desert (BWk) between about 35° and 60°.
11.1.2.1 Subtropical Steppe (BSh) And Subtropical Desert (BWh) Climates
The subtropical steppe (BSh) and subtropical desert (BWh) share the same basic pattern of rainfall and temperature. Both lie in the transition zone between humid and dry lands. The steppe, at the wetter edge of that zone, gets a little more rain than the desert — just enough for sparse grassland.
In both, rainfall is highly variable from one year to the next, and that unreliability hurts the steppe more than the desert. More life leans on the steppe’s grass, so a failed year there can bring famine. In the desert, rain arrives in short, intense thunder showers that run off before they can soak in, doing little to build soil moisture. Where a cold current chills the shore, fog is common along coastal deserts.
Summer daytime temperatures climb very high. The highest shade temperature on record, 58°C, was measured at Al Aziziyah in Libya, in North Africa, on 13 September 1922. Both the annual and the diurnal ranges of temperature are large here.
11.1.3 Warm Temperate (Mid-Latitude) Climates-C
Warm temperate, or mid-latitude, climates stretch from about 30° to 50° of latitude, mainly along the eastern and western edges of continents. They generally bring warm summers with mild winters. NCERT groups them into four types: humid subtropical with a dry winter and hot summer (Cwa); Mediterranean (Cs); humid subtropical with no dry season and a mild winter (Cfa); and marine west coast (Cfb).
11.1.3.1 Humid Subtropical Climate (Cwa)
This type lies just poleward of the Tropic of Cancer and the Tropic of Capricorn, chiefly in the North Indian plains and the interior plains of South China. Its weather is much like the Aw type, except that here the winter stays warm rather than merely dry.
11.1.3.2 Mediterranean Climate (Cs)
As its name suggests, this climate rings the Mediterranean sea, and it returns on the west coasts of continents in the subtropical latitudes between about 30° and 40° — in Central California, in Central Chile, and along the coasts of south-eastern and south-western Australia. In summer these coasts fall under the dry subtropical high; in winter the rain-bearing westerly winds reach them.
The result is a hot, dry summer and a mild, rainy winter. The average monthly temperature is around 25°C in summer and below 10°C in winter, and annual precipitation runs between 35 and 90 cm.
11.1.3.3 Humid Subtropical (Cfa) Climate
Humid subtropical climate of the Cfa type lies on the eastern parts of continents in the subtropical latitudes. Here the air masses are generally unstable and bring rainfall through the year. It occurs in the eastern United States, southern and eastern China, southern Japan, north-eastern Argentina, coastal South Africa and the eastern coast of Australia.
Annual precipitation ranges from 75 to 150 cm, arriving as summer thunderstorms and as winter frontal rain — rain formed where a warm air mass rides up over a colder one. Mean monthly temperature is around 27°C in summer and between 5° and 12°C in winter, and the daily range of temperature is small.
11.1.3.4 Marine West Coast Climate (Cfb)
Marine west coast climate lies just poleward of the Mediterranean type, on the western coasts of continents. Its main areas are north-western Europe, the west coast of North America north of California, southern Chile, south-eastern Australia and New Zealand.
Because the sea warms and cools far more slowly than land, its influence keeps temperatures moderate, and in winter warmer than the latitude alone would promise. Mean summer temperature ranges from 15° to 20°C and winter from 4° to 10°C, so both the annual and the daily ranges stay small. Rain falls throughout the year, varying widely from 50 to 250 cm.
11.1.4 Cold Snow Forest Climates (D)
Cold snow forest climates occupy the great continental stretch of the northern hemisphere between about 40° and 70° north, across Europe, Asia and North America. They come in two types: Df, with a humid winter, and Dw, with a dry winter. The severity of winter deepens as one moves to higher latitudes.
11.1.4.1 Cold Climate With Humid Winters (Df)
This type lies poleward of the marine west coast and mid-latitude steppe climates. Winters are cold and snowy, and the frost-free season is short. The annual range of temperature is large, and spells of weather change abruptly and briefly. The further poleward one goes, the more severe the winter becomes.
11.1.4.2 Cold Climate With Dry Winters (Dw)
Cold climate with a dry winter is found mainly over north-eastern Asia. A strong winter anticyclone — a centre of high pressure with air flowing outward from it — builds here, then weakens in summer, setting up a monsoon-like reversal of the winds. Towards the poles, summer temperatures fall and winter temperatures drop to extremes, with many places staying below freezing for up to seven months of the year. What precipitation there is comes in summer, and the annual total is low, from 12 to 15 cm.
11.1.5 Polar Climates (E)
Polar climates lie poleward of about 70° latitude. They fall into two types: tundra (ET) and ice cap (EF).
11.1.5.1 Tundra Climate (ET)
The tundra climate takes its name from its vegetation — low-growing mosses, lichens and flowering plants. It is a land of permafrost, ground whose subsoil stays frozen the year round. A short growing season and waterlogged soil allow only these low plants to survive. Through the polar summer, the tundra has very long hours of daylight.
11.1.5.2 Ice Cap Climate (EF)
The ice cap climate covers interior Greenland and Antarctica. Even in summer the temperature stays below freezing, and very little precipitation falls. Snow and ice pile up year on year; under their mounting weight the ice sheets deform and break, and the broken masses move off as icebergs that drift in Arctic and Antarctic waters. Plateau Station in Antarctica, at 79°S, records this climate.
11.2 Climate Change
The earlier parts of this book described climate as it prevails now. But the climate we live in today may only have held for the last 10,000 years or so, with minor and occasionally wide swings within that span. Over its whole long history, the planet has passed through many different climates. Geological records show a repeated alternation of glacial periods, when ice sheets advanced, and inter-glacial periods, the warmer intervals between them.
How We Read The Past
We have no thermometer readings from thousands of years ago, yet the Earth keeps its own records, and geographers have learnt to read them. In high mountains and high latitudes, geomorphological features — the shape of the land itself — carry the scars of glaciers advancing and retreating. Sediment settling on the beds of old glacial lakes preserves a layered record of warm and cold spells. The rings inside old trees grow wide in wet years and narrow in dry ones. Historical writings describe the vagaries of past weather. Read together, all these lines of evidence point to one conclusion: change in climate is a natural and continuous process.
India’s Wet And Dry Past
India too has swung between wet and dry. Archaeological findings show that the Rajasthan desert, in north-western India, had a wet and cool climate around 8,000 B.C. The period from 3,000 to 1,700 B.C. brought higher rainfall, and from about 2,000 to 1,700 B.C. this same region was a centre of the Harappan civilisation. Only afterwards did dry conditions take firm hold and deepen.
Ice Ages In Deep Time
Further back still, the changes are larger. Some 500 to 300 million years ago, through the Cambrian, Ordovician and Silurian periods — early divisions of geological time — the Earth was warm. Much later, during the Pleistocene epoch, glacial and inter-glacial periods came and went; the last major peak of glaciation was about 18,000 years ago. The present inter-glacial period, the relatively warm one we still live in, began about 10,000 years ago.
11.2.1 Climate In The Recent Past
Variability in climate is going on all the time, and the recent past shows it plainly. The 1990s brought a run of extreme weather — the decade recorded the warmest temperatures of that century, along with some of the worst floods seen around the world.
Two droughts stand out as examples of this variability. A devastating drought struck the Sahel region, the dry belt just south of the Sahara desert in Africa, from 1967 to 1977. In the 1930s, a severe drought hit the south-western Great Plains of the United States, remembered as the dust bowl. Records of crop yields and failures, of floods and of people forced to migrate all trace the effects of a shifting climate.
Europe’s history carries the same signal. It passed through warm, wet, cold and dry spells; among the notable episodes were the warm, dry conditions of the tenth and eleventh centuries, when the Vikings settled in Greenland, and the long cold spell from 1550 to about 1850 known as the Little Ice Age. World temperature then showed an upward trend from about 1885 to 1940, after which the rate of increase slowed for a time.
11.2.2 Causes Of Climate Change
The causes of climate change are many, and the chapter sorts them into two families: astronomical causes, which lie beyond the Earth, and terrestrial causes, which act on the Earth itself. Fig. 11.2 lays out both families and their members.
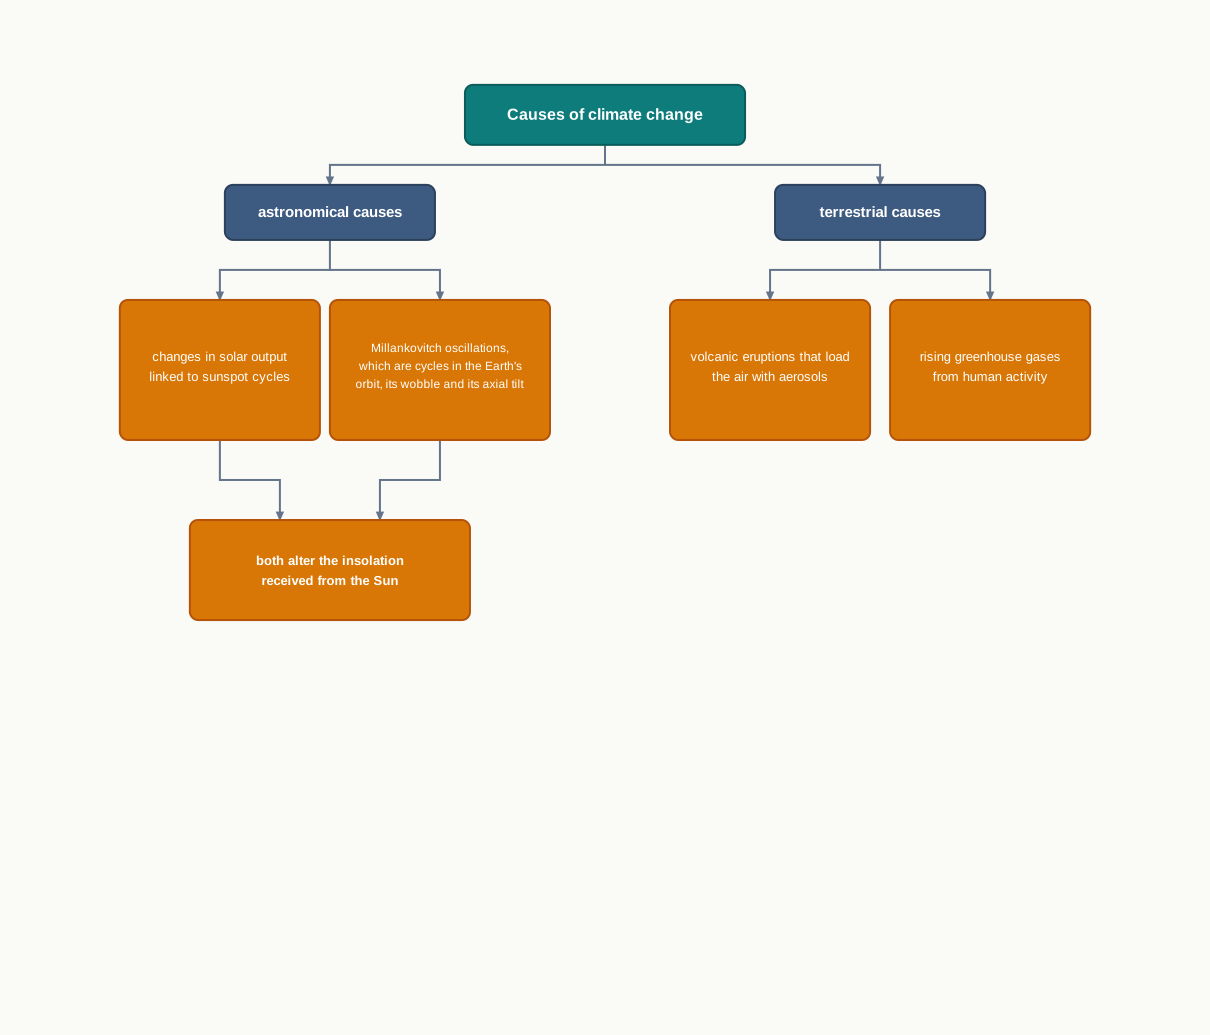
Fig. 11.2 – The astronomical and terrestrial causes of climate change.
Astronomical Causes
The first astronomical cause is a change in the Sun’s own output, linked to sunspots — the dark, cooler patches on the Sun’s surface that grow and shrink in a repeating cycle. Some meteorologists suggest that when sunspot numbers rise, weather turns cooler, wetter and stormier, and that when they fall, conditions grow warmer and drier. These findings, however, are not statistically significant, so they must be treated with caution.
The second astronomical idea is the set of Millankovitch oscillations. These are slow, repeating cycles in the Earth’s path around the Sun — in the shape of its orbit, in the wobble of its spinning axis, and in the axial tilt, the angle at which that axis leans. Each of these changes the amount of insolation, the incoming solar radiation the Earth receives, and so might bear on the climate.
Terrestrial Causes
Volcanism is a cause that comes from the Earth itself. A large eruption throws great quantities of aerosols — fine particles and droplets — high into the atmosphere, where they linger for a considerable time and cut down the Sun’s radiation reaching the surface. After the recent Pinatoba and El Cion eruptions, the Earth’s average temperature fell to some extent for a few years.
The most important human, or anthropogenic, effect on climate is the rising concentration of greenhouse gases in the atmosphere, which is likely to cause global warming. This is the cause the rest of the section examines.
11.2.3 Global Warming
Because of these greenhouse gases, the atmosphere behaves like a greenhouse. It lets the incoming short-wave solar radiation pass through, but absorbs the vast majority of the long-wave radiation that the warmed surface sends back upward. The gases that trap this outgoing radiation are the greenhouse gases, and the warming they cause is called the greenhouse effect (Fig. 11.0).
The name comes from the glasshouses used in cold countries to keep plants warm. Their glass is transparent to incoming short-wave solar radiation but opaque to outgoing long-wave radiation, so it lets heat in and holds it in, leaving the inside warmer than the outside. You feel the same thing when you step into a car or bus left standing in the summer sun with its windows shut — it is hotter inside than out; in winter, a closed vehicle stays warmer than the air around it.
11.2.3.1 Greenhouse Gases (GHGs)
The main greenhouse gases of concern today are carbon dioxide (CO₂), chlorofluorocarbons (CFCs), methane (CH₄), nitrous oxide (N₂O) and ozone (O₃). A few other gases, such as nitric oxide (NO) and carbon monoxide (CO), react readily with these and affect their concentration in the air.
How strongly a given gas matters depends on three things: how much its concentration has risen, how long each molecule survives in the atmosphere, and the wavelength of radiation it absorbs. The CFCs are highly effective. Ozone, which absorbs ultra-violet radiation up in the stratosphere — the upper layer of the atmosphere — is very effective at absorbing terrestrial radiation when it is present lower down, in the troposphere, the bottom layer where weather occurs. And the longer a molecule lingers, the longer it takes the whole atmospheric system to recover from any change it causes.
By quantity, the largest concentration of greenhouse gases is carbon dioxide. Most of it is released by burning fossil fuels — oil, gas and coal. Forests and oceans act as sinks, drawing carbon dioxide back out of the air; forests in particular use it as they grow, so clearing forests for other land uses raises the gas twice over — by removing a sink and, often, by burning. The atmosphere takes 20 to 50 years to adjust as sources and sinks change, and the concentration is rising at about 0.5 per cent each year. Climate models often use a doubling of carbon dioxide over its pre-industrial level as a yardstick for estimating how much the climate may change.
The chlorofluorocarbons are entirely products of human activity, and they reach into a second problem. High in the stratosphere, ultra-violet rays strike oxygen and turn it into ozone; this ozone layer soaks up those rays before they reach the ground. CFCs that drift up into the stratosphere destroy that ozone. The loss is heaviest over Antarctica, where the thinned patch is called the ozone hole, and through it more ultra-violet radiation passes down into the troposphere.
The World’s Response
Countries have begun to act together to cut greenhouse-gas emissions. The most important step is the Kyoto protocol, proclaimed in 1997. It came into force in 2005, ratified by 141 nations, and it bound 35 industrialised countries to bring their emissions, by 2012, to 5 per cent below the levels of 1990.
The worry behind these efforts is serious. Rising greenhouse gases may, over the long run, warm the Earth, and once global warming sets in it will be hard to reverse. Its effects will not be even everywhere, but they will strain the systems that support life. In particular, a rise in sea level — fed by melting glaciers and ice-caps and by the thermal expansion of sea water as it warms — could flood large stretches of low coast and many islands, displacing people and causing widespread hardship. Fig. 11.3 traces that chain from cause to consequence.
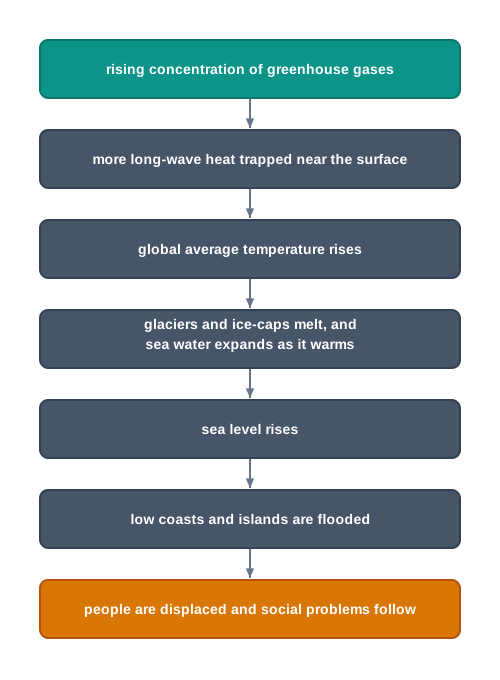
Fig. 11.3 – Global warming and coastal flooding.
The signs are already being watched in the field. News reports gathered in this chapter describe Himalayan glaciers retreating quickly, among them the Gangotri glacier, high in the Himalayas and a source of the Ganga, which has been receding at an average of about 23 metres a year; maps of its snout show it has drawn back steadily since 1780. Because such glaciers feed the great rivers on which millions in India, China and Nepal depend, their retreat threatens future water supplies. Elsewhere, ancient air trapped as bubbles in Antarctic ice is being drawn out to read past levels of greenhouse gases, confirming how far today’s are rising. As you finish this section, it is worth pausing to write your own short explanatory note on global warming, drawing the causes and effects above into a single account.
The Warming In The Record
How much has the planet actually warmed? The annual average near-surface air temperature of the world is about 14°C. Within the twentieth century a clear upward trend appeared, sharpest in two stretches — 1901 to 1944 and 1977 to 1999 — during each of which global temperatures rose by roughly 0.4°C. Between them came a slight cooling, more marked in the Northern Hemisphere. By the close of the twentieth century the globally averaged annual mean temperature stood about 0.6°C above the level recorded at the end of the nineteenth. Of all the years measured between 1856 and 2000, the seven warmest fell in the final decade, and 1998 was the warmest of all — probably the warmest not just of the century but of the whole millennium.
11.3 Summary
- World climate is easier to study when broken into smaller, similar units. Three approaches exist: empirical (from observed data), genetic (by causes) and applied (for a specific purpose).
- Koeppen’s empirical scheme is the most widely used. Built on mean monthly and mean annual temperature and precipitation, it ties climate to the vegetation it supports.
- There are five major groups, marked by capital letters. A, C, D and E are set by temperature and mark humid climates; B is set by precipitation and marks dry climates.
- Small letters split each group into types: f, m, w and s for the season of dryness, and a to d for the severity of temperature. The dry group B is split into steppe (S) and desert (W).
- Group A, tropical humid, is hot and wet with a very low temperature range. Its types are Af (wet), Am (monsoon) and Aw (wet and dry).
- Group B, dry, has rainfall too low for a full cover of plants. Low-latitude deserts sit under the descending air of the subtropical high; mid-latitude deserts lie deep in continental interiors.
- Group C, warm temperate, runs from about 30° to 50° with warm summers and mild winters. Its types include the Mediterranean (Cs) and marine west coast (Cfb).
- Group D, cold snow forest, occupies continental interiors from about 40° to 70° north, with humid-winter (Df) and dry-winter (Dw) types and severe winters.
- Group E, polar, lies beyond about 70°. Tundra (ET) is a land of permafrost; ice cap (EF) covers interior Greenland and Antarctica.
- Climate is not fixed. Change is a natural and continuous process, read from glacier traces, glacial-lake sediments, tree rings and historical and archaeological records.
- India has swung between wet and dry: the Rajasthan desert was wet around 8,000 B.C. and hosted the Harappan civilisation before drying out.
- In deep time the Earth was warm 500 to 300 million years ago, passed through Pleistocene ice ages, and entered the present inter-glacial period about 10,000 years ago.
- Recent variability includes the extreme 1990s, the Sahel and dust bowl droughts, the Little Ice Age (1550 to about 1850) and the warming of 1885 to 1940.
- The causes of change group into astronomical ones (sunspot cycles and Millankovitch oscillations) and terrestrial ones (volcanism and, above all, rising greenhouse gases from human activity).
- In the greenhouse effect, the atmosphere lets short-wave sunlight in but traps outgoing long-wave radiation. Carbon dioxide, mostly from burning fossil fuels, is the largest greenhouse gas; forests and oceans are its sinks.
- CFCs rising into the stratosphere destroy ozone, opening the ozone hole over Antarctica and letting more ultra-violet radiation through.
- Nations have responded through the Kyoto protocol (1997, in force 2005), which bound industrialised countries to cut emissions below their 1990 levels.
- The world’s near-surface average temperature is about 14°C. It rose by roughly 0.6°C over the twentieth century, with 1998 the warmest year; continued warming may raise sea level and flood low coasts and islands.
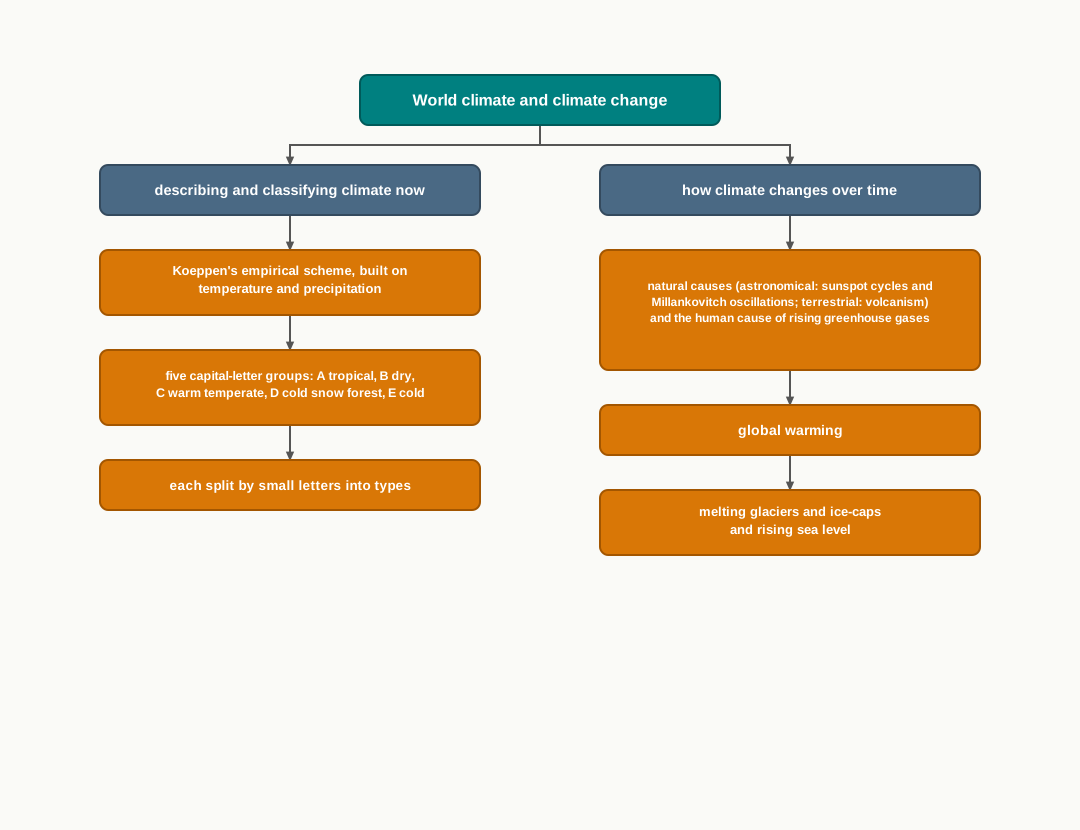
Fig. 11.4 – Chapter summary: World climate and climate change.
What This Chapter Cannot Tell You
Koeppen’s five letters are averages, and an average is a summary, not the weather: a single code smooths over the daily swings and the local variety inside any climate type, and every boundary line is really drawn through a gradient. The warming figures — a world average near 14°C, a rise of about 0.6°C across the century — are single numbers for a whole planet, and as the chapter itself warns, the warming is not uniform; these figures cannot tell you which regions or seasons changed most. And the causes carry unequal confidence: the sunspot link is not statistically significant, the orbital cycles only might bear on climate, and a model that leans on a doubling of carbon dioxide is an estimate resting on its own assumptions.
11.4 NCERT Questions
Which one of the following is suitable for Koeppen’s ‘A’ type of climate?
- High rainfall in all the months
- Mean monthly temperature of the coldest month more than freezing point
- Mean monthly temperature of all the months more than 18°C
- Average temperature for all the months below 10°C
Koeppen’s system of classification of climates can be termed as :
- Applied
- Systematic
- Genetic
- Empirical
Most of the Indian Peninsula will be grouped according to Koeppen’s system under:
- ‘Af’
- ‘BSh’
- ‘Cfb’
- ‘Am’
Which one of the following years is supposed to have recorded the warmest temperature the world over?
- 1990
- 1998
- 1885
- 1950
Which one of the following groups of four climates represents humid conditions?
- A—B—C—E
- A—C—D—E
- B—C—D—E
- A—C—D—F
Which two climatic variables are used by Koeppen for classification of the climate? (30 words)
How is the ‘genetic’ system of classification different from the ‘empirical one’? (30 words)
Which types of climates have very low range of temperature? (30 words)
What type of climatic conditions would prevail if the sun spots increase? (30 words)
Make a comparison of the climatic conditions between the ‘A’ and ‘B’ types of climate. (150 words)
What type of vegetation would you find in the ‘C’ and ‘A’ type(s) of climate? (150 words)
What do you understand by the term ‘Greenhouse Gases’? Make a list of greenhouse gases. (150 words)
11.5 Check Your Concepts
Using what the letters stand for, explain what the code Cs tells you about a climate’s group and its dry season. Check your answer against Table 11.2.
Using Table 11.1, explain how Koeppen would decide whether a humid station belongs to group A, C or D, given only the average temperature of its coldest month.
Both Af and Aw are tropical climates, yet their rainfall differs sharply. Describe how the two differ, and explain why the Aw climate has a long dry season while the Af climate does not.
Dry climates occur both at 15° to 30° and at 35° to 60° north and south of the equator. Explain the different reason for the dryness in each of these two belts.
No instruments recorded temperature thousands of years ago. Explain how tree rings and the sediments of old glacial lakes can still tell us about past climates.
Explain, step by step, how the greenhouse effect leaves the Earth’s surface warmer than it would be without an atmosphere. Why is the glasshouse a fair comparison?
Using Fig. 11.3, trace the chain of events by which a rising concentration of greenhouse gases could end in the flooding of a low coastal area.
The world’s average temperature rose by about 0.6°C over the twentieth century. Explain why this single figure cannot tell you how much any one region or season warmed.