Chapter 12: Water (Oceans)
Every drop of rain that has ever fallen on India began somewhere over an ocean. The sun, pouring heat onto the sea surface, lifts water into the air as invisible vapour. Winds carry that vapour inland — the same movement of moisture by wind that drives the monsoon a student waits for each June. Over the cooling hills the vapour condenses, gathers into cloud, and falls as rain. Some of it soaks into the soil, some runs off down streams and rivers, and in time it finds its way back to the sea. Then the sun lifts it again.
This is the hydrological cycle, and it has been turning for billions of years, moving the same water round and round without ever making more. That water settles overwhelmingly in one place. Look at the earth from space and it shows up blue, because ocean covers most of its surface — which is why we call it the Blue Planet.
But the ocean is far stranger than a flat sheet of water. Drain it, and you would uncover the planet’s longest mountain chains, its deepest valleys, and vast level plains — a hidden landscape as rugged as any on land. Sink into it, and the warm surface gives way to water that grows colder, denser and, in places, far saltier than the sea you started in.
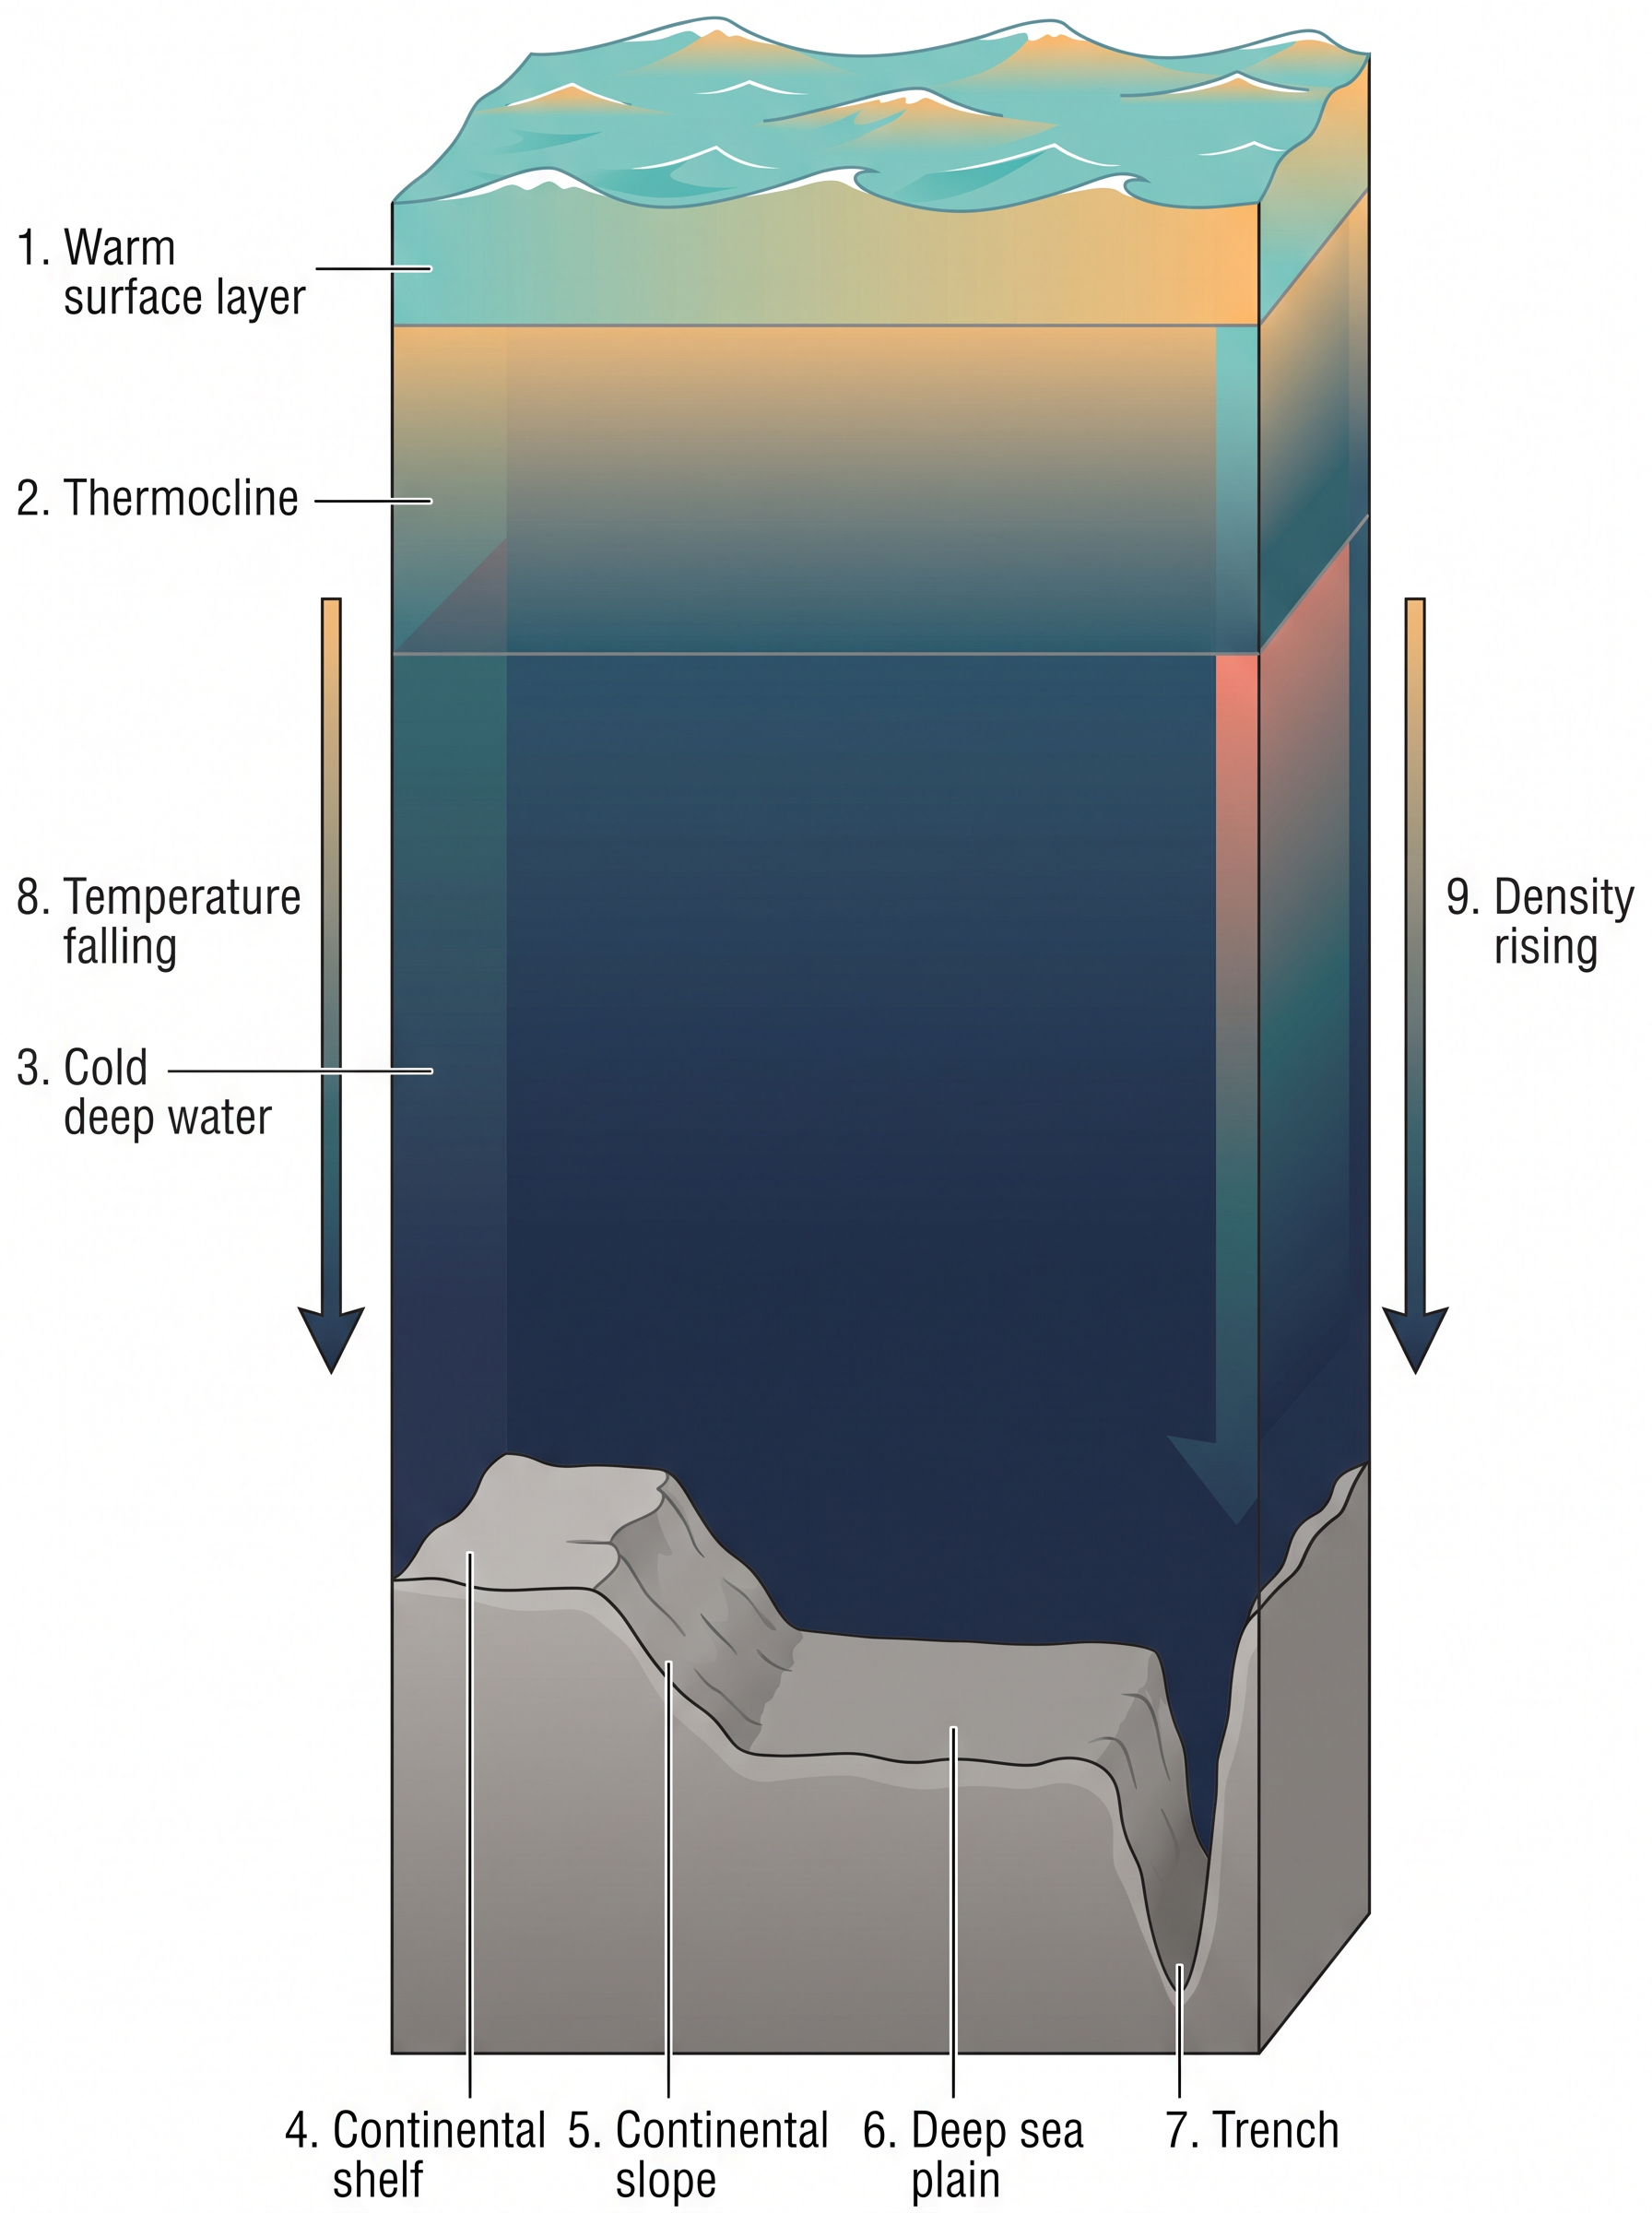
Fig. 12.0 – Vertical cutaway of the ocean column.
This chapter will let you answer each of these.
12.1 Hydrological Cycle
Water, The Cyclic Resource
Can we imagine life without water? Water is life. It is an essential part of every living thing on Earth, and the creatures of this planet are fortunate to live on a world so richly supplied with it. Water is a rare commodity in the solar system — there is none on the Sun and none anywhere else nearby.
The Earth alone carries an abundant supply on its surface, which is why it is called the ‘Blue Planet’. And this water is a cyclic resource: it can be used, and then used again. It travels in a great circuit — from the ocean to the land and back from the land to the ocean — changing its form as it goes.
How The Cycle Turns
The hydrological cycle is the circulation of water through the Earth’s hydrosphere in all three of its physical states — liquid water, solid ice and gaseous vapour. The hydrosphere is simply all the water of the planet taken together: the oceans, the ice, the groundwater, the moisture in the air, and the water held inside living things. The cycle describes how water moves on the surface, below it and above it, exchanging continuously between the oceans, the atmosphere, the land, the subsurface and organisms. It has been running for billions of years, and after air, water is the single most important requirement for life.
Now follow the water round. The Sun’s heat turns liquid water into vapour by evaporation; over vegetated land, plants release water vapour too, and the two together are called evapotranspiration. Where ice turns straight into vapour without first melting, the process is sublimation. The rising vapour cools, condenses into cloud, and returns to the surface as precipitation — rain or snow. On land the fallen water divides: some flows downhill as runoff and gathers into streams and rivers; some soaks downward by infiltration to become groundwater; and some is locked away as glacier ice. In time nearly all of it finds its way back to the ocean, where the Sun lifts it once more.
Fig. 12.1 pictures this circuit running across a landscape, from the ocean on one side to the hills on the other.
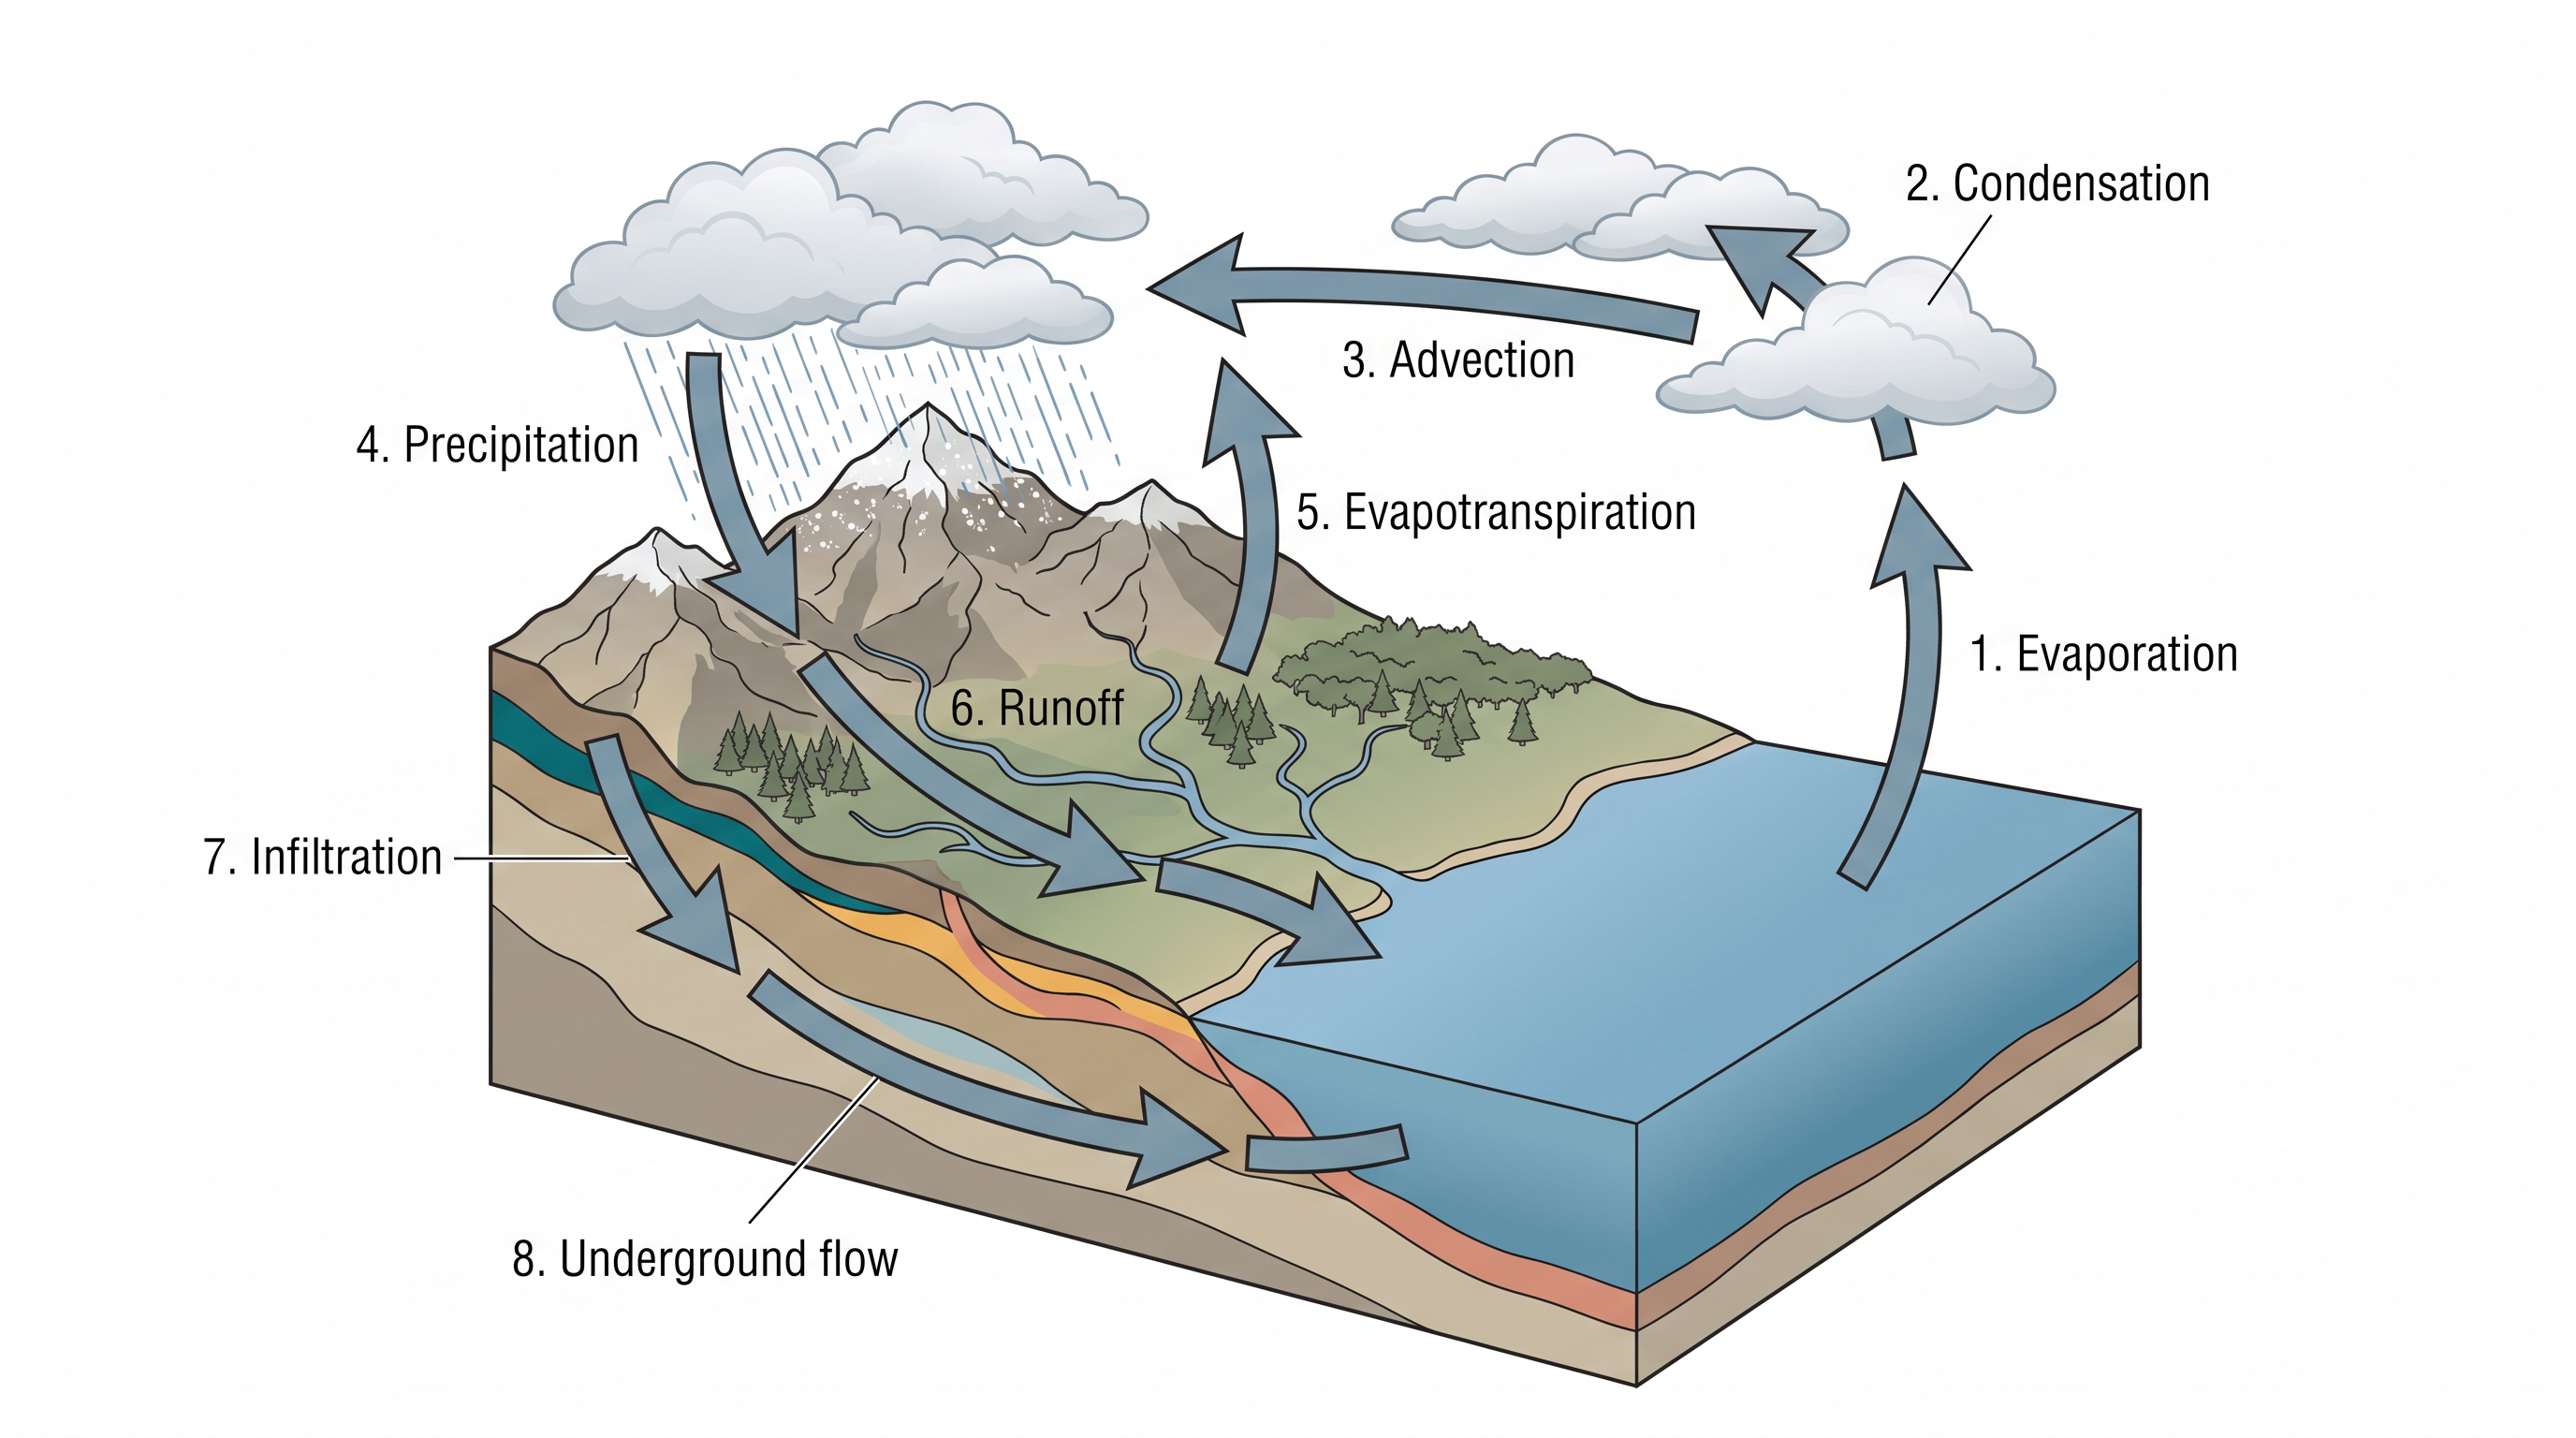
Fig. 12.1 – The hydrological cycle.
Drawn as a plain sequence rather than a picture, the same journey shows exactly where the water on land splits into its separate paths (Fig. 12.2).
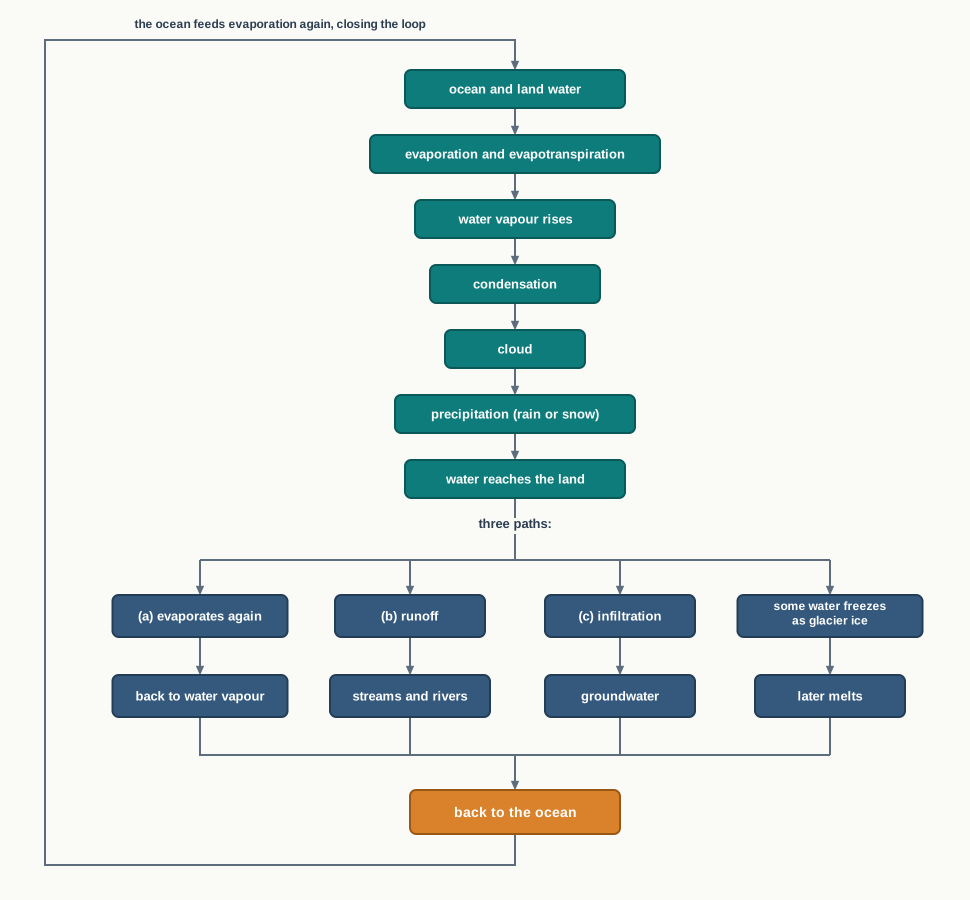
Fig. 12.2 – Paths of water in the hydrological cycle.
Table 12.1 tells the same story as a list: where the world’s water is stored, and the processes that move it between those stores.
Where The World’s Water Sits
The water is very unevenly shared out. About 91 per cent of all the planet’s water sits in the oceans as salt water. The rest — only a small fraction — is the freshwater held in glaciers and icecaps, in groundwater, in lakes, in soil moisture, in the atmosphere, in streams, and within living things.
Of the water that falls on the land, nearly 59 per cent returns to the atmosphere by evaporation, both from over the oceans and from other places. The remainder runs off across the surface, infiltrates into the ground, or freezes into glacier ice — and in the end rejoins the circuit.
A Fixed Supply, A Rising Demand
Here is the tension that runs through the whole study of water. The renewable water on Earth is constant — the cycle neither makes new water nor destroys the old — yet human demand for it is rising steeply. The result is a water crisis that differs from place to place and from season to season, one that is felt both spatially and over time.
The pollution of river waters has made it sharper still, because water that is fouled is water that cannot be used. It is worth pausing on the real question the chapter puts to you: how could you help to improve water quality, and add to the quantity of water available, in the place where you live?
12.2 Relief Of The Ocean Floor
The oceans lie in the great depressions of the Earth’s outer layer. Unlike the continents, which end at clear coastlines, the oceans merge so smoothly into one another that they are hard to tell apart. For convenience, geographers divide the oceanic part of the Earth into five oceans — the Pacific, the Atlantic, the Indian, the Southern and the Arctic — and treat the various seas, bays, gulfs and other inlets as parts of these oceans.
Most of the ocean floor lies between 3 and 6 km below sea level. But this drowned ‘land’ is far from featureless. The ocean floor is as complex and varied as the surface we walk on — it carries the world’s largest mountain ranges, its deepest trenches and its widest plains. These features are built, exactly as those on land are, by tectonic forces (the movement of the Earth’s plates), by volcanic activity, and by deposition (the settling of sediment).
Fig. 12.3 sets out the main relief of the ocean floor in three cutaway blocks — the continental margin, the deep ocean basin and the mid-ocean ridge.
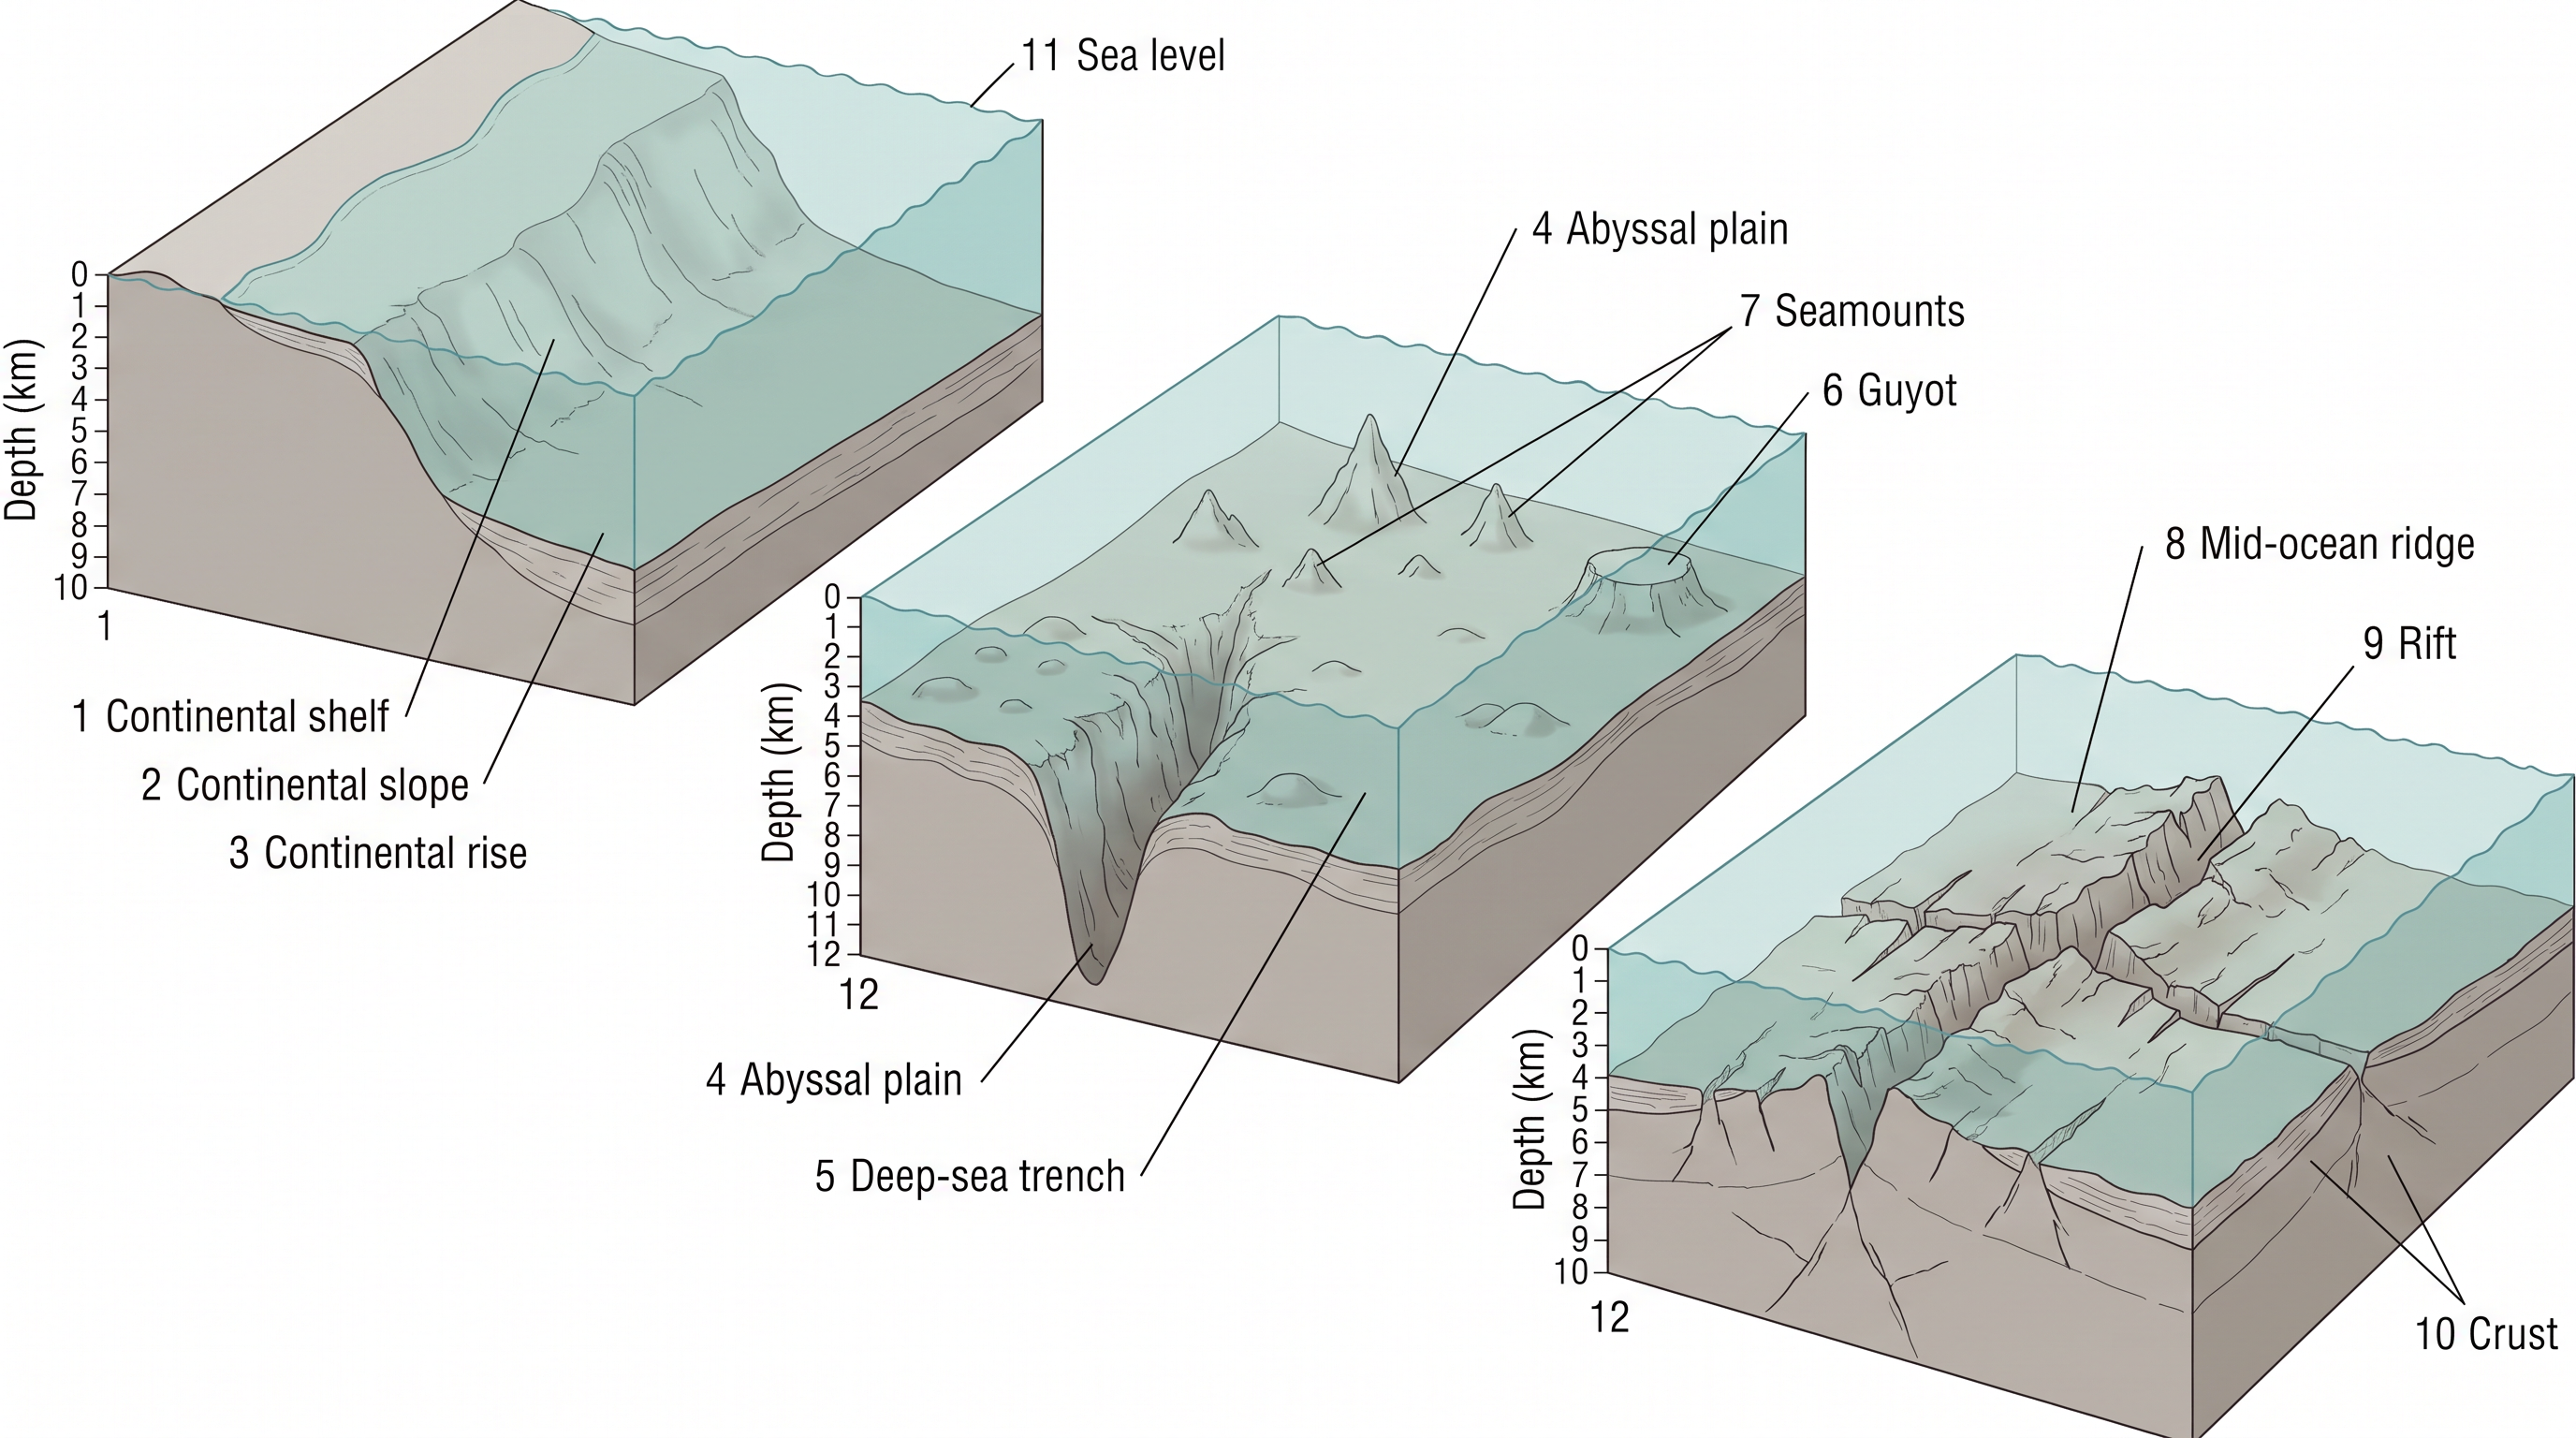
Fig. 12.3 – Relief of the ocean floor.
12.2.1 Divisions Of The Ocean Floors
The ocean floor divides into four major parts, running from the coast outward and downward: the continental shelf, the continental slope, the deep sea plain, and the oceanic deeps. Across and between these lie a set of smaller relief features — ridges, hills, seamounts, guyots, trenches and canyons. Fig. 12.4 sorts them all into one picture.
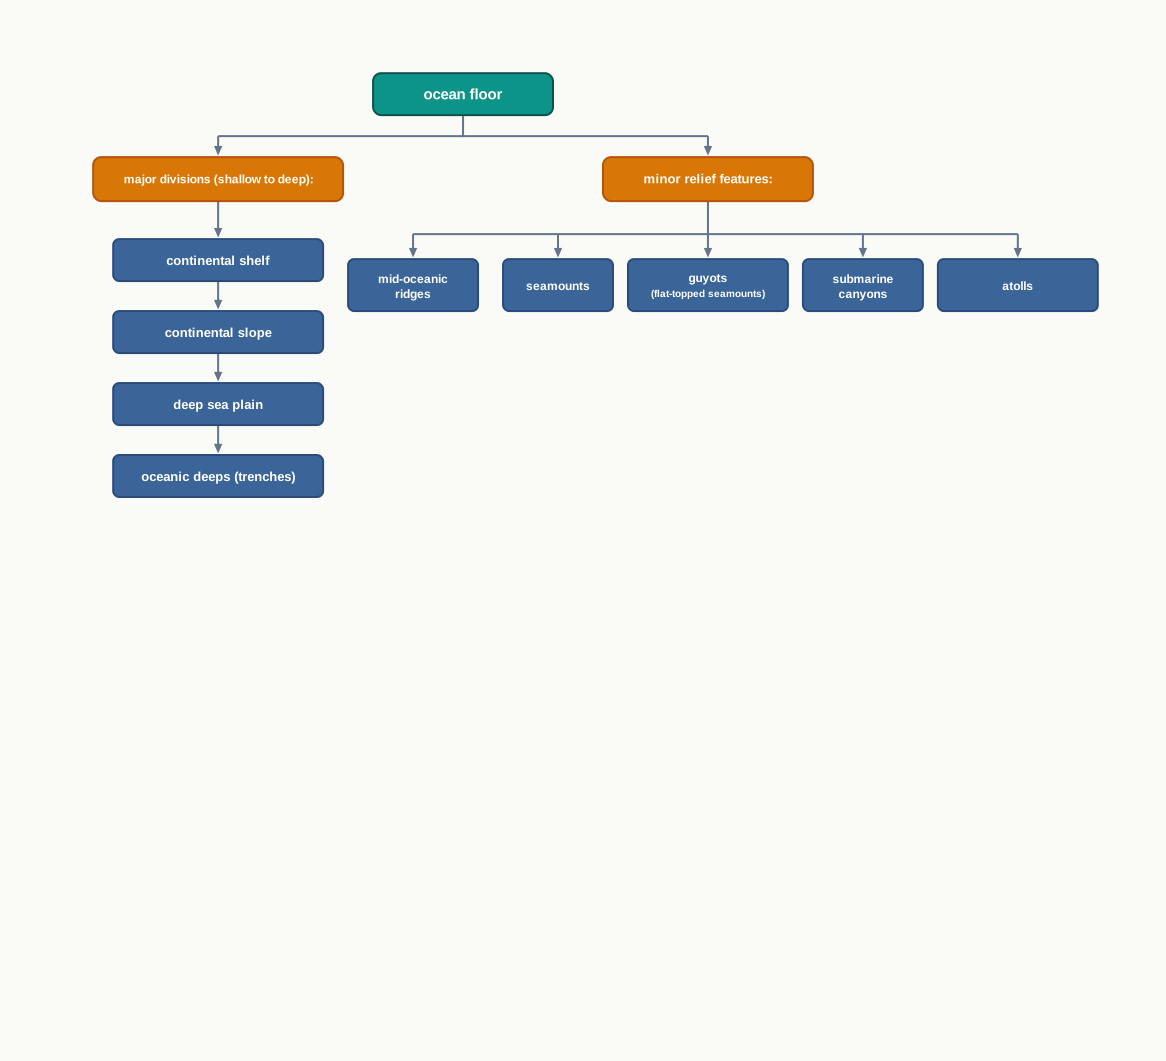
Fig. 12.4 – Divisions and features of the ocean floor.
12.2.1.1 Continental Shelf
The continental shelf is the extended, gently sloping edge of a continent, drowned under relatively shallow seas and gulfs. It is the shallowest part of the ocean, with an average gradient of just 1° or even less — almost flat. The shelf ends abruptly at a much steeper drop called the shelf break, which marks where the true ocean depths begin.
The width of the shelf varies greatly from one ocean to another; on average it is about 80 km across. Along some coasts it is almost absent or very narrow — for example off the coast of Chile, on the western edge of South America, and off the west coast of Sumatra in Indonesia. Elsewhere it is enormous: the Siberian shelf in the Arctic Ocean, off northern Russia, is the widest in the world and stretches 1,500 km out from the shore. Its depth ranges too, from as little as 30 m in some places to as much as 600 m in others.
The shelves are blanketed with sediment — mud, sand and silt brought down by rivers, glaciers and wind from the land, then spread out by waves and currents. Over a very long time these massive deposits become the source of fossil fuels such as oil and gas. Together the shelf and the slope beyond it form the continental margin, the submerged rim of the continent shown in Fig. 12.3, which also labels the gentler continental rise where the margin meets the deep floor.
12.2.1.2 Continental Slope
The continental slope connects the shelf to the deep ocean basins. It begins at the shelf break, where the floor drops away steeply, and it falls at a gradient of 2° to 5° — far steeper than the shelf. Its depth runs from about 200 m down to 3,000 m. The lower edge of the slope marks the real boundary of the continent, and deep canyons and trenches are often found cut into this region.
12.2.1.3 Deep Sea Plain
The deep sea plains are the gently sloping floors of the ocean basins beyond the slope. They are the flattest and smoothest regions on the whole planet, lying at depths between 3,000 and 6,000 m. Their smoothness comes from a covering of very fine sediment — clay and silt — that settles slowly out of the still, deep water and drapes the floor evenly.
12.2.1.4 Oceanic Deeps Or Trenches
The oceanic deeps, or trenches, are the deepest parts of the oceans. They are relatively narrow, steep-sided basins that plunge some 3 to 5 km below the surrounding ocean floor. Trenches are found at the foot of continental slopes and along island arcs — curved chains of islands — and they go hand in hand with active volcanoes and strong earthquakes.
This close company with earthquakes and eruptions is exactly why trenches matter so much in the study of plate movements. So far 57 deeps have been explored: 32 in the Pacific Ocean, 19 in the Atlantic and 6 in the Indian — which add up to 57, with more than half of them lying in the Pacific alone.
12.2.2 Minor Relief Features
Beyond the four major divisions, a number of smaller but important features rise from and cut into the ocean floor in different parts of the world.
12.2.2.1 Mid-Oceanic Ridges
A mid-oceanic ridge is a great submarine mountain system made of two parallel chains of mountains separated by a large central depression. Its peaks can rise as high as 2,500 m, and a few break the ocean’s surface as islands. Iceland, which sits on the mid-Atlantic Ridge in the North Atlantic, is one such peak risen above the waves.
12.2.2.2 Seamount
A seamount is a mountain with a pointed summit that rises from the seafloor but does not reach the surface. Seamounts are volcanic in origin — built by lava erupted onto the ocean floor — and can stand 3,000 to 4,500 m tall. The Emperor seamount, an underwater extension of the Hawaiian Islands in the Pacific Ocean, is a good example.
12.2.2.3 Submarine Canyons
Submarine canyons are deep valleys carved into the ocean floor, some as grand as the Grand Canyon cut by the Colorado river in North America. They are found slicing across the continental shelves and slopes, and often run out from the mouths of large rivers. The Hudson Canyon, off the eastern coast of North America at the mouth of the Hudson river, is the best known in the world.
12.2.2.4 Guyots
A guyot is a flat-topped seamount. Its level top is the record of a slow sinking: as the seamount gradually subsided, its summit was planed off, and stage by stage it became a flat-topped, submerged mountain. More than 10,000 seamounts and guyots are thought to exist in the Pacific Ocean alone.
12.2.2.5 Atoll
An atoll is a low island of the tropical oceans, made of coral reefs that ring a central depression. The water it encloses may be an arm of the sea — a lagoon — or it may be shut off as a separate body of fresh, brackish or highly saline water.
12.3 Temperature Of Ocean Waters
Like the land, the oceans are heated by the Sun. This section looks at how their temperature varies — from place to place across the surface, and from the surface downward into the deep. One difference from land runs through everything that follows: the ocean heats up and cools down more slowly than the land does, so its temperature changes are gentler and more gradual.
12.3.1 Factors Affecting Temperature Distribution
Four main factors decide how warm the surface water of an ocean is at any given place.
The first is latitude. The temperature of surface water falls steadily from the equator toward the poles, because the amount of insolation — the incoming solar radiation received at the surface — decreases as you move poleward. Near the equator the Sun’s rays strike almost straight down and heat the water strongly; near the poles they arrive at a low, glancing angle and spread the same energy over a wider area, so they heat it far less.
The second is the unequal distribution of land and water. The oceans of the northern hemisphere are in contact with a larger extent of land than those of the southern hemisphere, and so they receive more heat. This is why, taken as a whole, the northern oceans run warmer than the southern ones.
The third is the prevailing wind. Winds blowing from the land out to sea push the warm surface water away from the coast; colder water then rises from below to take its place, an effect called upwelling, which cools the coastal water and creates variation in temperature along a line of longitude. Where the winds instead blow onshore, they pile warm water up against the coast and raise its temperature.
The fourth factor is ocean currents — large, steady flows of ocean water that carry their temperature with them. A warm current raises the temperature of the cold area it reaches, while a cold current lowers the temperature of a warm area. The Gulf Stream, a warm current, raises temperatures along the eastern coast of North America and the west coast of Europe; the Labrador current, a cold current, lowers them along the north-east coast of North America.
Together these factors shape local temperatures. One clear result concerns enclosed seas — seas largely shut in by land, with little exchange with the open ocean. In the low latitudes such seas record higher temperatures than the open sea; in the high latitudes they record lower temperatures than the open sea.
12.3.2 Horizontal And Vertical Distribution Of Temperature
The Thermocline
If you lowered a thermometer through the ocean, the temperature would not fall evenly. The temperature–depth profile shows a boundary region between the warm surface water and the cold deep water below. This boundary usually begins somewhere between 100 and 400 m below the surface and extends several hundred metres further down. It is a zone of rapid temperature drop, and it is called the thermocline. Below it lies the great cold mass of the deep ocean — about 90 per cent of all ocean water by volume — where temperatures approach 0°C. Fig. 12.5 draws this profile.
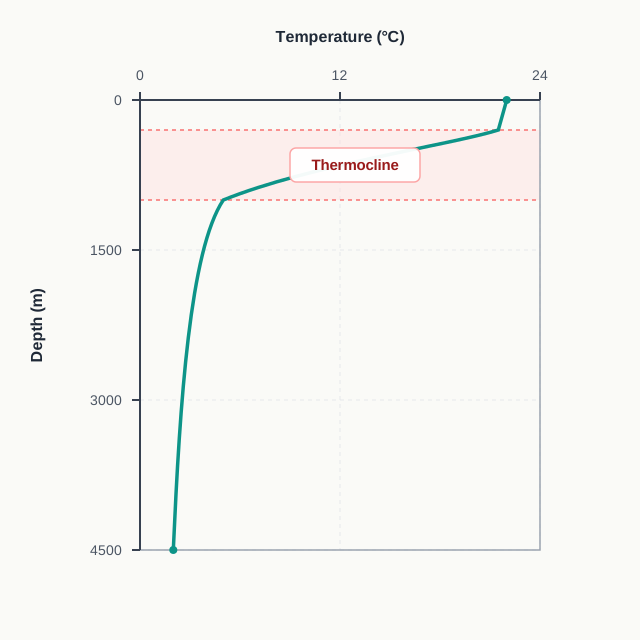
Fig. 12.5 – Ocean temperature profile with depth.
A Three-Layer Ocean
Over the middle and low latitudes, the ocean can be described as three layers stacked from surface to floor. The first layer is the warm top layer, about 500 m thick, with temperatures between 20° and 25°C; within the tropics it is present all year, but in the mid latitudes it forms only during summer. The second layer is the thermocline itself, where temperature falls rapidly with depth; it is 500 to 1,000 m thick. The third layer is very cold and reaches all the way down to the deep ocean floor.
The far north and far south break this pattern. In the Arctic and Antarctic the surface water is already close to 0°C, so there is barely any change with depth — just a single cold layer running from the surface to the bottom.
Warmest At The Surface
Across the whole ocean, the average surface temperature is about 27°C, falling gradually toward the poles at a rate of roughly 0.5°C for each degree of latitude. On average it is around 22°C at 20° latitude, 14°C at 40° latitude, and 0°C near the poles. Read across these figures and the message is plain: latitude does most of the work in setting surface temperature, and 0.5°C per degree is a useful rule of thumb, even if the exact averages vary a little around it.
The northern hemisphere records higher temperatures than the southern, and the very highest temperatures are found not exactly at the equator but slightly to the north of it. The average annual surface temperatures work out at around 19°C for the northern hemisphere and 16°C for the southern — a gap that again traces back to the unequal spread of land and water between the two. Fig. 12.6 maps this surface pattern for the whole world.
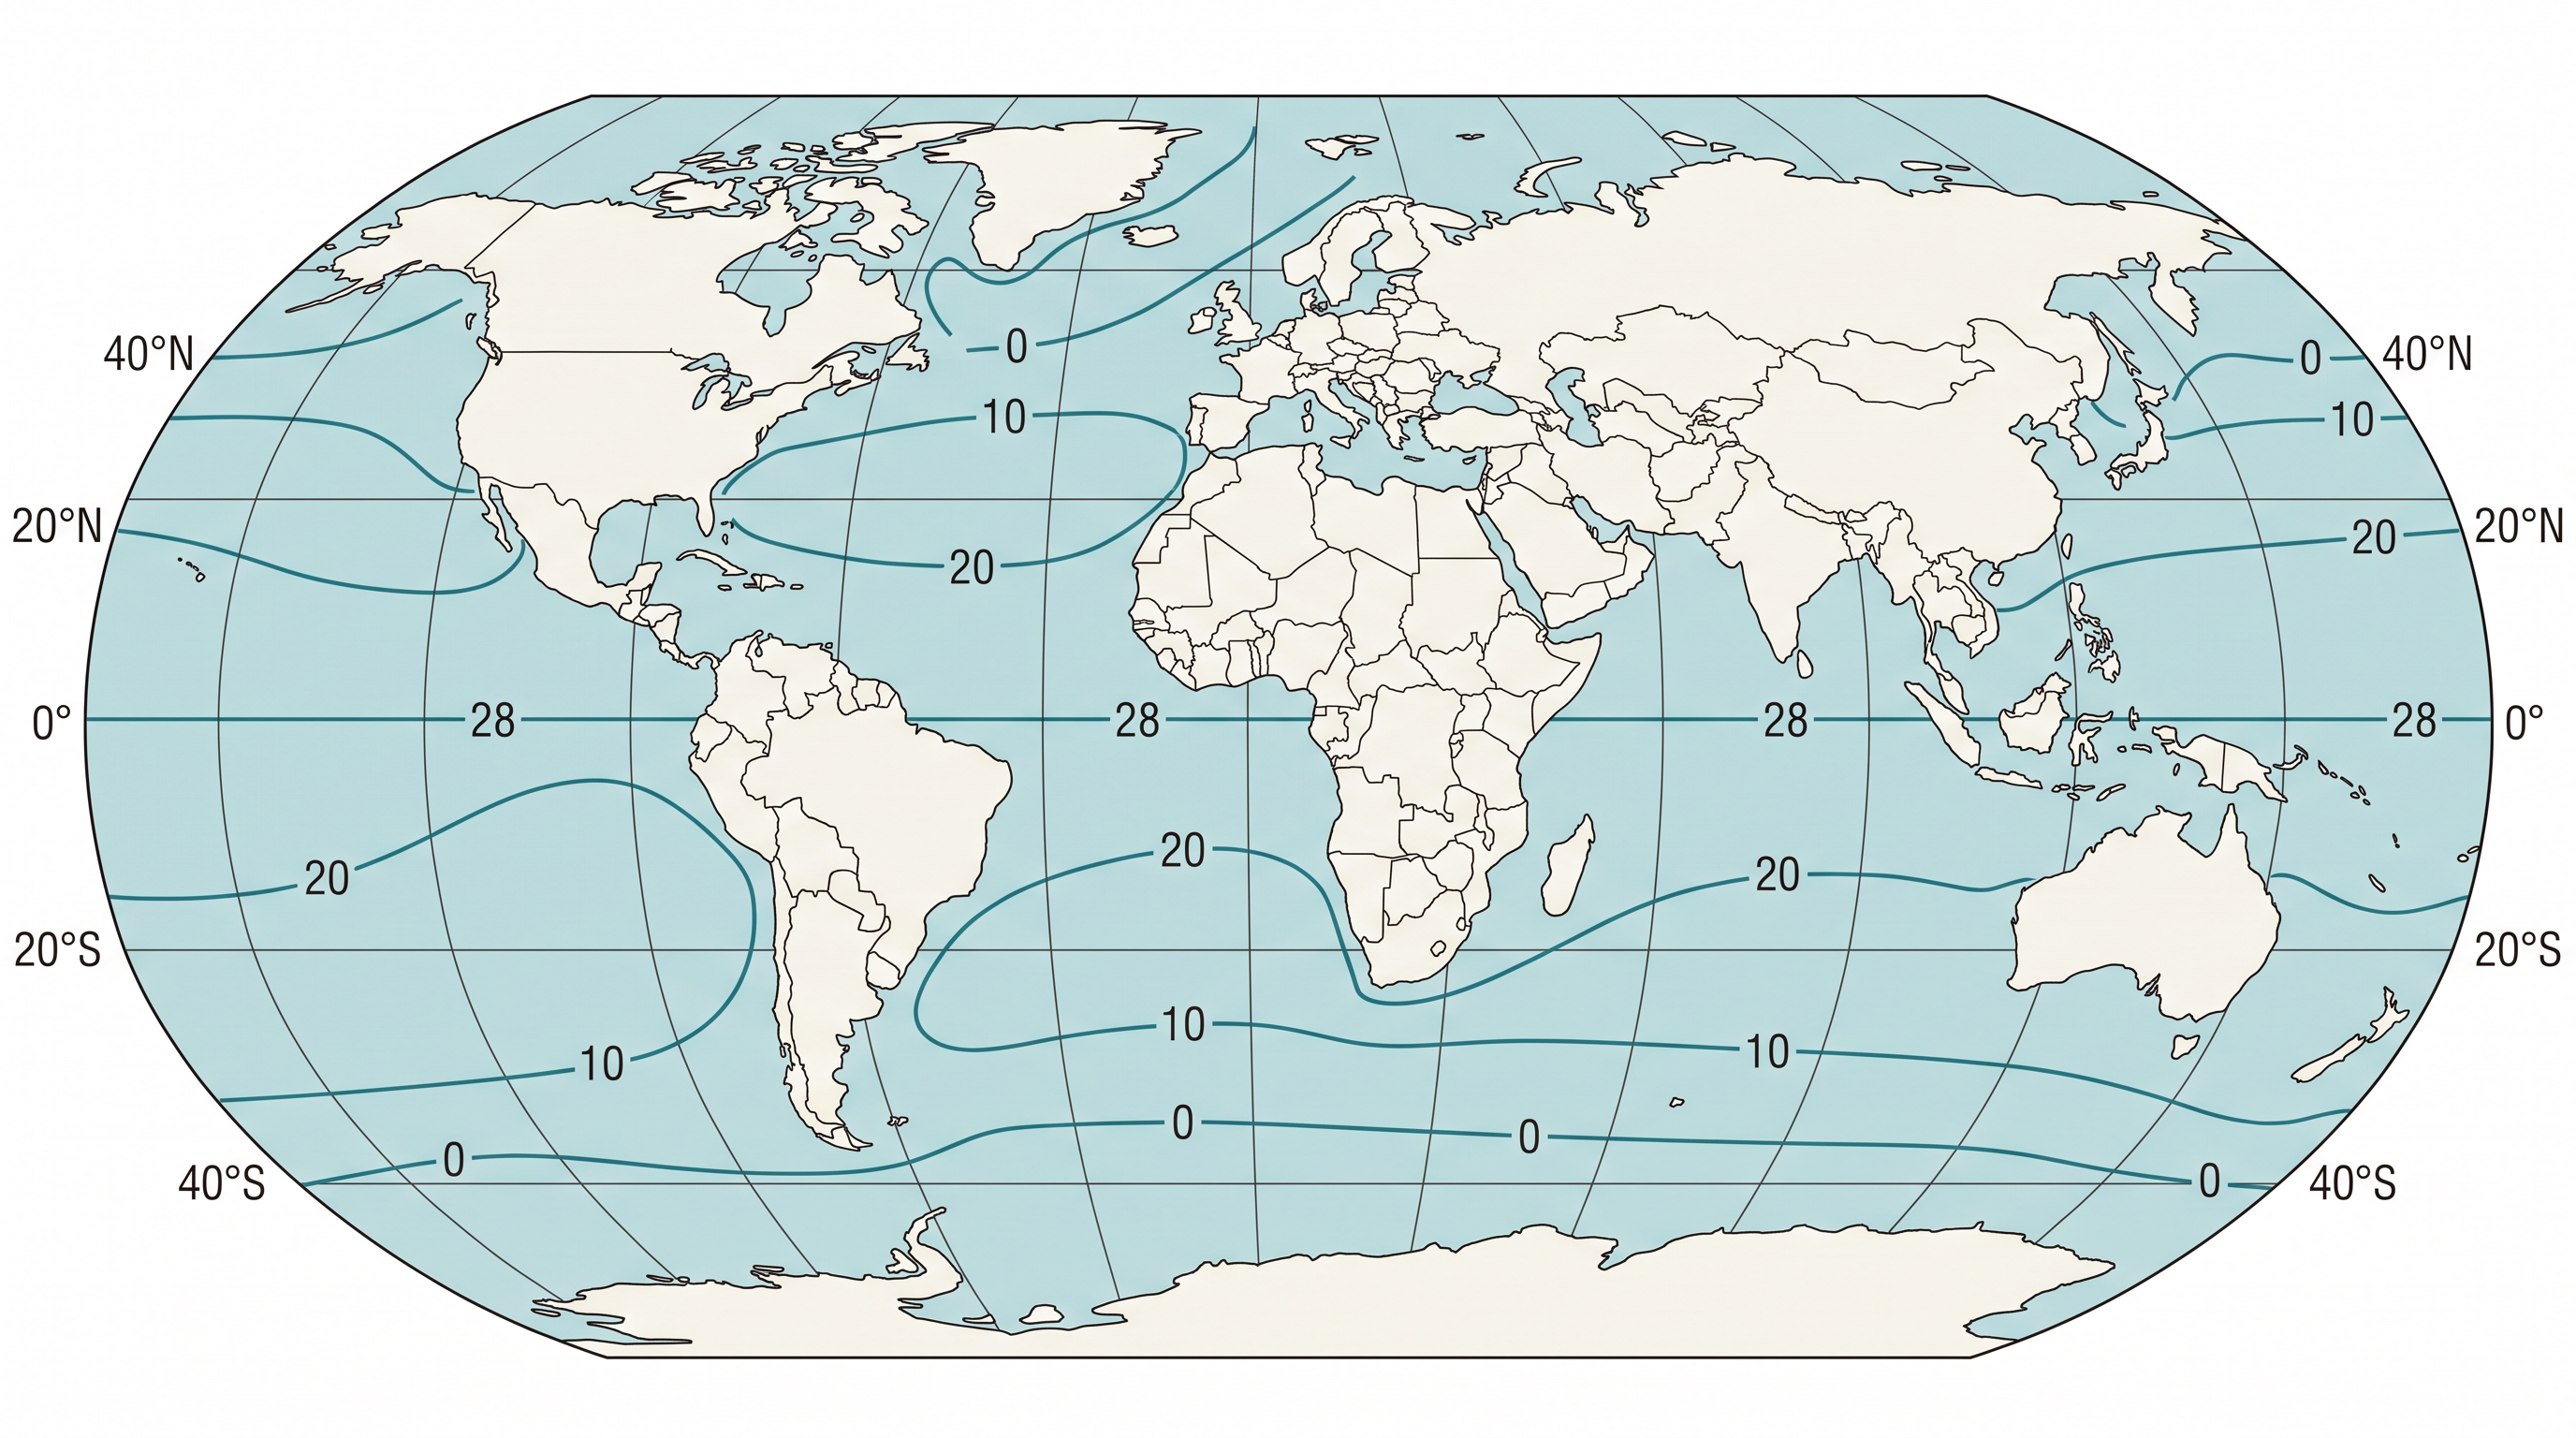
Fig. 12.6 – World map of ocean surface temperature.
The ocean is always warmest at its very surface, because it is the surface that receives the Sun’s heat directly. That heat is then carried downward by convection — the slow overturning that moves warmth from the top toward the lower layers — which is why temperature decreases with depth. But the fall is not uniform: temperature drops very rapidly down to about 200 m, and below that the rate of decrease slows considerably.
12.4 Salinity Of Ocean Waters
All waters in nature — rainwater and ocean water alike — carry dissolved mineral salts. Salinity is the term for the total content of dissolved salts in sea water, and it is one of the most important properties of the ocean.
Salinity is measured as the amount of salt, in grams, dissolved in 1,000 g (1 kg) of seawater, and it is expressed in parts per thousand — written ‰ and also called ppt.
\[\text{Salinity} = \frac{\text{mass of dissolved salt}}{\text{mass of seawater}} \times 1000 \quad (\text{in parts per thousand, ‰})\]
Here the mass of dissolved salt and the mass of seawater are both taken in grams, and the result is the grams of salt present in every 1,000 g of water. A salinity of 24.7 ‰ has been taken as the upper limit for brackish water — water that is saltier than fresh but less salty than the open sea. At the far extreme lie a few inland water bodies where water evaporates freely but little of it escapes, so salt piles up to remarkable levels: Lake Van in eastern Turkey (330 ‰), the Dead Sea, an inland salt lake in south-west Asia (238 ‰), and the Great Salt Lake in the western United States (220 ‰).
What Controls Salinity
Four factors govern how salty the water of a place becomes. First, the salinity of the surface layer depends mainly on the balance between evaporation, which removes fresh water and leaves salt behind, and precipitation, which adds fresh water. Second, in coastal regions the fresh water flowing in from rivers lowers salinity, while in polar regions the freezing and thawing of ice raises or lowers it. Third, wind influences salinity by carrying surface water away to other areas. Fourth, ocean currents contribute to salinity variations, because salinity, temperature and density are interrelated: any change in temperature or density feeds through into the salinity of an area.
12.4.1 Horizontal Distribution Of Salinity
For the normal open ocean, salinity ranges between 33 ‰ and 37 ‰. Away from the open ocean the figure swings much more widely. In the landlocked Red Sea, a narrow sea between Africa and Arabia where evaporation is intense, it climbs as high as 41 ‰. In estuaries — the mouths where rivers meet the sea and fresh and salt water mix — and in the Arctic, it swings seasonally anywhere from 0 to 35 ‰. And in hot, dry regions where evaporation runs unchecked, salinity sometimes reaches 70 ‰.
Each ocean has its own pattern. In the Pacific Ocean the variation follows mainly from its shape and its huge areal extent: salinity falls from 35 ‰ to 31 ‰ across the western parts of the northern hemisphere, because meltwater flows in from the Arctic and dilutes it; and beyond about 15° to 20° south, it drops to 33 ‰. In the Atlantic Ocean the average is around 36 ‰, with the highest values recorded between 15° and 20° latitude; the maximum, 37 ‰, is observed between 20°N and 30°N and between 20°W and 60°W, and it decreases gradually toward the north.
The enclosed and marginal seas make the point sharply. The North Sea lies in higher latitudes yet records high salinity, because the North Atlantic Drift — a current that carries warm, saline water into the region — feeds it. The Baltic Sea, by contrast, is low in salinity because rivers pour fresh water into it in large quantity. The Mediterranean Sea records high salinity, driven by strong evaporation, while the Black Sea is very low, swamped by enormous freshwater inflow from the rivers that feed it (you can trace those rivers in your atlas).
The same story runs through the Indian Ocean, whose average salinity is 35 ‰. The Bay of Bengal, on India’s eastern side, shows a low-salinity trend because great rivers empty into it; the Arabian Sea, on India’s western side, shows higher salinity because evaporation is strong and little fresh water comes in. Two seas of the same ocean, at much the same latitude, end up markedly different in saltiness. Fig. 12.7 maps salinity for the world’s oceans.
Thirty-five grams in a kilogram sounds small, but it is a fixed, weighable load that the water carries wherever it goes. It also explains the whole horizontal pattern above: salinity climbs wherever water leaves but salt stays behind. As evaporation removes pure water and few rivers replace it, the same salt is packed into less and less water, and the figure rises — gently across the open ocean, and steeply in a shut-in, sun-baked basin like the Red Sea.
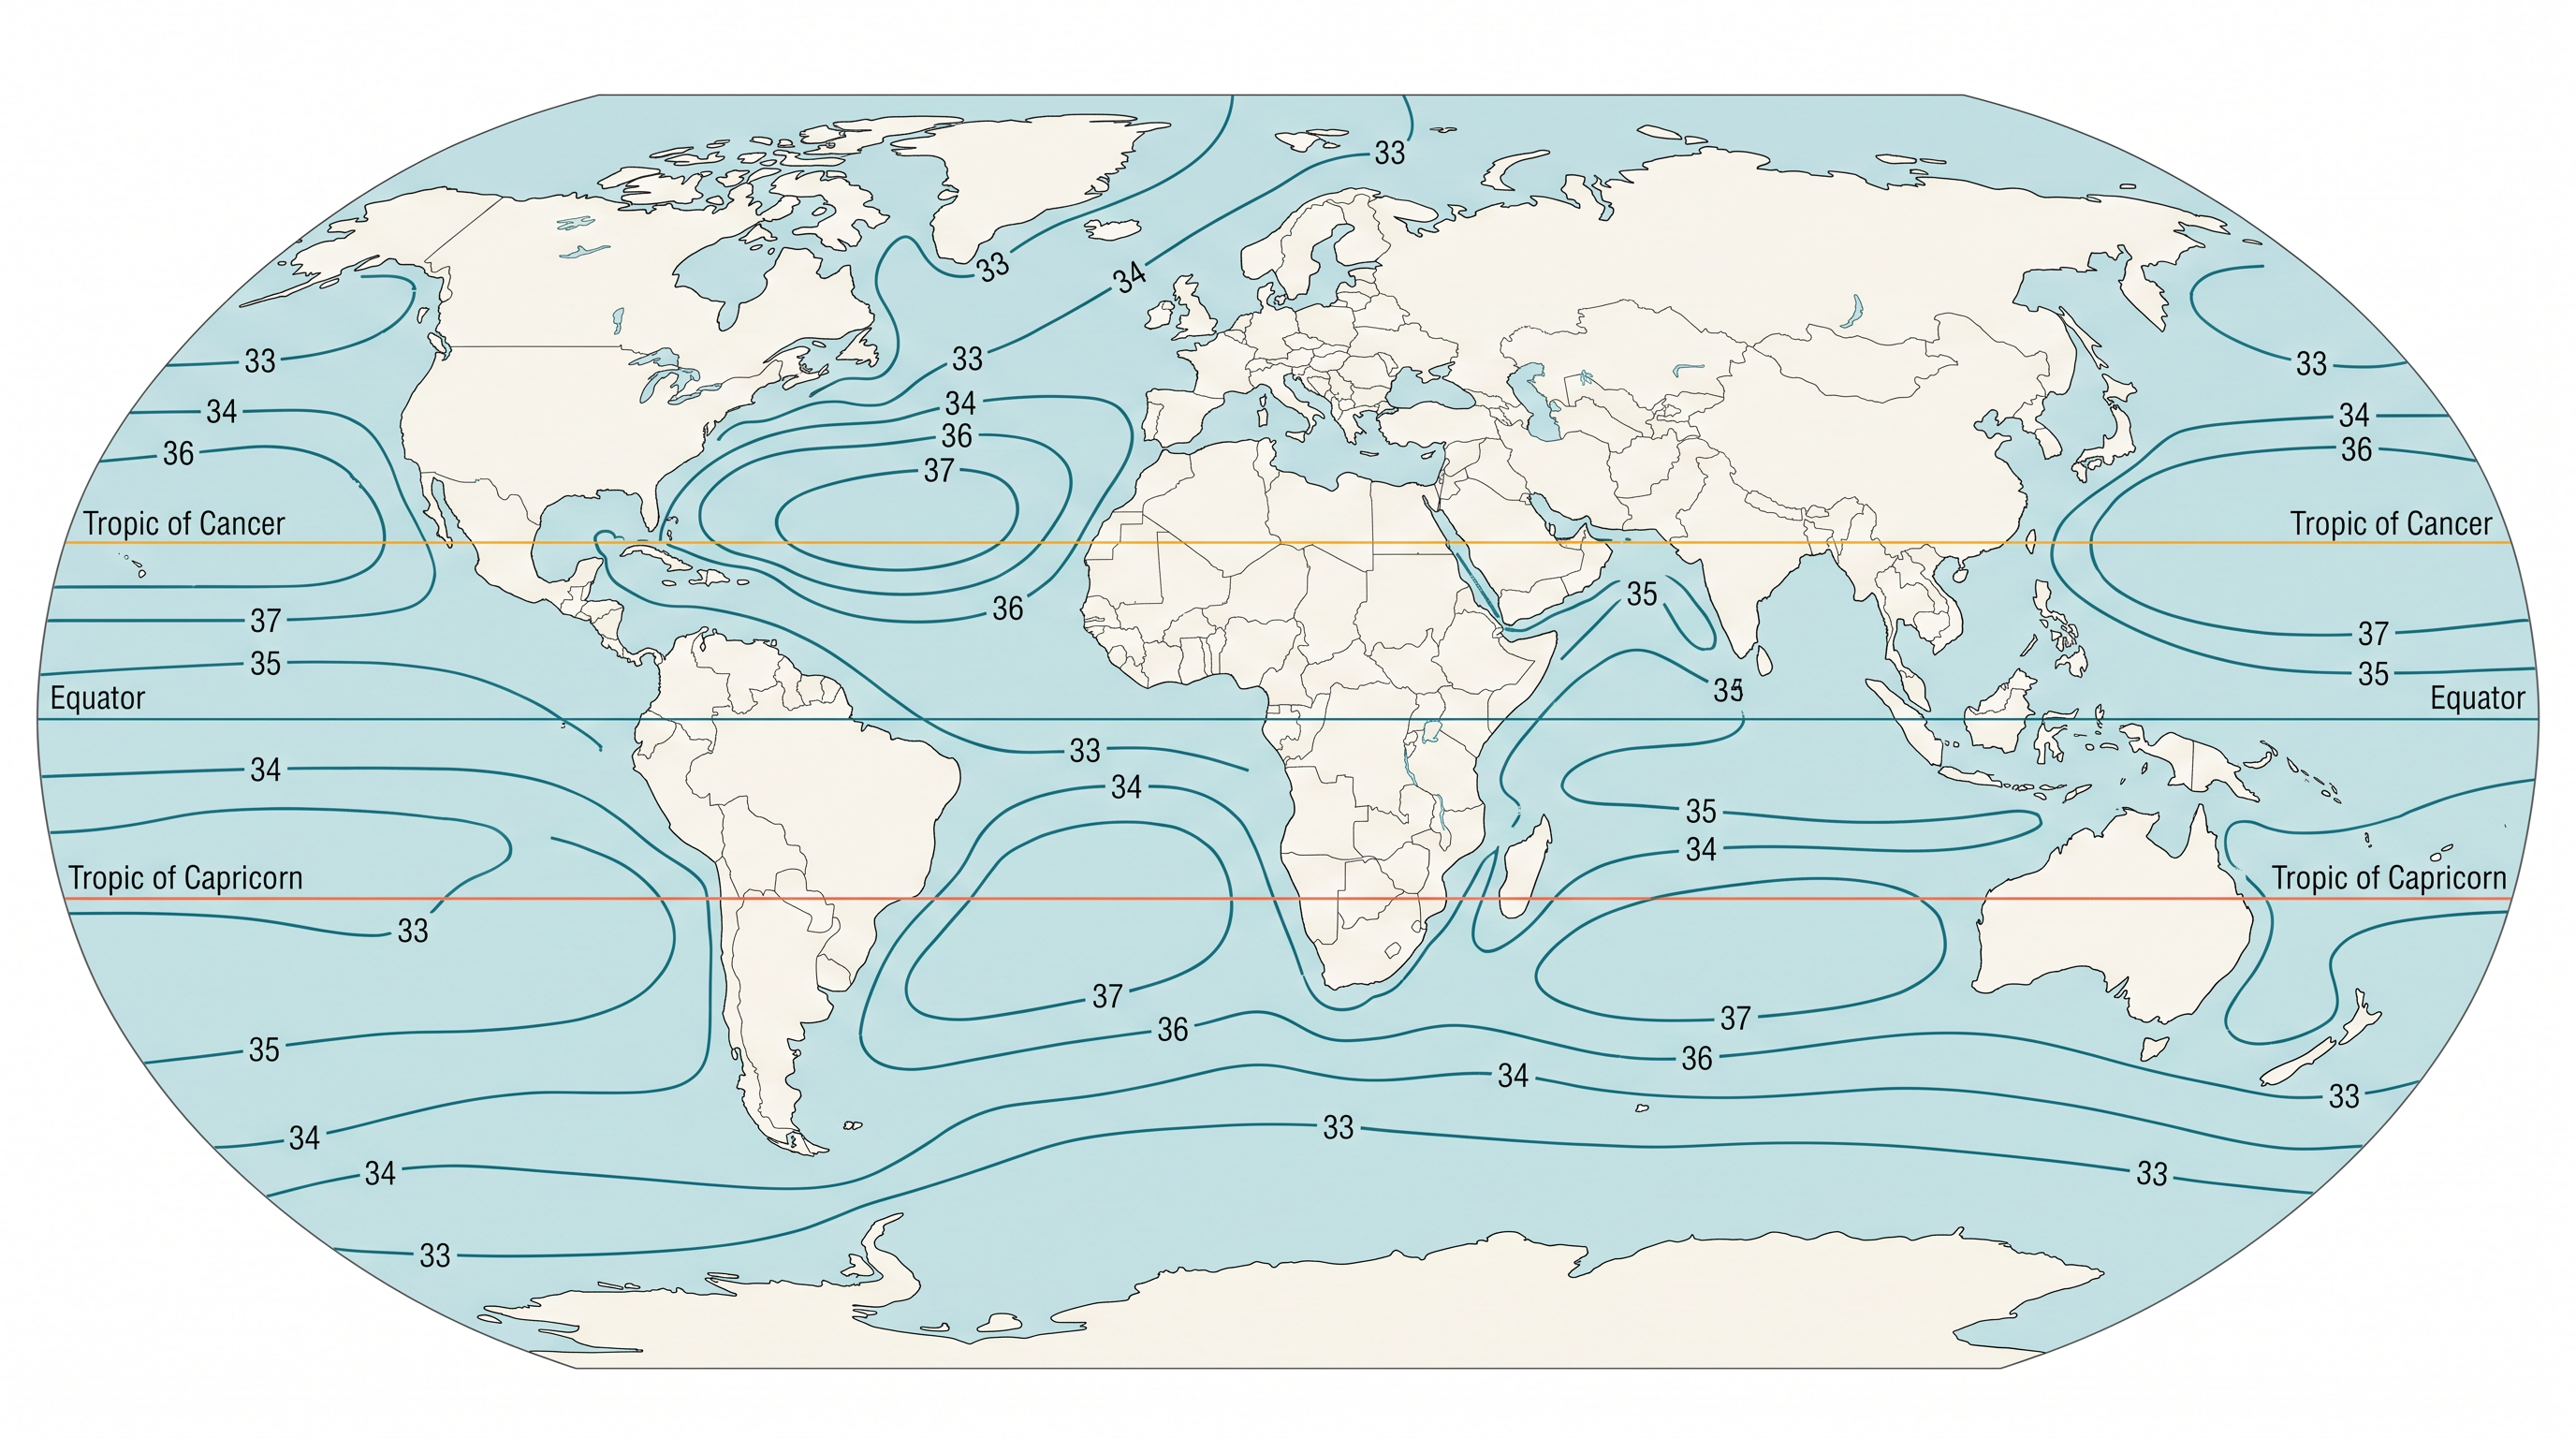
Fig. 12.7 – World map of ocean surface salinity.
12.4.2 Vertical Distribution Of Salinity
Salinity also changes with depth, but the way it changes depends on where in the ocean you are. At the surface, salinity is raised when water is lost to ice or to evaporation, and lowered when fresh water is added, as from rivers. Deeper down, salinity is very nearly fixed, because there is no way for water to be ‘lost’ or for salt to be ‘added’ — so there is a marked difference between the salinity of the surface zones and that of the deep zones.
The reason the layers hold their order lies in density. The lower-salinity water rests above the higher-salinity, denser water. In general salinity increases with depth, and there is a distinct zone, called the halocline, where it increases sharply. Other things being equal, more salt means more density, so high-salinity seawater tends to sink below lower-salinity water. The result is a stable stacking of the ocean into layers — a stratification by salinity.
12.5 Summary
- Earth is the ‘Blue Planet’: water is abundant on its surface and essential to all life, and it is a cyclic resource, used and used again.
- The hydrological cycle is the endless circulation of water through the hydrosphere in liquid, solid and gaseous forms — driven by evaporation, condensation, precipitation, runoff and infiltration — and it has run for billions of years.
- About 91 per cent of the planet’s water is salt water in the oceans; only a small freshwater share is held in glaciers, groundwater, lakes, soil, the air and living things. Of the water that falls on land, nearly 59 per cent returns to the air by evaporation.
- The renewable water on Earth is fixed while demand keeps rising, so water crises appear across both space and time, made sharper by the pollution of rivers.
- The oceanic part of the Earth is divided into five oceans; the ocean floor lies mostly 3–6 km deep and is as varied as the land, built by tectonic, volcanic and depositional processes.
- The floor has four major divisions: the shallow continental shelf (gradient about 1°, ending at the shelf break), the steeper continental slope (2° to 5°), the flat deep sea plain (3,000–6,000 m), and the oceanic deeps or trenches, the deepest parts of all and closely tied to earthquakes and volcanoes.
- Its minor features include mid-oceanic ridges, volcanic seamounts, flat-topped guyots, submarine canyons and coral atolls.
- Ocean surface temperature is set by latitude (through insolation), the unequal spread of land and water, prevailing winds (which cause upwelling), and ocean currents.
- The average surface temperature is about 27°C, falling toward the poles at roughly 0.5°C for each degree of latitude, with the northern hemisphere running warmer than the southern.
- With depth the ocean is layered: a warm surface layer, a rapidly cooling thermocline, and a vast cold deep layer near 0°C; temperature falls fastest in the top 200 m.
- Salinity is the dissolved-salt content of seawater, measured in grams per 1,000 g of water (parts per thousand); 24.7 ‰ marks the upper limit of brackish water.
- Salinity is controlled by evaporation and precipitation, river inflow, the freezing and thawing of ice, wind and currents; the open ocean runs 33–37 ‰, with far higher extremes in enclosed, evaporating basins.
- Salinity rises with depth through the halocline; denser, saltier water sinks, stratifying the ocean into stable layers.
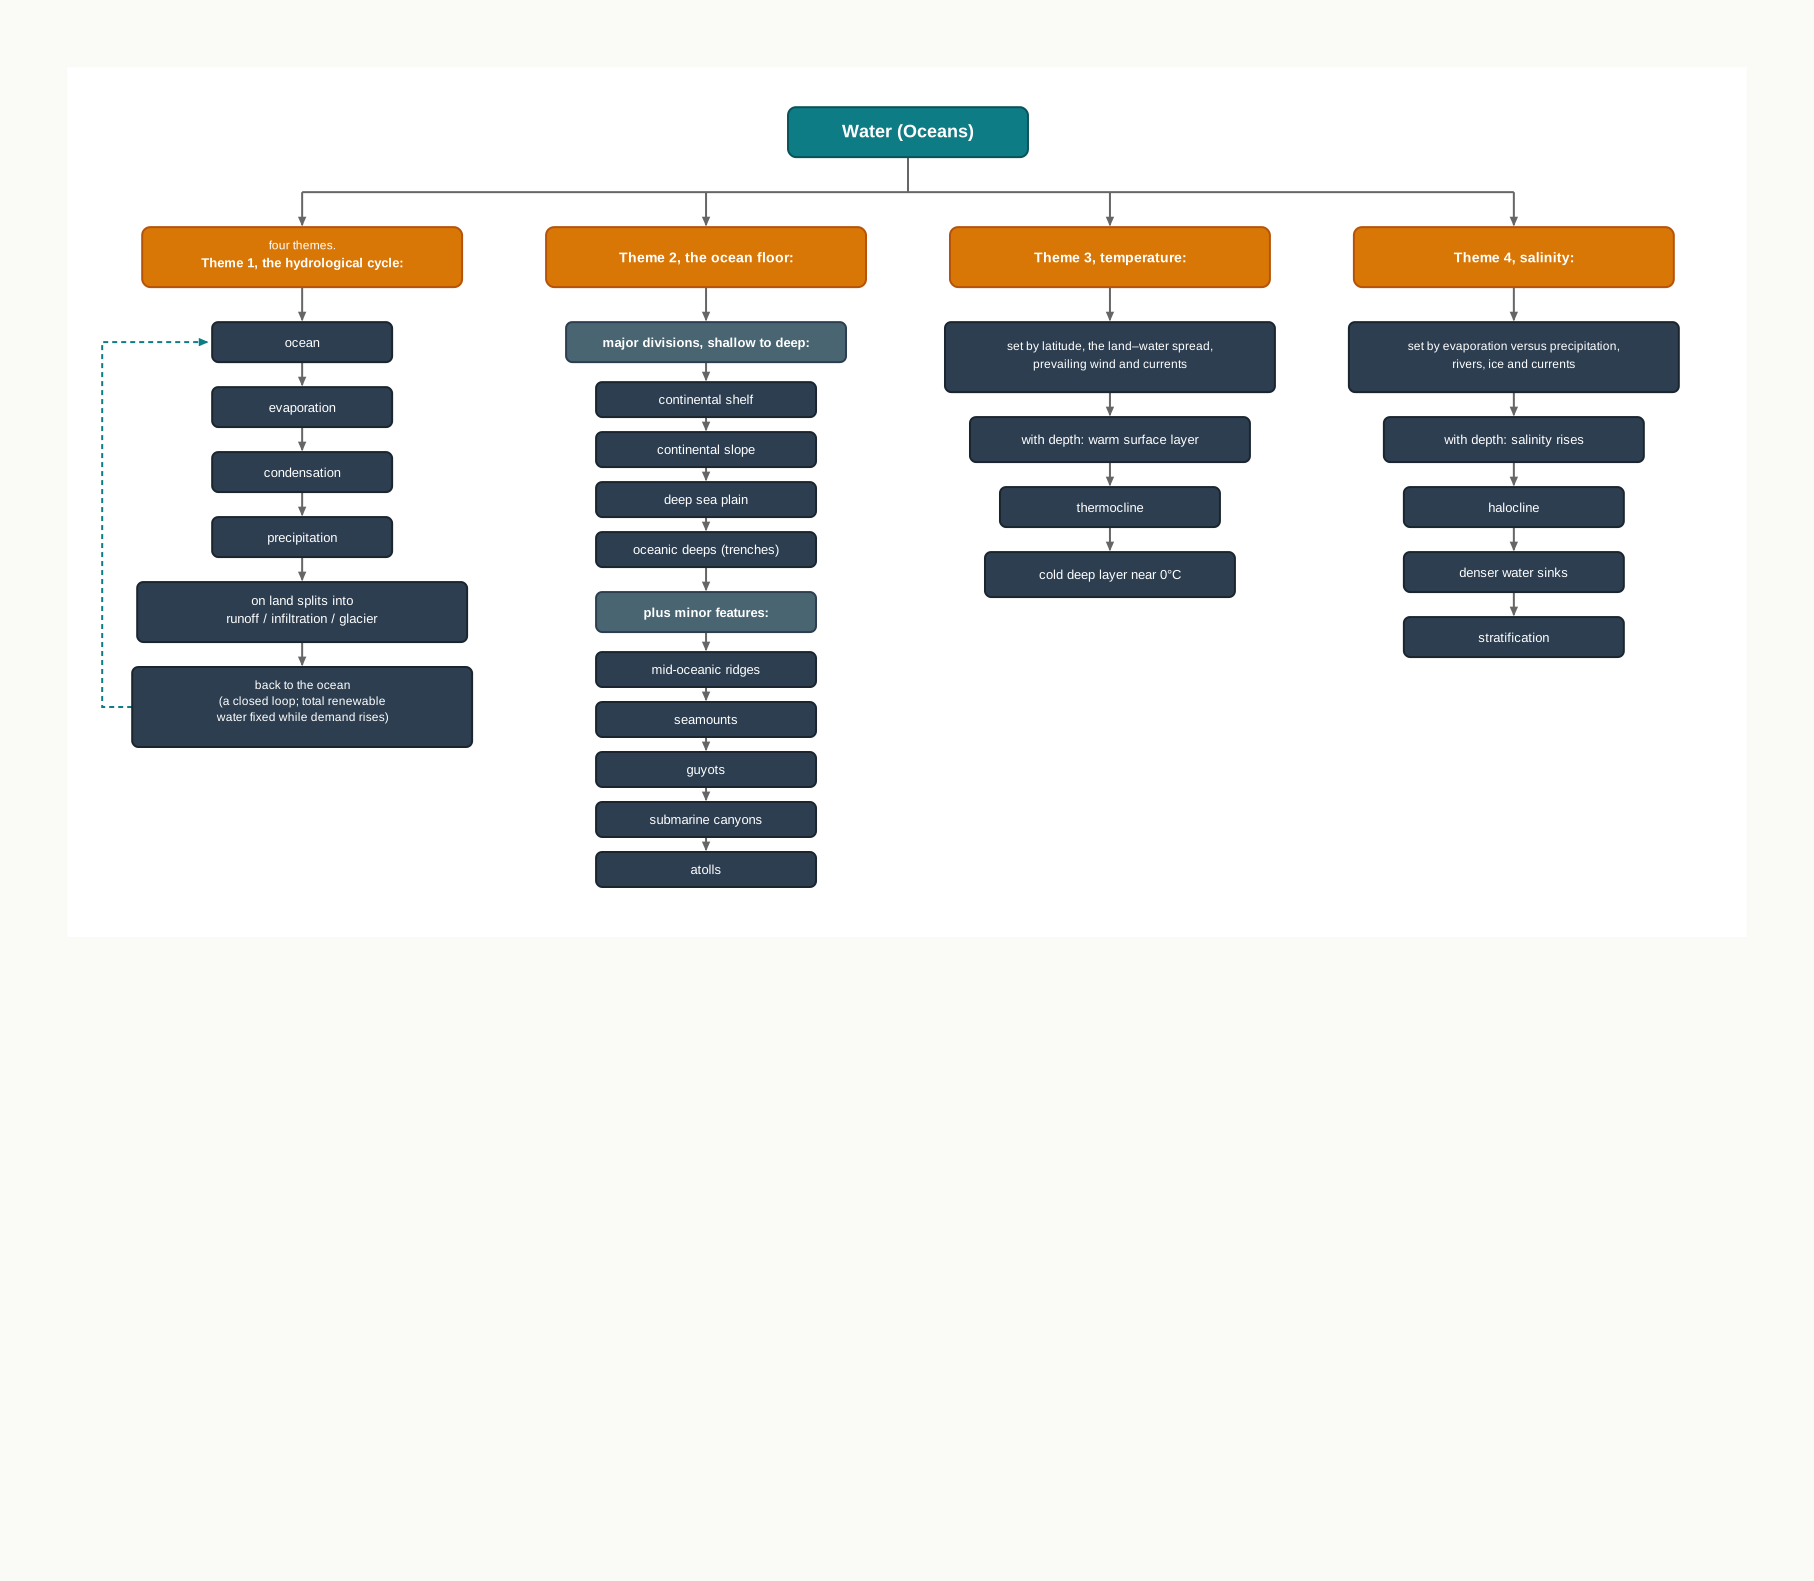
Fig. 12.8 – Chapter summary: water, ocean floor, temperature, and salinity.
What This Chapter Cannot Tell You
- A single ocean-wide average for temperature or salinity hides huge local variation — a river mouth, a season, or a passing current can change the real figure completely.
- The surface maps of temperature and salinity are smoothed, one-time snapshots; they say nothing about how deep the pattern reaches, or how it shifts from month to month.
- The chapter tells us where trenches, ridges and seamounts lie and that they go with earthquakes and volcanoes, but not the plate mechanism that makes them — that belongs to the study of plate movements, which this chapter only points toward.
12.6 NCERT Questions
Identify the element which is not a part of the hydrological cycle.
- Evaporation
- Hydration
- Precipitation
- Condensation
The average depth of continental slope varies between
- 2–20 m
- 200–2,000 m
- 20–200 m
- 2,000–20,000 m
Which one of the following is not a minor relief feature in the oceans?
- Seamount
- Atoll
- Oceanic Deep
- Guyot
Salinity is expressed as the amount of salt in grams dissolved in sea water per
- 10 gm
- 1,000 gm
- 100 gm
- 10,000 gm
Which one of the following is the smallest ocean?
- Indian Ocean
- Arctic Ocean
- Atlantic Ocean
- Pacific Ocean
Why do we call the earth a Blue Planet? (30 words)
What is a continental margin? (30 words)
List out the deepest trenches of various oceans. (30 words)
What is a thermocline? (30 words)
When you move into the ocean what thermal layers would you encounter? Why the temperature varies with depth? (30 words)
What is salinity of sea water? (30 words)
How are various elements of the hydrological cycle interrelated? (150 words)
Examine the factors that influence the temperature distribution of the oceans. (150 words)
12.7 Check Your Concepts
Using Fig. 12.3, arrange the four major divisions of the ocean floor — continental shelf, continental slope, deep sea plain and oceanic deeps — in order from the shallowest to the deepest.
Look at Table 12.1. Which process moves water out of the ‘water storage in ice and snow’ component, and into which part of the cycle does that water then go?
The continental shelf and the continental slope meet at the shelf break. Contrast the two in terms of their gradient and their depth range.
Salinity is the number of grams of salt dissolved in every 1,000 g of seawater. If the Indian Ocean has an average salinity of 35 ‰, how many grams of salt are dissolved in 2 kg of its water? Show every step of your working.
The Bay of Bengal and the Arabian Sea belong to the same ocean, yet differ in salinity. Explain why, naming the factor that is at work in each.
The highest ocean surface temperatures are found slightly to the north of the equator, not on the equator itself. Using what the chapter says about the two hemispheres, explain why.
Explain, step by step, why high-salinity water tends to sink below low-salinity water, and name the zone in which salinity increases sharply with depth.
Fig. 12.6 maps the surface temperature of the oceans. State one thing this map shows you clearly, and one important thing about the ocean’s temperature that it cannot tell you.