Chapter 5: Genome Technology and Engineering
During the Ebola outbreak in West Africa, a small team of scientists arrived with something that would have seemed impossible a generation earlier: DNA sequencers small enough to carry in hand luggage. There was no air-conditioned laboratory waiting for them, no room-sized machines, no months of shipping samples abroad. A blood sample from a patient could be processed locally, and within a day the team could read the genetic sequence of the virus in it.
That mattered enormously. By comparing the sequences from different patients, they could see how the virus was spreading from person to person, town to town, and whether it was changing as it moved. Public health teams could act on evidence rather than guesswork.
Now step back and think about what had to be invented before that suitcase could exist. Scientists first had to work out how to make a map of a genome when they could not yet read it. Then they had to learn to read DNA at all. Then to read it faster, cheaper, and millions of pieces at a time. And finally to read it with nothing more than a tiny hole in a membrane and a change in electric current.
Reading the genome, however, was only half the story. Once we could read it, the obvious next question arrived: could we also rewrite it?
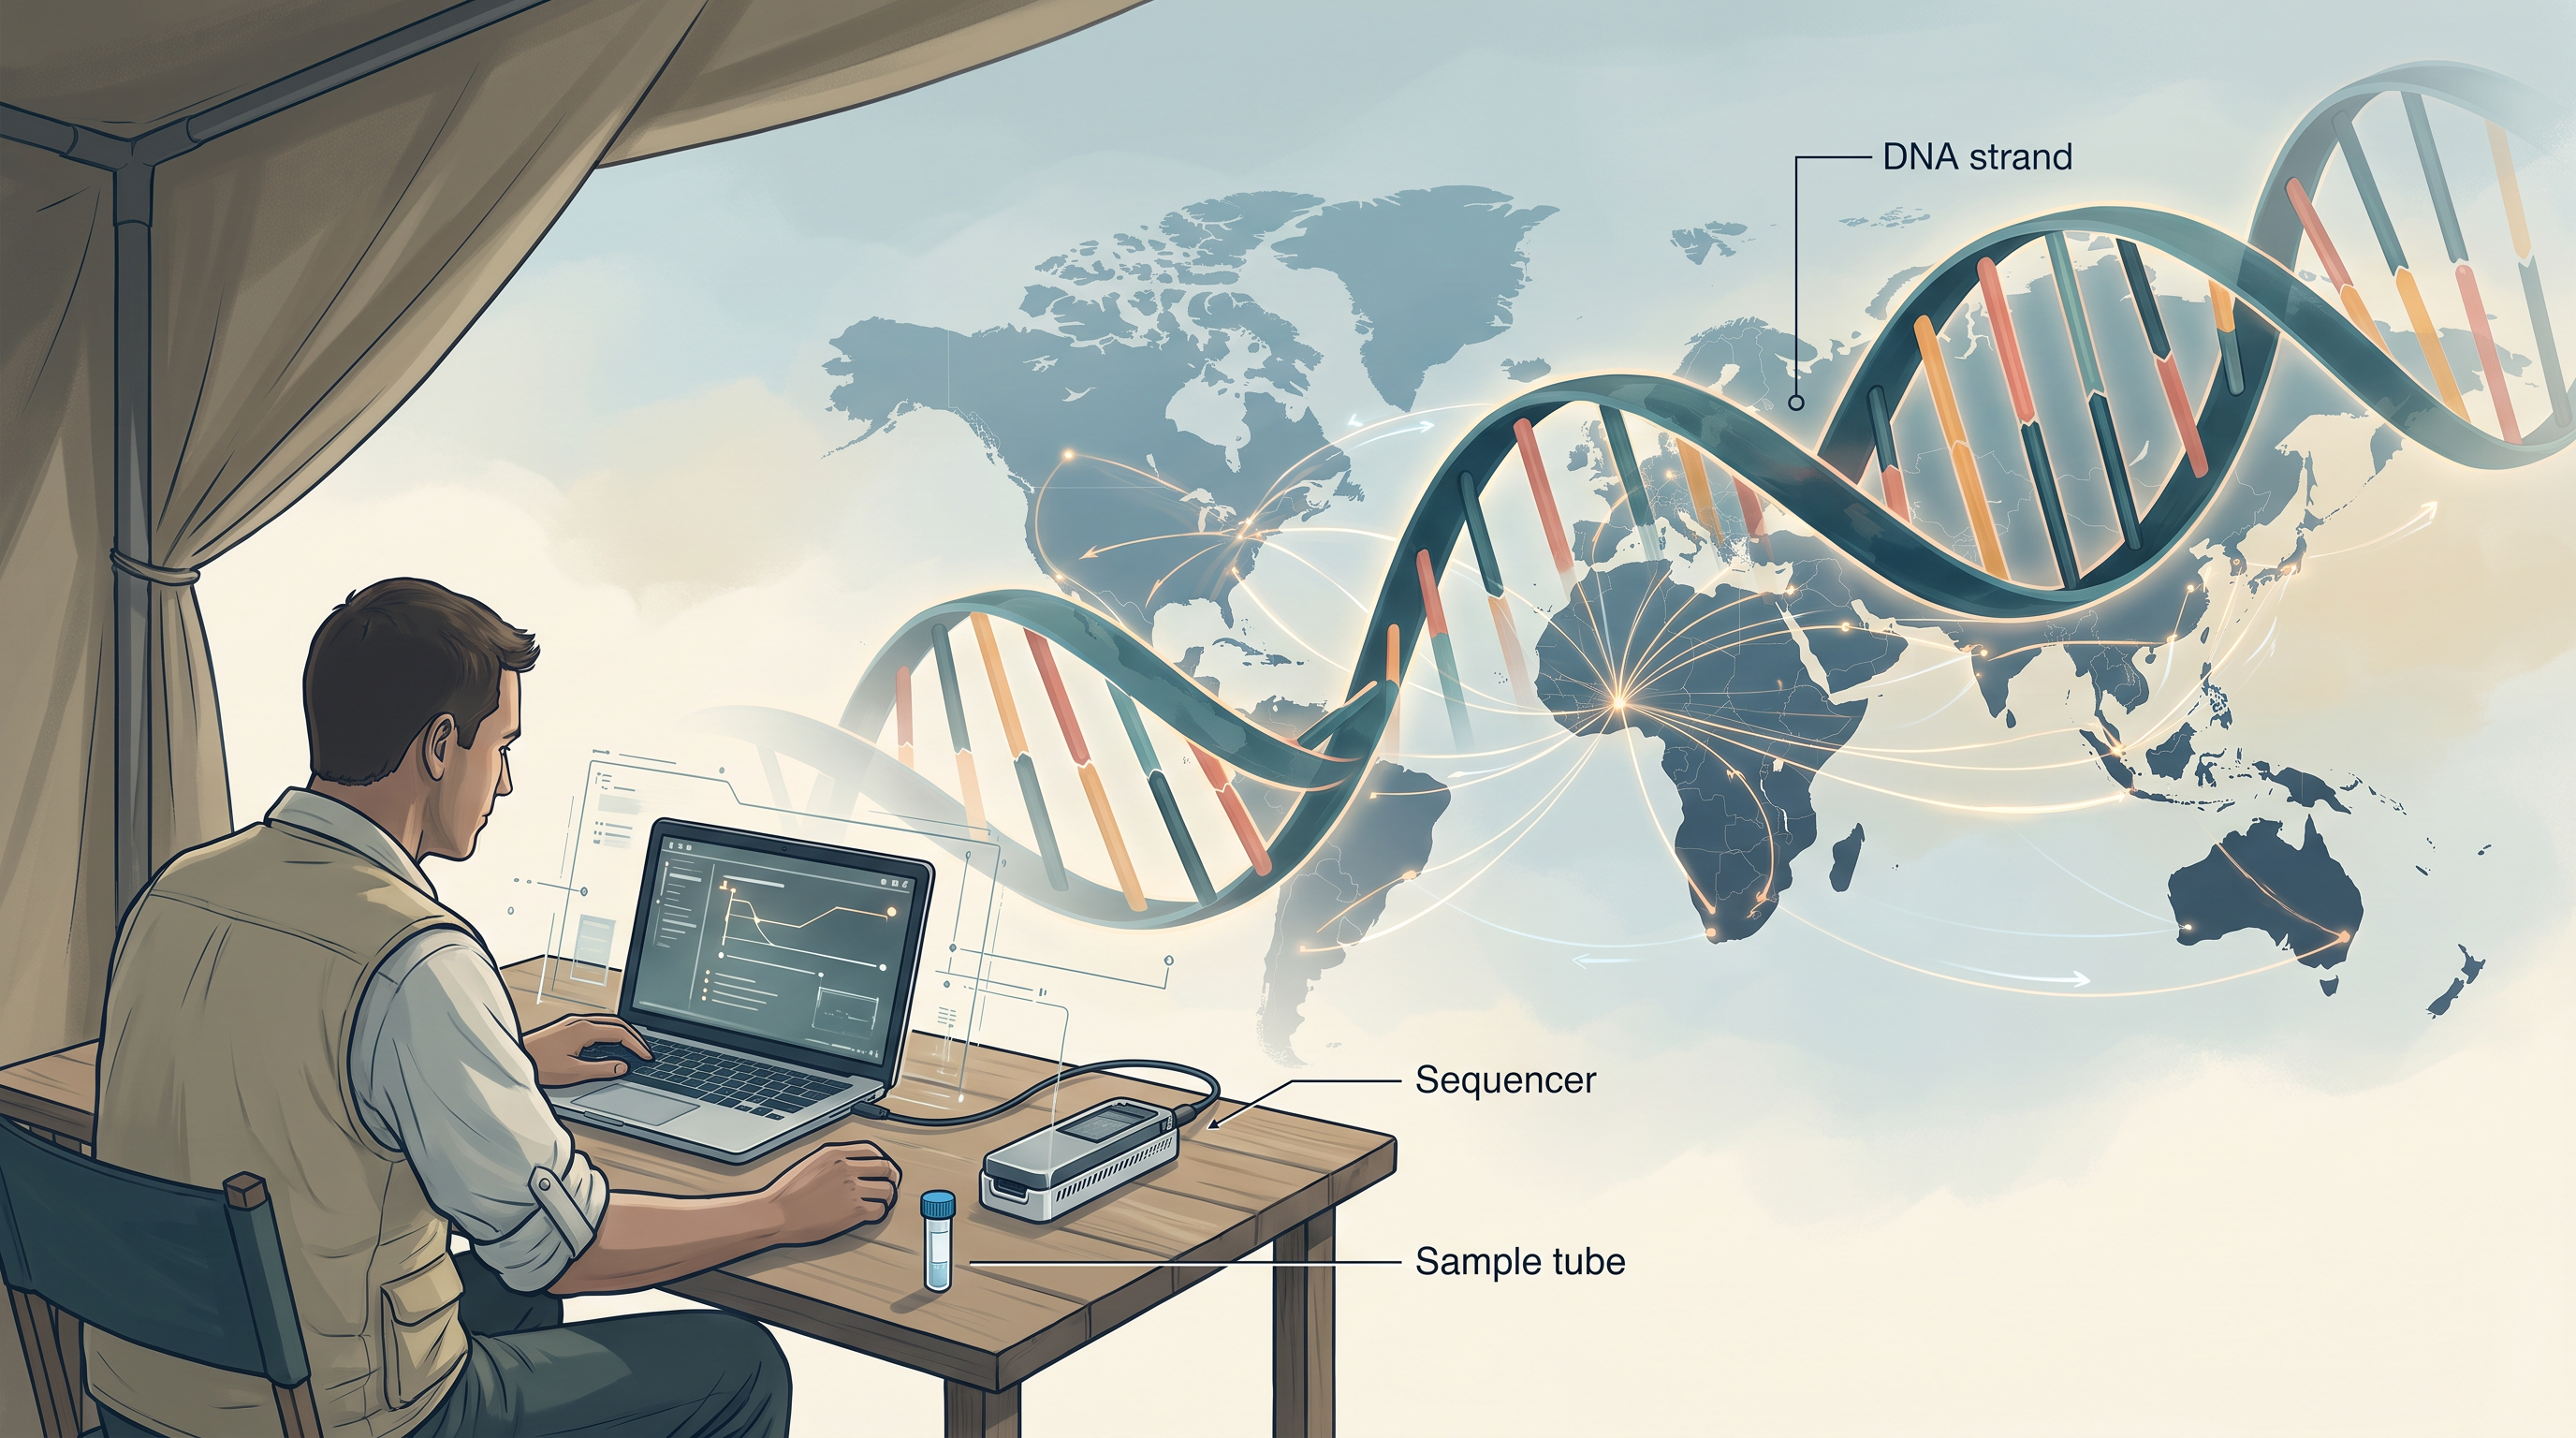
Fig. 5.0 – Portable DNA sequencing in the field.
Keep these five questions in mind as you read. This chapter will answer every one of them.
5.1 Mapping of the Genome: Genetic and Physical
The genome of an organism is the complete genetic information present in the cell of that organism. It is not a single molecule in every case, and it is not stored in the same place in every kind of cell. What counts as “the genome” therefore depends on the type of cell we are looking at.
In prokaryotes, such as bacteria, the genome includes the DNA present in the nucleoid region together with the DNA present in the plasmid. The nucleoid is the region of the bacterial cell where the main circular chromosome lies coiled, without a surrounding nuclear membrane. A plasmid is a small, circular, self-replicating DNA molecule that exists separately from the main chromosome and often carries extra genes, such as genes for antibiotic resistance.
In eukaryotes, the genome includes the DNA present in the chromosomes of the nucleus as well as the DNA present in organelles, like mitochondria and the plastids. Protists and all multicellular organisms fall in this group. This organellar DNA is easy to forget in an examination answer, but it is genuinely part of the genome — mitochondria and chloroplasts carry their own small circular DNA molecules, a leftover of their evolutionary origin. The difference between the two arrangements is shown in Fig. 5.1.
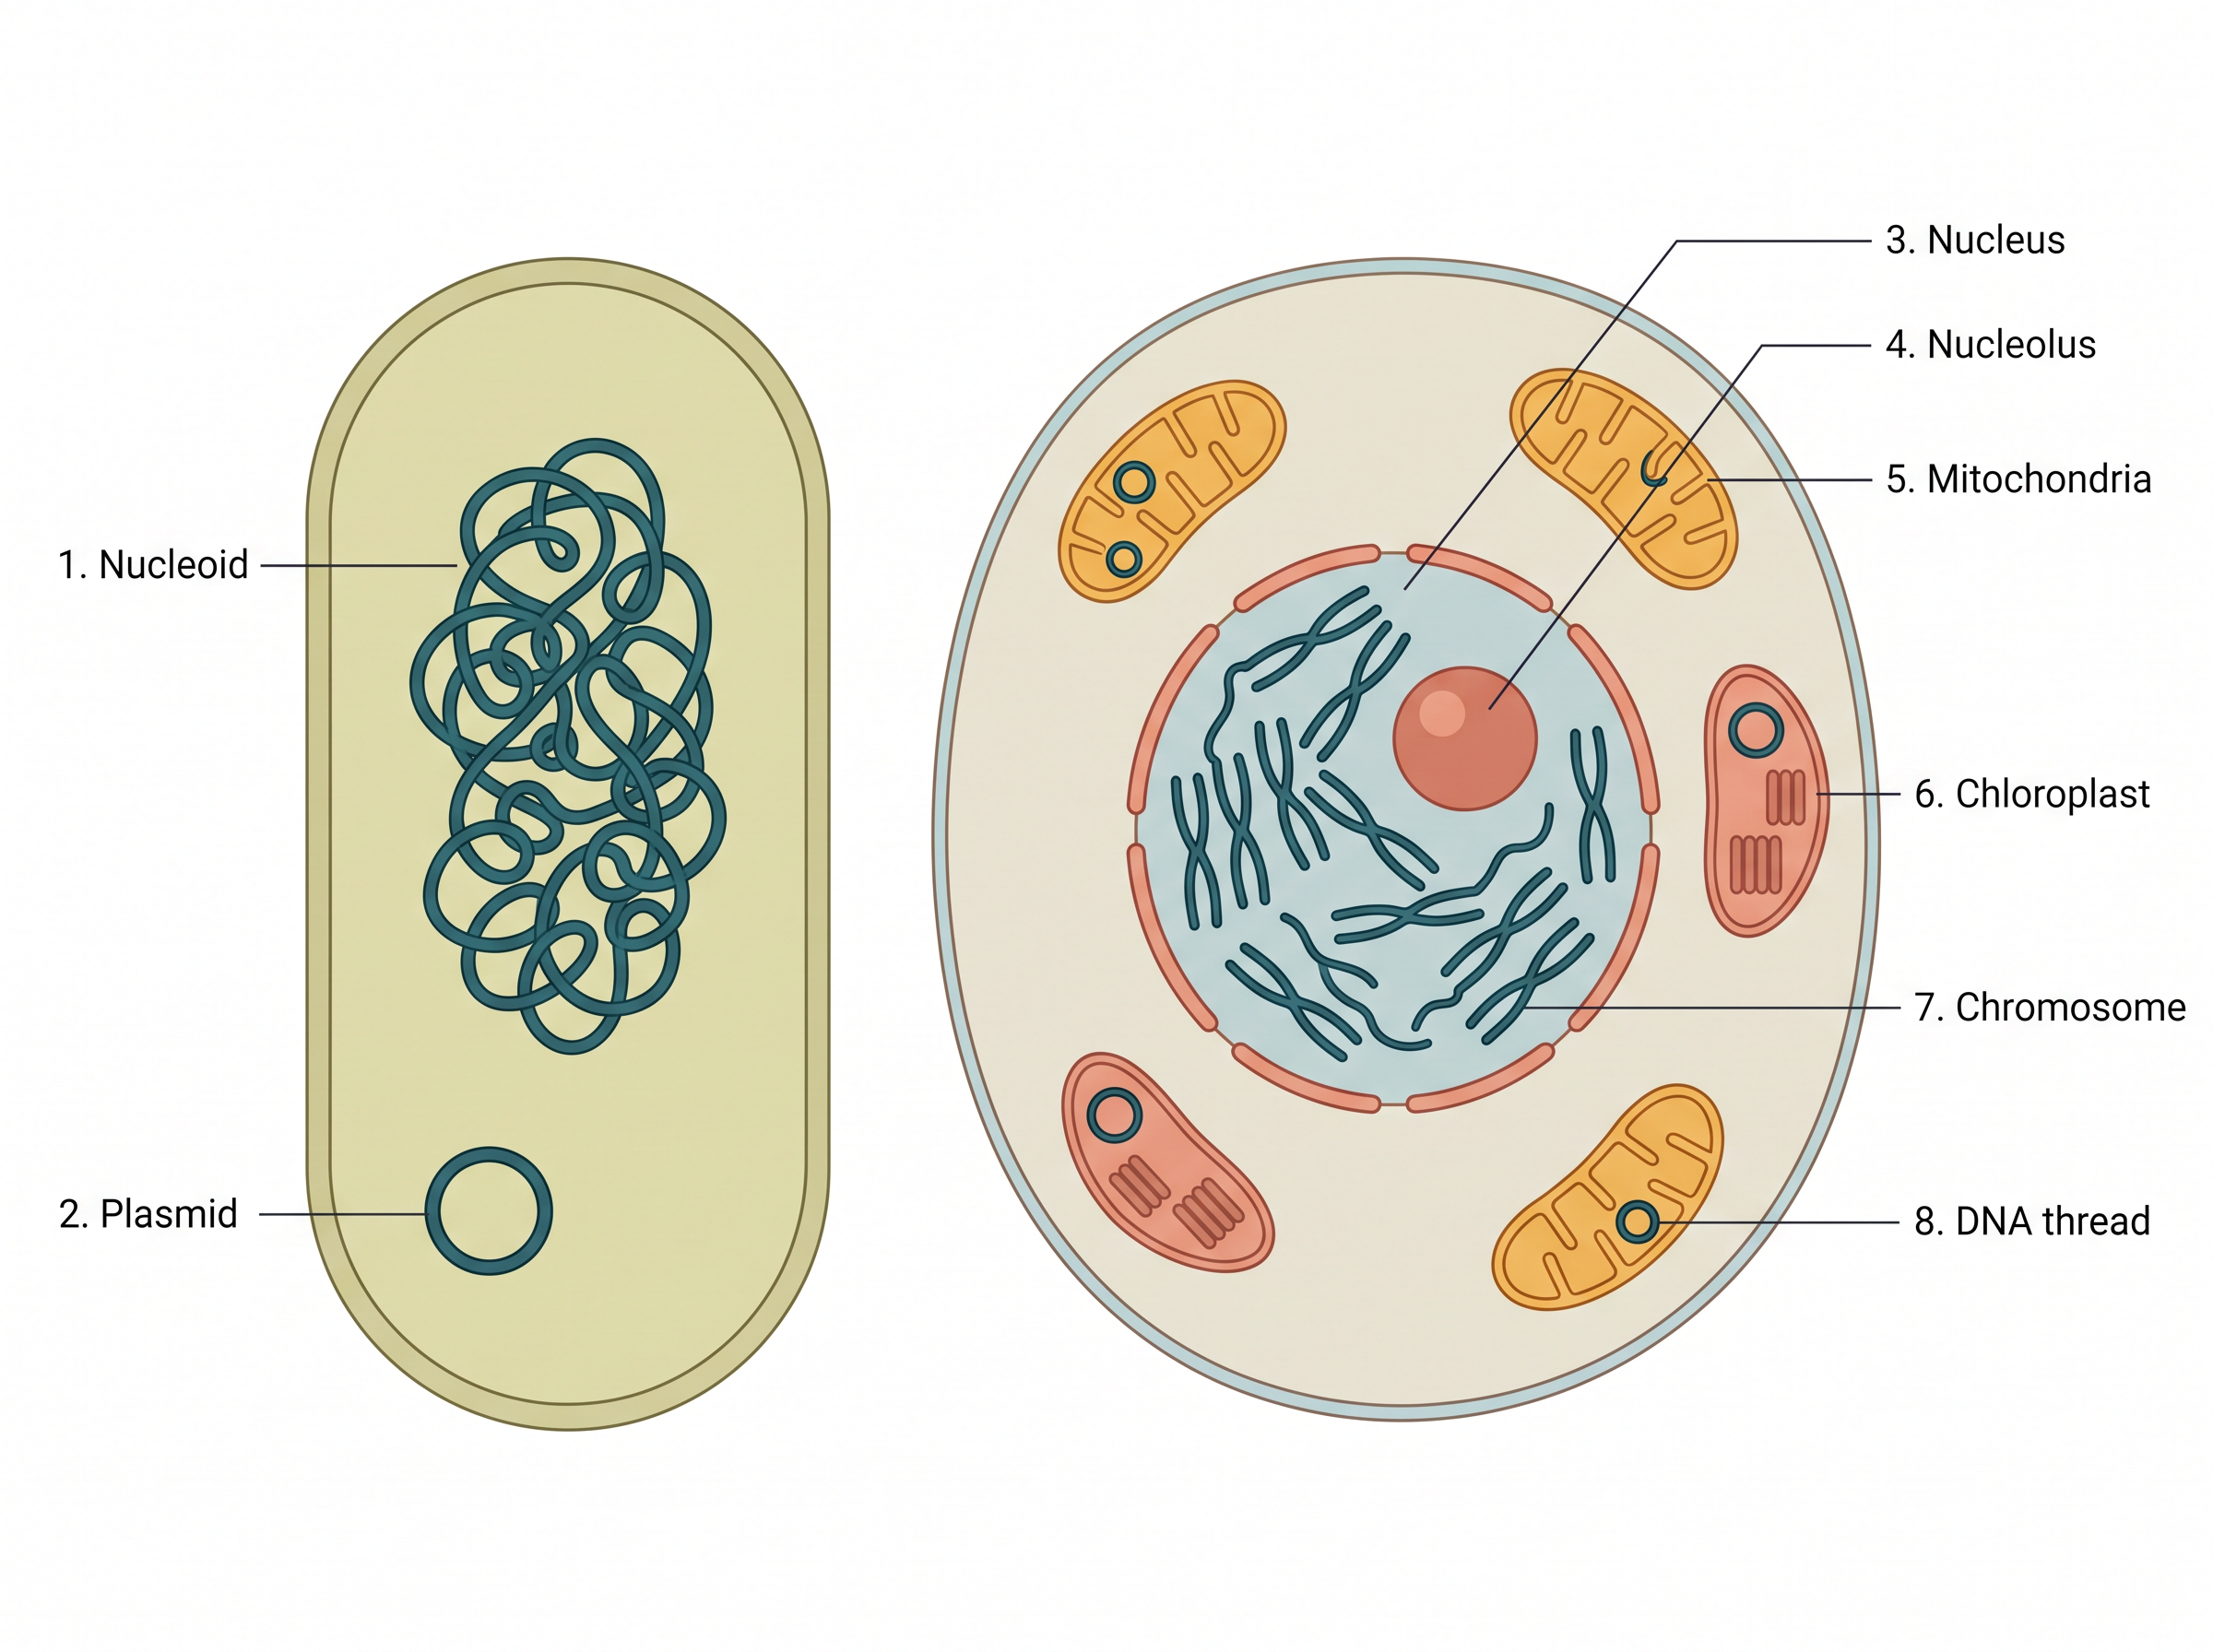
Fig. 5.1 – Prokaryotic and eukaryotic genomes.
Why Biologists Compare Genomes
One of the important tasks for many biologists is to compare the genomes or the DNA of two organisms. There are several reasons for doing this — understanding which genes or DNA sequences have been conserved across species, working out how closely two organisms are related, and so on.
Put in simple words, a scientist working with multiple samples from a biological organism wants to know whether the DNA samples from two or more sources are similar or different. And if the DNA from two sources is different, the next question follows immediately: how exactly are they different from each other?
There is a third kind of question too. If an interesting phenotype is noticed — an unusual seed colour, a resistance to a drug, an inherited disorder in a family — the scientist may want to know the genetic basis of that particular phenotype, that is, which genes are involved and what mutations they carry. A phenotype is the observable characteristic of an organism, and it is the visible clue that sends us looking for the invisible gene behind it.
Answering questions of this kind needs a whole set of techniques. Ideally, if we knew the complete DNA sequence of each sample, we could simply compare the sequences and answer all such questions at once. In practice, complete sequences were not always available, and a cheaper and quicker route was needed.
That route is mapping. In genome research it is extremely important and crucial to create a map of the genome of an organism, from the point of view of identifying genes or loci and knowing their relative positions. A locus (plural: loci) is simply the fixed position that a gene or a marker occupies on a chromosome.
Maps of a genome can be created by two different approaches — the genetic approach and the physical approach. These give rise to the two families of techniques used for genome mapping in biological organisms, genetic mapping and physical mapping, illustrated in Fig. 5.2.
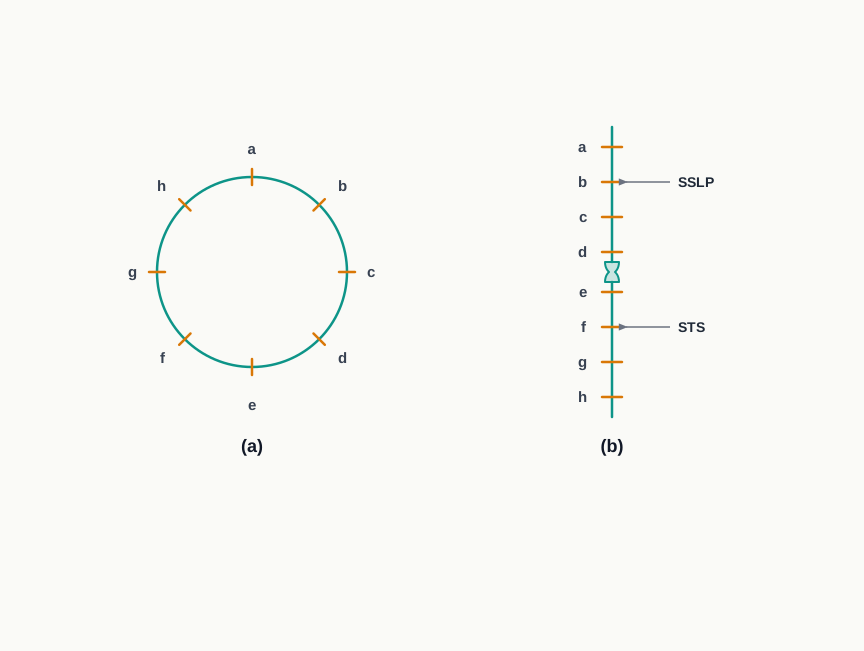
Fig. 5.2 – Circular and linear genome maps.
Notice in Fig. 5.2 that a prokaryotic or organelle genome is drawn as a circle while a eukaryotic genome is drawn as a linear chromosome. That difference is not decorative — it reflects the actual shape of the DNA, and as you will see shortly, it changes how many fragments you get when the DNA is cut.
5.1.1 Genetic Mapping
Genetic mapping experiments give us an estimate of the distances between two or more genetic loci that are responsible for a set of well-known phenotypes. A genetic map, as shown in Fig. 5.2, is created by carrying out crossover analysis.
You have already studied the phenomenon of crossing over in Class XI. During meiosis, homologous chromosomes exchange segments with each other. The important consequence is that two genes sitting on the same chromosome do not always travel together into the same gamete — sometimes crossing over separates them.
The rate of crossing over, also referred to as recombination frequency, between two or more genes or loci has been successfully used to measure the relative genetic distance between them. The logic is simple and worth stating clearly: the farther apart two loci lie on a chromosome, the more room there is between them for a crossover to occur, and so the more often they are separated.
One map unit is equal to one per cent of observed cross-over, that is, one per cent recombinants among the offspring. The unit centimorgan (cM) is used to denote the genetic distance between genes based on offspring phenotype frequency.
\[\text{Recombination frequency (\%)} = \frac{\text{Number of recombinant offspring}}{\text{Total number of offspring}} \times 100\]
Here the numerator counts only those offspring whose combination of characters is new — that is, not present in either parent — and the denominator counts every offspring scored in the cross. The result is a percentage, and a value of 1 per cent corresponds to a genetic distance of one map unit, or 1 cM.
The chances of segregation of two loci by recombination are directly proportional to the distance between them. Therefore, a decreased recombination frequency is an indication that the distance between the said loci is less. When the genetic loci are arranged in order on the basis of the genetic distances between them, the arrangement produced is the genetic map of the organism.
The Limitation of Genetic Maps
The main drawback of this approach is the availability of only a limited number of genetic loci that are responsible for a set of well-known phenotypes. You can map a locus by crossover analysis only if it produces a phenotype you can actually see and score in the offspring — and most of the genome does not.
This makes genetic maps sparsely populated, or coarsely grained. A map with few landmarks widely spaced is of limited use, and therefore this coarseness limits the utility of such maps for the fine mapping of new phenotypes to the genome. If a new phenotype has to be located, a map with landmarks spread thinly cannot pin it down to a small region.
5.1.2 Physical Mapping
An alternative to genetic mapping is physical mapping of the genome, in which specific locations on the genome are identified using DNA-based map features. The key change is what serves as a landmark. A genetic map uses phenotypes; a physical map uses recognisable features of the DNA molecule itself, so it does not matter whether that stretch of DNA produces any visible character at all.
Three kinds of map features have been used, all shown in Fig. 5.2 — the presence of restriction enzyme sites (restriction mapping), Simple Sequence Length Polymorphism (SSLP), and Sequence Tagged Sites (STS). These features are helpful in creating a high resolution physical map of the genome. Let us briefly understand each of these genome map features.
Restriction Fragment Length Polymorphism (RFLP)
RFLP is a mapping technique that uses a DNA endonuclease enzyme called a restriction enzyme, which cuts DNA at a specific base sequence and thereby fragments the DNA. An endonuclease is an enzyme that cuts within a DNA strand rather than nibbling at its ends, and a restriction enzyme is a special kind of endonuclease that will cut only where it finds its own particular recognition sequence. For example, EcoRI recognises and cuts at 5'-GAATTC-3', while BamHI recognises and cuts at 5'-GGATCC-3'.
Because the enzyme cuts only at its own sequence, the set of fragments produced from a given DNA sample is fixed and reproducible — it is a fingerprint of where those sequences lie. The fragmentation pattern of the digested DNA can be visualised when the fragments are separated on the basis of their sizes by agarose gel electrophoresis, a technique in which DNA fragments are driven through a gel by an electric field and travel distances according to their size, the smaller fragments moving farther.
The number of fragments you get depends on the shape of the DNA, and this is a favourite point for short questions. Typically, a single cut in a circular DNA yields one fragment of DNA, while a dual cut leads to two fragments. For linear DNA, a single cut results in two fragments of DNA, while a dual cut results in three fragments.
| Feature | Circular DNA | Linear DNA |
|---|---|---|
| Shape before cutting | Closed loop, no free ends | Straight molecule with two free ends |
| One cut gives | 1 fragment | 2 fragments |
| Two cuts give | 2 fragments | 3 fragments |
| General relation | Number of fragments = number of cuts | Number of fragments = number of cuts + 1 |
| Typical example | Bacterial chromosome, plasmid, organelle genome | Eukaryotic nuclear chromosome |
The DNA is digested with some of the enzymes such as EcoRI, BamHI, and so on, either singly or sequentially, to create a map of restriction sites based on the size of the fragments they produce. Digesting the same sample singly with one enzyme, then with the other, and then with both together allows the positions of the sites to be worked out relative to one another. This exercise results in a high-resolution physical map of the restriction sites of the genome.
The full sequence of steps is summarised in Fig. 5.3.
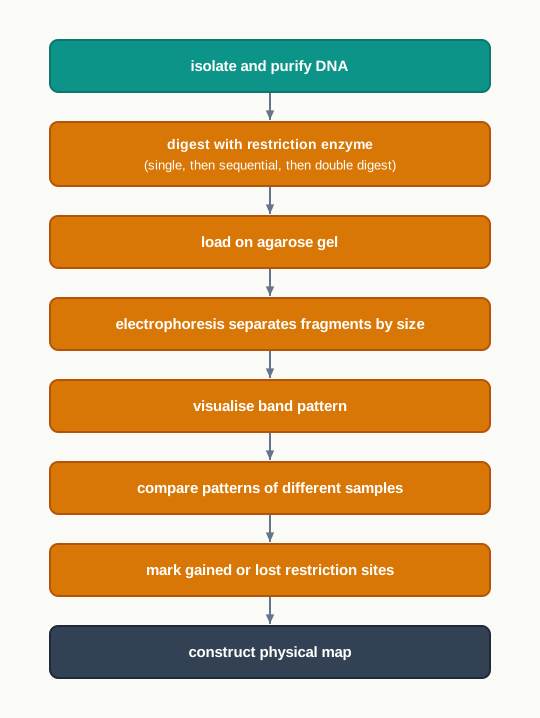
Fig. 5.3 – RFLP mapping workflow.
Such a map can easily be compared with others, noticing the gain or loss of certain restriction sites. It is exactly this gain or loss that produces the observed RFLP between DNA samples, seen as changes in the length of the DNA fragments (Fig. 5.4).
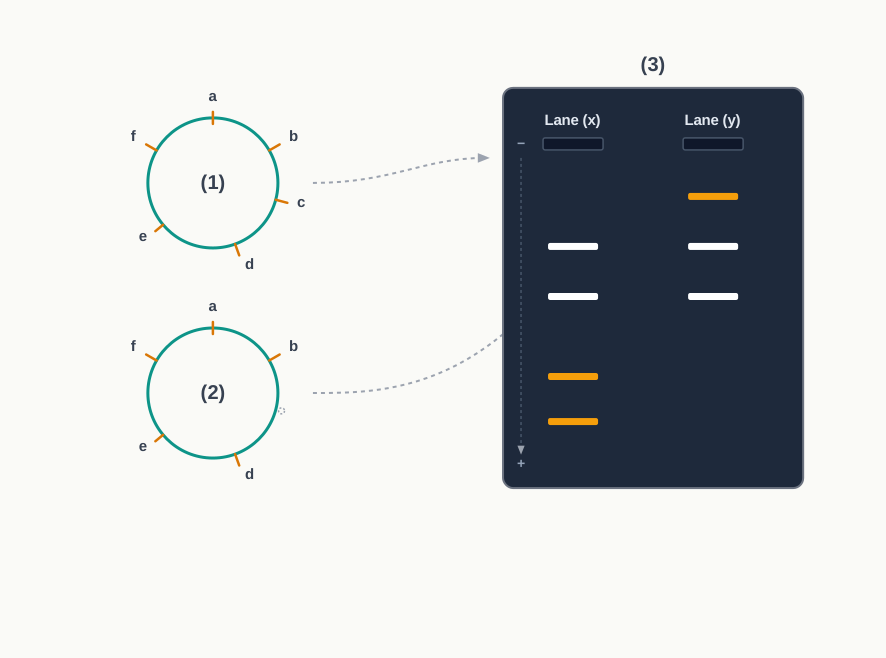
Fig. 5.4 – Comparing physical genome maps and RFLP patterns.
Read Fig. 5.4 slowly, because it teaches the whole idea in one picture. Genome (1) carries the restriction site c; genome (2) has lost it. In lane (x), the presence of site c means the DNA there is cut into two smaller pieces, which appear as two smaller unique bands. In lane (y), the absence of site c means that stretch is never cut, so the same DNA stays as one longer piece and appears as one larger unique band. All the other bands, produced by sites the two genomes share, look identical.
For example, in a family with a history of a certain disease, comparison of these maps among the diseased and the disease-free members may help to identify the specific RFLP locus associated with the disease. If one band pattern turns up consistently in affected members and consistently fails to turn up in unaffected ones, that RFLP locus is likely to lie close to the gene responsible. Association mapping of this kind can also help to identify the genetic divergence between populations.
The Problem of Too Many Fragments
There is, however, an important practical difficulty. A mammalian genome may have several sites for different restriction enzymes, and it is quite possible that a restriction enzyme like EcoRI may cut a mammalian genome into lakhs of fragments. Such a huge number of fragments cannot be distinguished on the basis of electrophoresis — instead of clean, countable bands, the gel shows a continuous smear.
This problem is addressed by the technique of Southern hybridisation, in which a specific DNA probe lying between different RFLP sites is used (Fig. 5.5). A probe is a short piece of single-stranded DNA of known sequence, carrying a label, which pairs by complementary base pairing with only the one fragment that matches it. Instead of trying to see every fragment, we make just the fragment of interest visible.
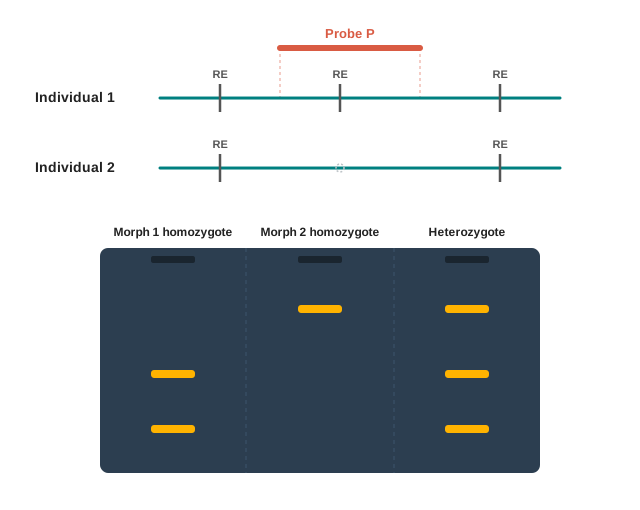
Fig. 5.5 – Physical mapping using Southern hybridisation.
Fig. 5.5 is worth reading band by band. Individual 1 and individual 2 differ in their restriction sites, so probe P lights up fragments of different length in the two — these two versions are the two DNA morphs. An individual carrying only the first version shows the Morph 1 homozygote pattern, an individual carrying only the second shows the Morph 2 homozygote pattern, and an individual carrying one of each shows both bands together as a heterozygote. Reading a person’s genotype straight off a band pattern is exactly what makes RFLP so powerful in family studies.
Simple Sequence Length Polymorphism (SSLP) Map
A large genome contains arrays of different repeat sequences, which may be of varying length. Microsatellites and minisatellites are such repeat sequences, and they too can be used for physical mapping of the genome, based on their length variants.
The idea behind using them is straightforward. A repeat array at a given locus may contain, say, twelve copies of a short repeated unit in one individual and nineteen copies in another. The location of the array is the same in both, but its length is not — and that difference in length is the polymorphism that makes it a usable landmark.
Physical Mapping using Sequence Tagged Sites (STS)
Sequence tagged sites are a useful addition to physical mapping. STS are unique DNA sequences, 200–500 bp long, that occur once in a genome and whose unique location in the genome is known.
Two properties make an STS valuable, and both are contained in that definition. It occurs only once, so finding it tells you exactly where you are; and its position is already known, so it works as a fixed signpost.
The presence or absence of an STS site in a given fragment of DNA can be easily demonstrated using PCR, the polymerase chain reaction, in which a chosen stretch of DNA is copied many times over using a pair of primers designed to flank it. If the primers give a product of the expected size, the STS is present in that fragment; if there is no product, it is absent.
Hence the presence of these sites serves as a useful location landmark in the creation of a physical map of a genome. STS are often combined with restriction maps to improve the resolution and the effectiveness of association mapping — the restriction sites and the sequence tagged sites together give a denser set of landmarks than either could provide alone.
| Feature | Genetic mapping | Physical mapping |
|---|---|---|
| Landmark used | Genetic loci responsible for well-known phenotypes | DNA-based map features: restriction sites, SSLP, STS |
| Method of measurement | Crossover analysis, recombination frequency | Restriction digestion and electrophoresis, PCR-based detection |
| Unit of distance | Map unit or centimorgan (cM) | Base pairs of DNA |
| Resolution | Coarsely grained, sparsely populated | High resolution |
| Main limitation | Only a limited number of scorable phenotypes exist | Very large genomes give too many fragments to resolve without probes |
5.2 High-throughput DNA Sequencing
While we can compare the physical and the genetic map of organisms in order to differentiate and classify them, it is highly desirable to get the complete DNA sequence of the organism. A map tells you where the landmarks are; a sequence tells you every letter between them. Only the sequence itself can show which base has changed in a mutation.
In earlier days, sequencing complete genomes was prohibitively expensive. Because of this cost, less expensive techniques were used first, to narrow down the region of interest to a small locus of DNA — that is, a locus statistically associated with the phenotype of interest. Only this small region of interest was then used for sequencing, so as to avoid the prohibitive cost of full genome sequencing.
This strategy worked, but it came with a condition attached. The approach requires a map of the genome that could be referred to, or compared with others. Without such a map there is no way to say which small region should be picked out for sequencing in the first place — which is precisely why the mapping techniques of the previous section mattered so much in the early years of genome research.
Advances in sequencing technology have now made it possible to obtain the complete DNA sequence of any organism, provided we can get its DNA. Initially, the cost of DNA sequencing per base was prohibitive for carrying out full DNA sequencing of eukaryotic organisms, including human beings. However, this has changed drastically at present. In this section we will see how DNA sequence technology has evolved over the last three decades.
The phrase high-throughput is the key to the whole section. Throughput means the amount of DNA a machine can read in a given time. The entire story that follows is the story of raising throughput — from a few hundred bases read one reaction at a time, to millions of reactions read simultaneously, to a single molecule being read as it threads through a hole.
5.2.1 First generation DNA sequencing technology
The initial or first phase of genome sequencing was an elaborate and a multistep procedure. Nothing could be sequenced directly from a cell; the DNA had to be broken down, sorted, copied and organised long before a single base was read.
It involved separation of the chromosomes on an agarose gel using Pulse Field Gel Electrophoresis (PFGE). Ordinary electrophoresis cannot separate very large DNA molecules, because above a certain size they all crawl through the gel at much the same rate. PFGE solves this by changing the direction of the electric field at intervals, forcing the molecules to reorient again and again, so that even whole chromosomes can be separated by size.
The separated chromosome was then subjected to restriction digestion, and the digested fragments were ligated to high-capacity cloning vectors, such as BAC, YAC, PAC, and so on. A cloning vector is a DNA molecule that can carry a foreign DNA fragment into a host cell and replicate there, and a high-capacity vector is one that can accept a very large insert — necessary here, because chopping a chromosome into small pieces would have produced an unmanageable number of them.
The DNA present in these clones is often overlapping. That overlap is not a nuisance but the very thing that makes reassembly possible: if two clones share a common stretch of sequence, they must have come from neighbouring regions of the chromosome, and so they can be placed next to each other. The clones from such exercises can therefore be organised into a set of minimum clones that carry an overlapping set of DNA from the organism.
DNA segments from these clones are physically mapped and sub-cloned into a sequencing plasmid, so that the cloned DNA can be sequenced using the first generation DNA sequencing techniques. Sub-cloning simply means transferring a smaller piece from the big vector into a smaller, more convenient one that the sequencing reaction can handle.
The whole of this preparatory pipeline is summarised in Fig. 5.6.
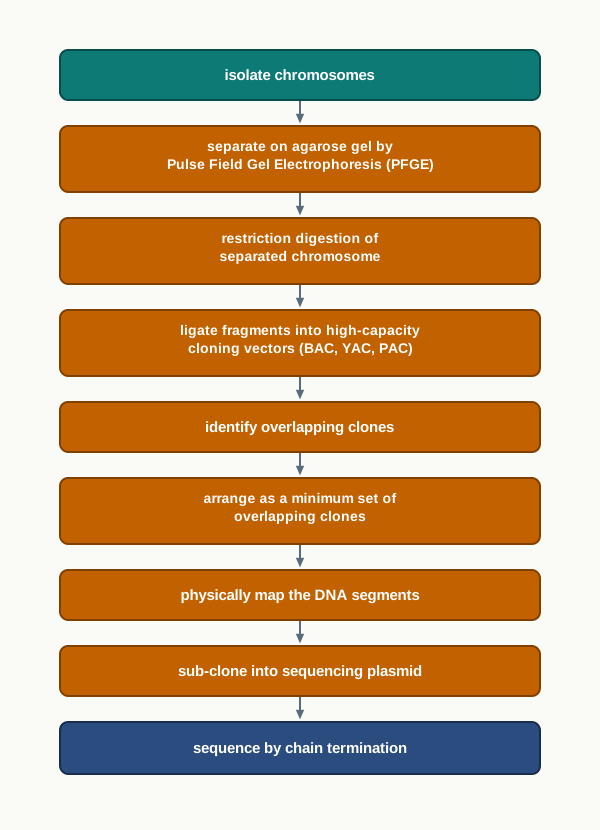
Fig. 5.6 – First generation genome sequencing workflow.
Sequencing by chain termination
The first generation DNA sequencing technique used a method called sequencing by chain termination, which you have already met in the Class XI Biotechnology textbook. In this method, a ladder of single stranded DNA is created, each molecule terminating at a specific base location, and that terminating base is identified by a specific fluorescence tagged to it.
The word ladder describes the result exactly. The reaction produces a whole population of new DNA strands that all begin at the same point but stop at different points — one stops at the first position, another at the second, another at the third, and so on. Each strand therefore differs from the next by a single nucleotide, and the identity of its last base is announced by the colour of its fluorescent tag.
These fragments are separated on the basis of their size using the capillary gel electrophoresis technique, in which the electrophoresis of the charged molecules — that is, the DNA fragments — is done in a capillary filled with gel. A capillary is a very fine tube; running the separation in such a narrow channel gives far sharper separation than a slab gel, and here the separation must be sharp enough to resolve fragments differing by just one base.
A fluorescence detector is positioned near the bottom end of the capillary, to read the fluorescence of the single stranded DNA passing in front of the detector. Since the shortest fragment travels fastest, the fragments arrive at the detector strictly in order of increasing length — and reading their terminal bases in that order reads the sequence itself.
The output of this technology is a chromatogram of fluorescence, where each peak represents a base position and the colour of the peak indicates which DNA base is present there. Reading a chromatogram is a skill worth practising: move left to right along the trace, take the peaks in order, and note the colour of each one. A clean sequence gives a row of tall, evenly spaced, single-coloured peaks; overlapping or ragged peaks are a warning that the read is unreliable.
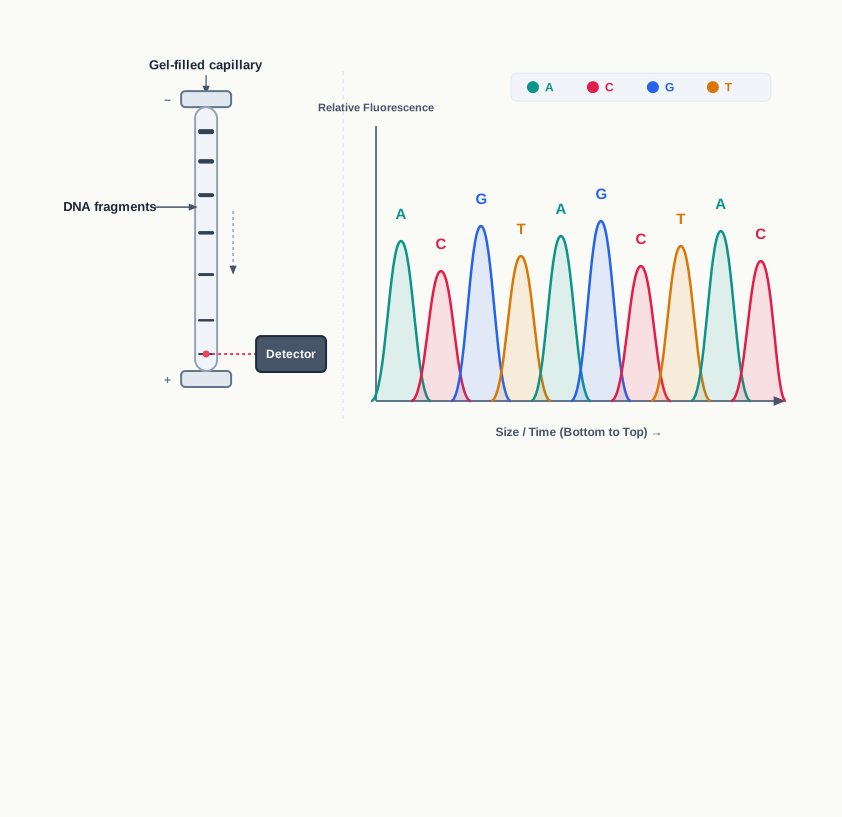
Fig. 5.7 – Capillary gel electrophoresis and chain termination sequencing.
How much this machine could deliver
Each capillary, in a single run, sequences about 800–1000 base-long DNA. A single DNA sequencer can have as many as 96 capillaries, with 96 different sequencing reactions loaded, operating in parallel in one machine. This type of setup can provide up to 96000 bases per run, per machine.
\[96 \text{ capillaries} \times 1000 \text{ bases per capillary} = 96000 \text{ bases per run}\]
Here 96 is the number of capillaries in the machine, 1000 bases is the upper end of the read length that one capillary delivers in a run, and 96000 bases is the total output of one run of one machine. Set that number against a human genome of roughly three billion base pairs, and the difficulty of the early years becomes obvious at once.
One of the drawbacks of this technology is that it is time consuming and labour intensive, which leads to a prohibitively high cost of genome sequencing. To overcome this challenge, the next generation of DNA sequencing technology was developed.
5.2.2 Next (second) generation DNA sequencing technology
Next generation DNA sequencing technology uses a massively parallel DNA sequencing approach, meaning that millions of parallel sequencing reactions are carried out in one machine. This is the single change from which all its other advantages follow.
This technology does not require the time consuming cloning and subcloning steps, and therefore it reduces the cost required for a genome sequencing project. Removing cloning removes not only expense but also a source of bias, since some DNA sequences are difficult to maintain inside a bacterial host and tend to be lost during cloning.
Compared to the first generation sequencing methods, next generation methods provide advantages such as a simple workflow, high data accuracy — which comes from a high depth of coverage — and a broad range of application. Depth of coverage means the number of times each base of the genome is read independently. If a position is read fifty times over and forty-nine of those reads agree, a stray error in one read can be recognised as an error rather than mistaken for a mutation.
Although there are many approaches to this strategy, we will look at the working of one of the most popular next generation sequencing technology platforms, namely Illumina Sequencing Technology, shown in Fig. 5.8.
Preparing the flow cell
Illumina sequencing uses a flow cell, which is a glass slide, where DNA fragments are amplified through a special method called Bridge PCR Amplification. The flow cell is a solid support on which single stranded small oligonucleotides, 8–10 bases long, are attached. An oligonucleotide is simply a short chain of nucleotides.
Initially, the DNA is fragmented into small pieces of about 1–2 kb, and small oligonucleotide adaptors are attached to these DNA fragments. Here kb stands for kilobase, that is, one thousand bases. These adaptors are complementary to the oligonucleotides on the flow cell, and hence they help in the attachment of the DNA fragments to the flow cell.
Notice how neatly this solves a problem. The fragments themselves are of unknown and varied sequence, so nothing on the slide could be designed to catch them. Giving every fragment the same known adaptor at its ends gives every fragment the same universal handle.
Bridge amplification
These adaptors are used as primers, and new DNA strands are synthesised. During this process, the fragments make a bridge-like structure, because of the complementarity of the adaptors with the oligonucleotides attached to the flow cell — the free end of an anchored strand bends over and pairs with a neighbouring oligonucleotide on the slide, forming an arch. Therefore the process is called bridge amplification.
Bridge amplification results in a cluster of similar fragments at the same location. This clustering matters for a practical reason: the fluorescence from one single molecule would be far too faint for a camera to see, but the same signal coming from thousands of identical copies packed into one tiny spot is bright enough to be photographed.
The steps involved, as illustrated in Fig. 5.8, are set out in order in Fig. 5.9.
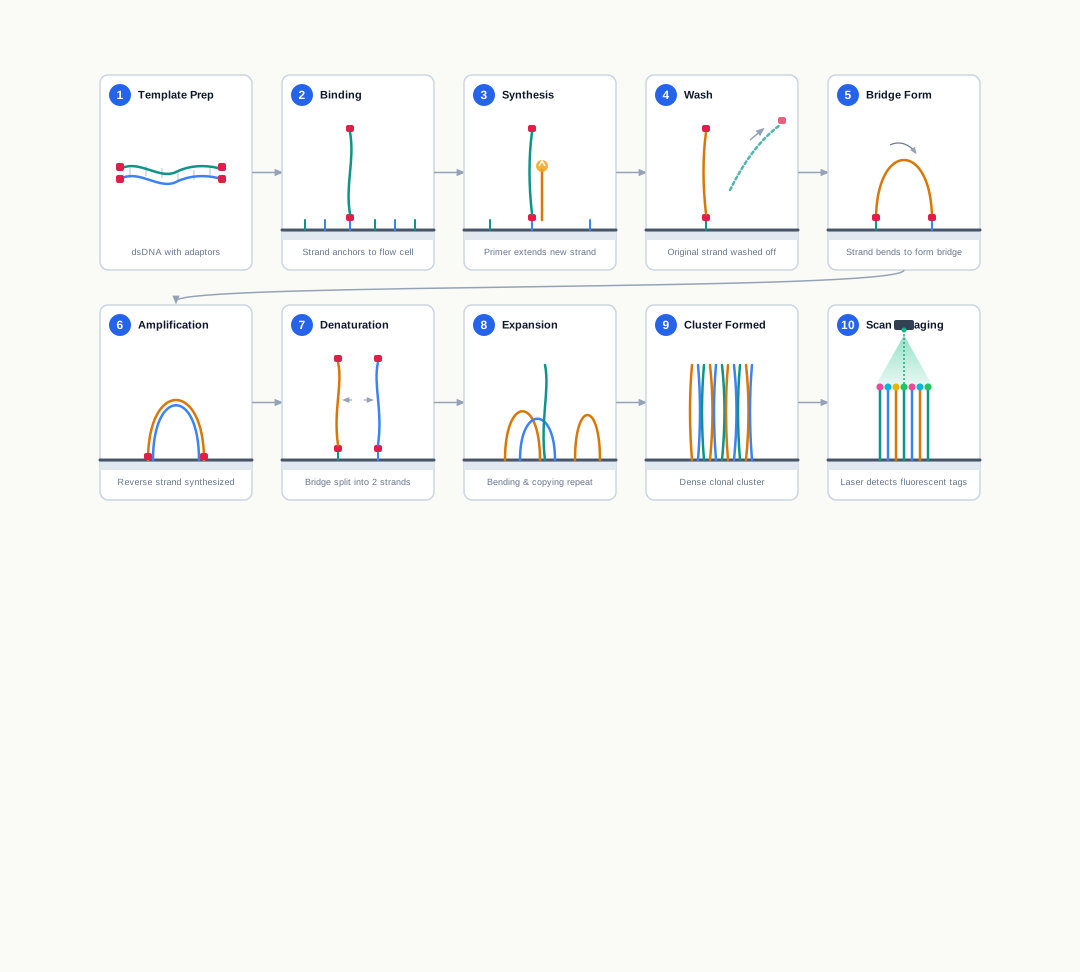
Fig. 5.8 – Illumina next generation sequencing.
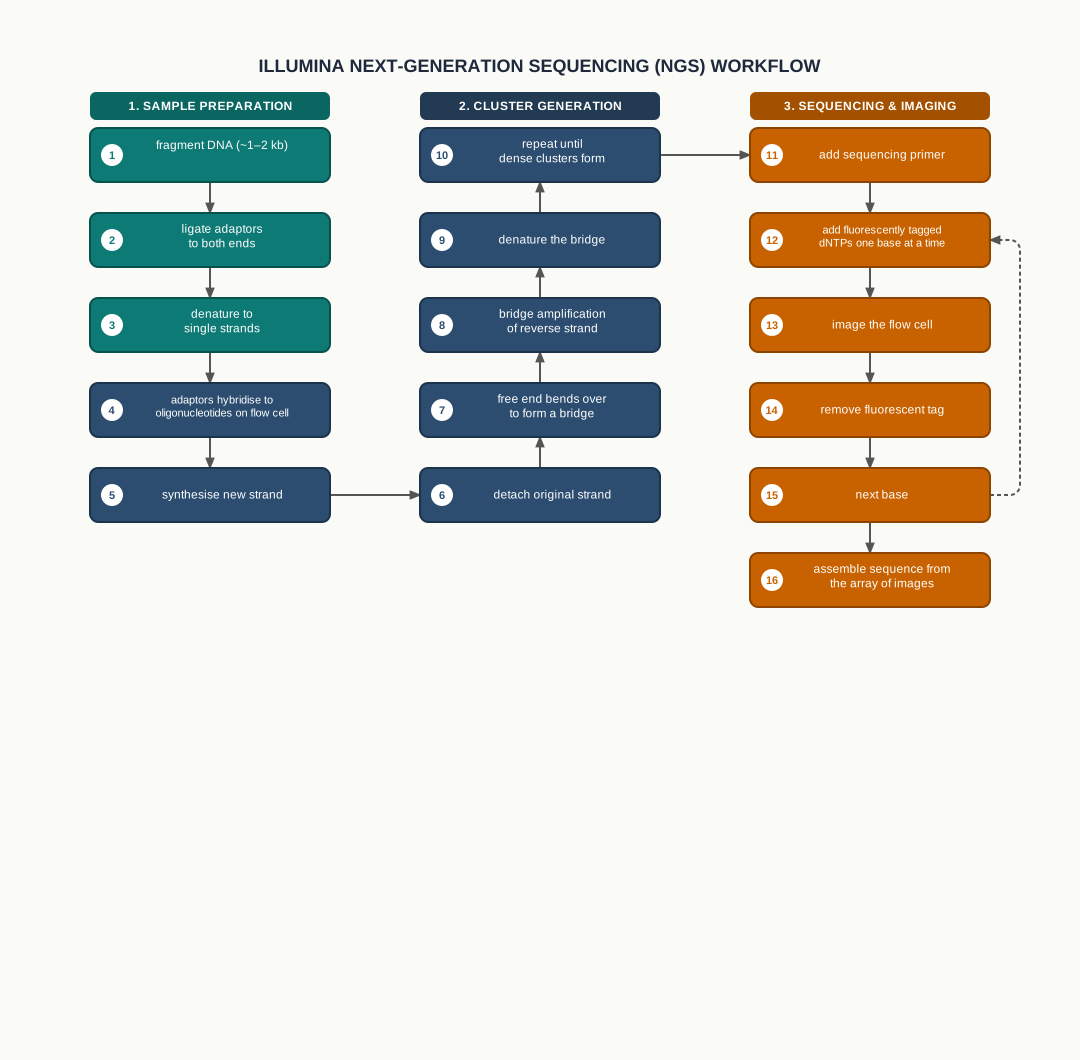
Fig. 5.9 – Illumina sequencing workflow.
Reading the bases
After the PCR amplification, a sequencing primer is used, which binds to one of the adaptors, and each fragment is sequenced at the same time. For sequencing, fluorescently tagged dNTPs are used for the synthesis of the complementary strand, and each of the bases — that is, dATPs, dTTPs, dGTPs or dCTPs — is attached with a different fluorescent tag.
Only one base is added at one time, and the incorporated bases are read on the basis of the type of their fluorescence. This is followed by the addition of the next base, and the fluorescence is imaged again. In this way, millions of fragments are sequenced parallelly at the same time.
The sequencing reaction is polymerase based, and it is carried out in the flow cell by passing labelled bases through it, these bases having a unique fluorescence tag. These fluorescent bases would get incorporated depending on the DNA template initially attached to the flow cells, since a polymerase will only add the base that is complementary to the template. The fluorescence of the newly incorporated base therefore reveals the sequence of the DNA fragment attached on the flow cell (Fig. 5.8).
After recording the image of the flow cell, the fluorescent tag of the incorporated base is removed, and then the next base is passed through the flow cell (Fig. 5.8). Removing the tag before the next cycle is essential; if the old tags stayed in place, the colours would pile up and each new image would be unreadable.
The whole sequencing is recorded as an array of fluorescent images, where the DNA sequencing is recorded as fluorescence changes at a given coordinate or spot. Such an array of images reveals the sequence of millions of such spots in parallel. In effect, the machine is not reading a sequence at all — it is taking photographs, and the sequence is recovered afterwards by tracking how the colour at each coordinate changes from image to image.
Although this technology is capable of sequencing millions of DNA molecules in parallel, it generates a very short length of sequences — 75 to 300 bases long — compared to the first generation technology. Short reads are harder to place correctly, especially across repeated regions of a genome where the same short sequence occurs at many positions. Additional sequencing strategies are available to overcome some of the limitations posed by short sequencing output.
5.2.3 Some recent advances in DNA sequencing technology
One of the recent advances in DNA sequencing technology is the use of nanopores for DNA sequencing. This is also considered a third generation sequencing technology.
Here, sequencing is carried out by measuring the pattern change in electric current across a nanopore, when a specific base in single stranded DNA passes through that nanopore (Fig. 5.10). Note how completely this breaks with what came before. There is no synthesis of a complementary strand, no fluorescent tag and no camera — the DNA molecule itself is read directly, as an electrical signal.
The current implementation of this technology makes use of two proteins — a DNA helicase, and a porin-like molecule that is assembled to form the nanopore on a synthetic membrane. A helicase is an enzyme that unwinds double stranded DNA, and a porin is a protein that forms a pore through a membrane.
The DNA helicase captures and unwinds a double stranded DNA and pushes one of its strands through the nanopore. The helicase is doing two jobs at once here: it separates the strands, since only a single strand is narrow enough to pass, and it feeds that strand through the pore steadily, so that the bases file past one at a time rather than shooting through in a rush.
An ionic current is maintained across the nanopore, and it is monitored continuously. When the single stranded DNA bases pass through the pore, the porin-like molecule interacts differentially with the DNA bases and it disrupts the ionic current.
The disruption caused by each base is very specific, and by measuring these signatures of electric current changes, the corresponding bases can be identified. The four bases differ in size and shape, so each blocks the flow of ions to its own characteristic extent — and that characteristic dip in current is the base’s signature.
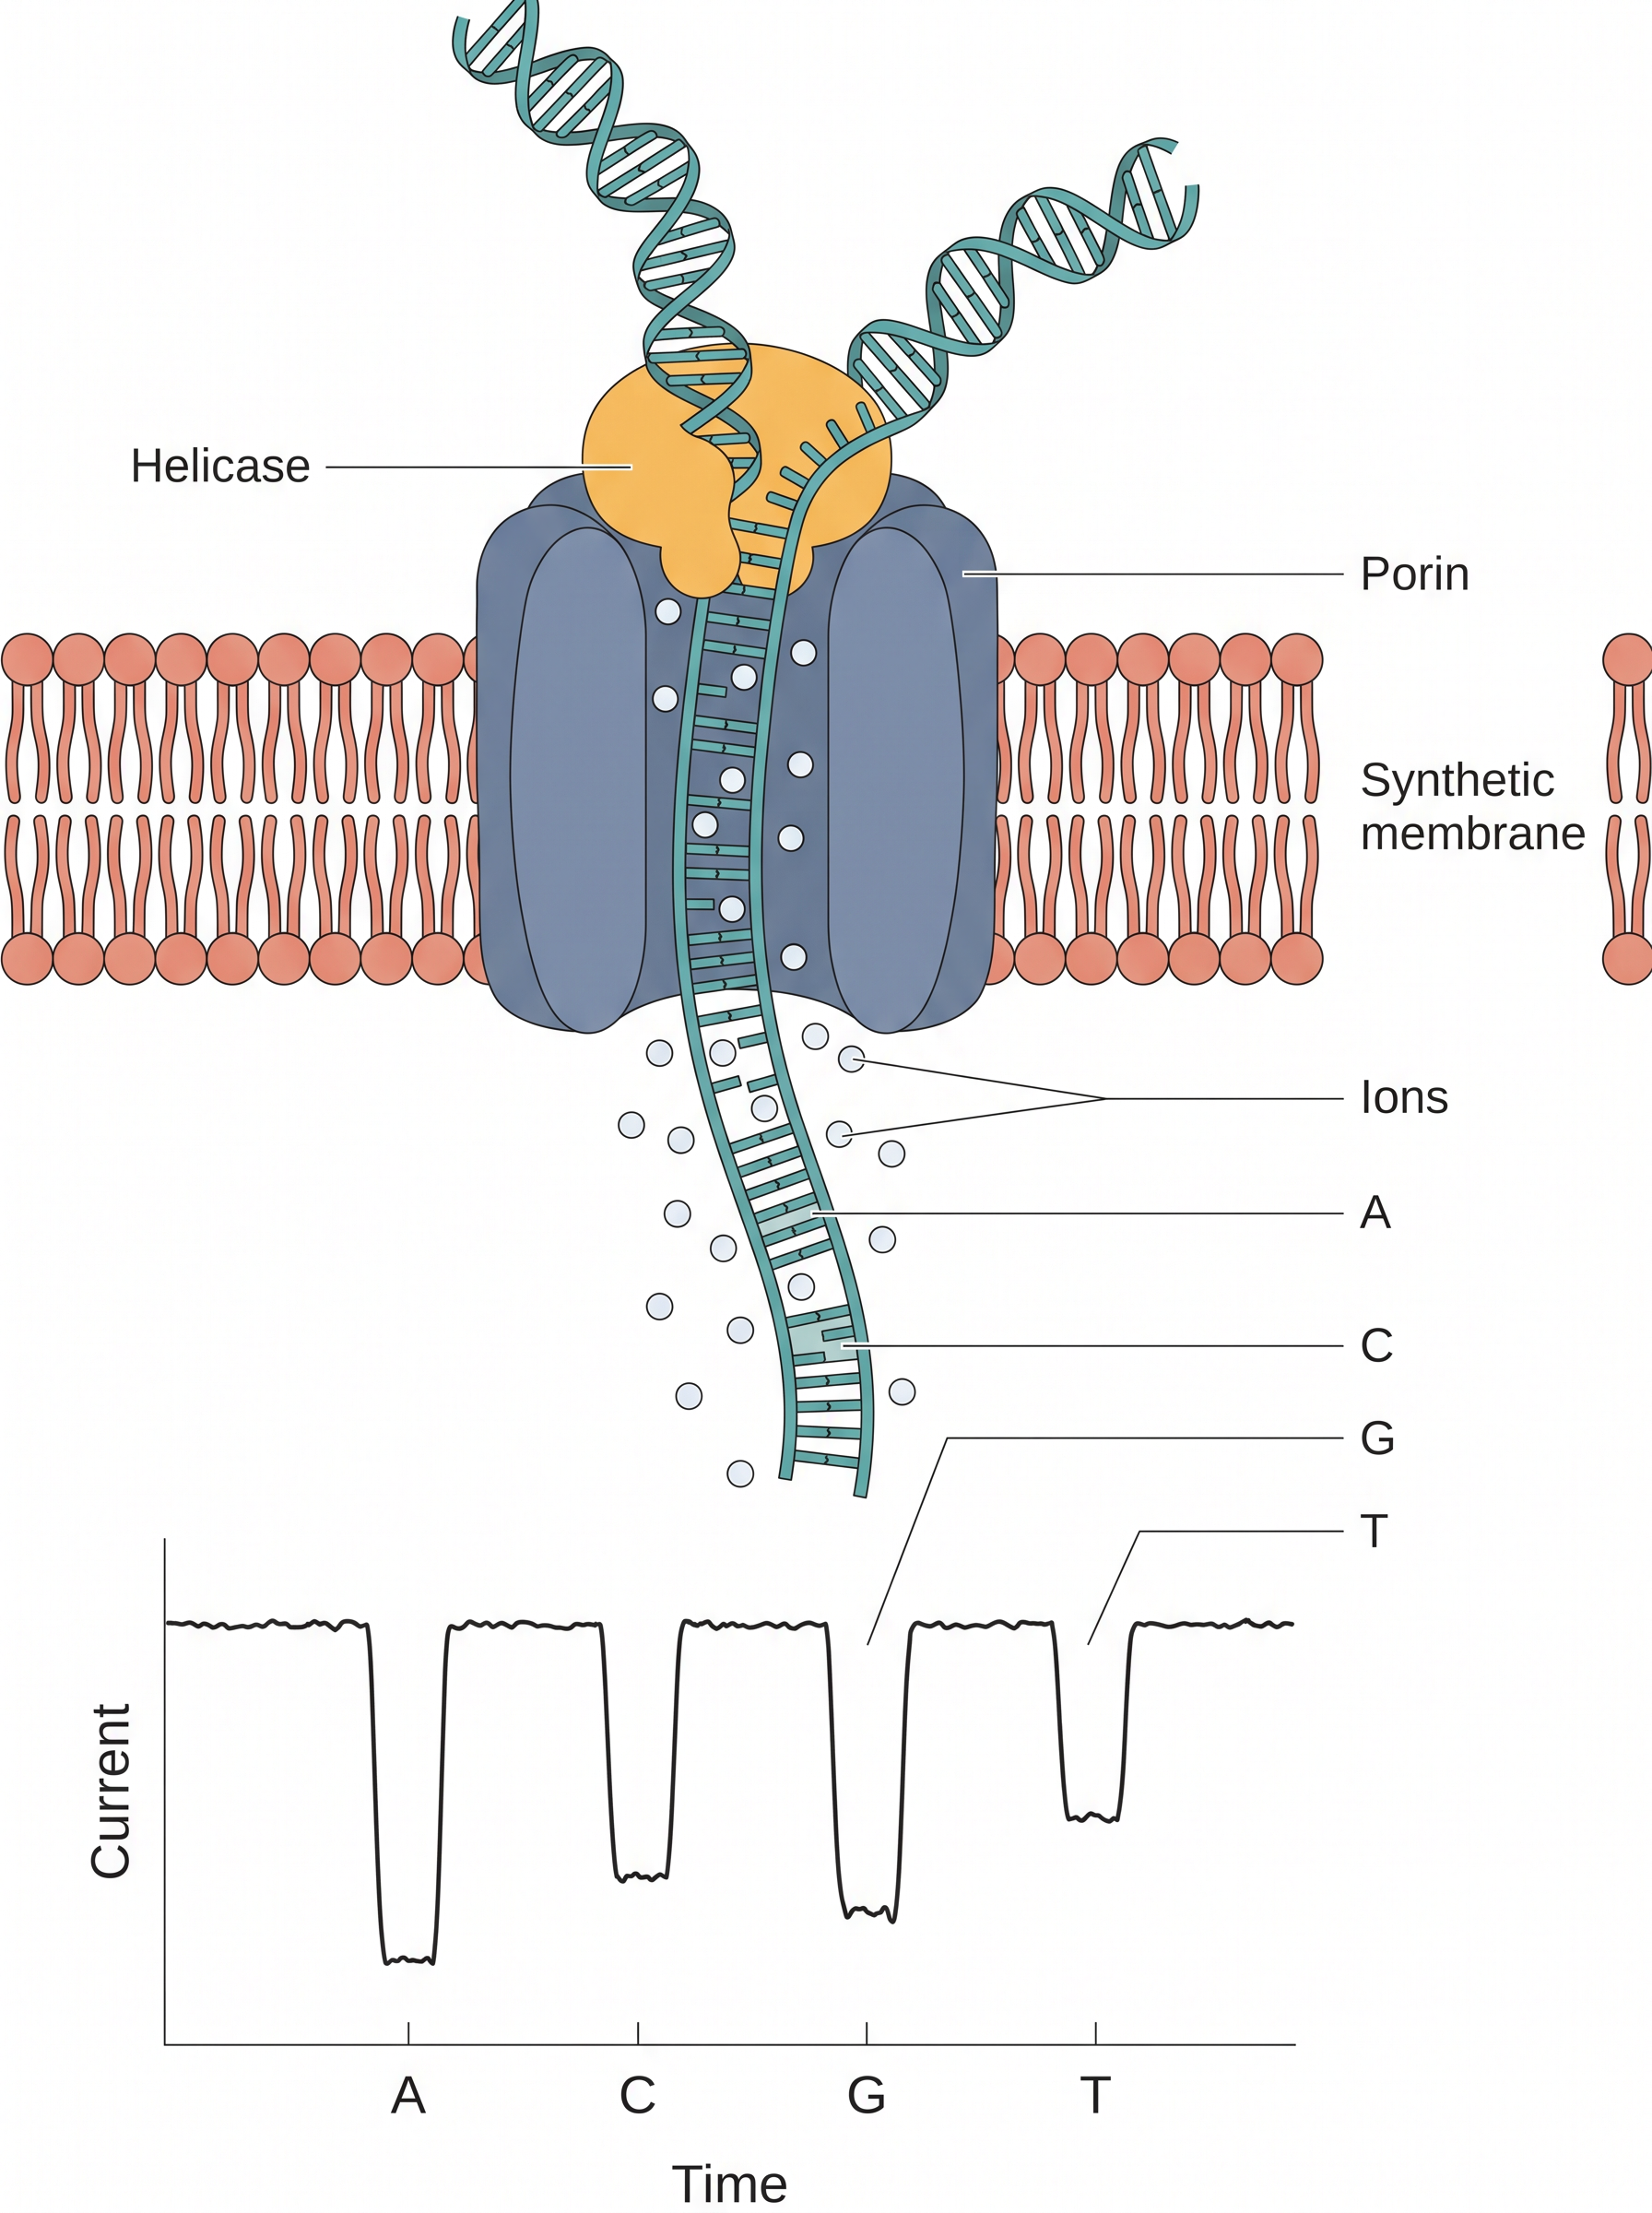
Fig. 5.10 – Nanopore based sequencing technology.
Fig. 5.10 also shows how the raw data look. The graph plots current on the vertical axis against time on the horizontal axis. The trace holds steady while the pore is open, then drops to a particular level as each base passes through, and the depth and shape of each dip identify the base. In the figure the sequence read in this way is ACGT.
The nanopore based sequencing technology offers rapid and simple sample processing, and it has the potential to display sequencing results in real-time. Together, these make it highly useful for genotyping even in a field setup. Real-time output changes what sequencing can be used for: a result that appears while the sample is still being read can guide a decision on the same day, instead of weeks later.
Another major advantage of nanopore sequencing is the production of very long sequencing reads — as long as 1 Mb, that is one million bases, or even more — at a relatively low cost. Long reads directly address the weakness of second generation short reads, because a read long enough to span a repeated region can be placed on the genome without ambiguity.
| Feature | First generation | Second (next) generation | Third generation (nanopore) |
|---|---|---|---|
| Method of reading | Sequencing by chain termination | Synthesis with fluorescently tagged dNTPs, one base at a time | Change in ionic current across a nanopore |
| Cloning needed | Yes — cloning and sub-cloning | No | No |
| Reactions at a time | Up to 96 capillaries | Millions, massively parallel | Single molecule through each pore |
| Read length | About 800–1000 bases | 75 to 300 bases | As long as 1 Mb or more |
| Output per run | Up to 96000 bases per machine | Very large, with high depth of coverage | Long reads, results in real-time |
| Main limitation | Time consuming, labour intensive, high cost | Very short reads | — |
5.3 Other Genome-related Technology
Genome sequencing comes in multiple flavours, or variations. These include whole genome sequencing (WGS), targeted sequencing, metagenomics, and others, as described in the following sub-sections.
The differences between them are not differences of chemistry. The machine and the reading method may be exactly the same in all three. What changes is the question being asked — whether we want to read everything, only a chosen part, or everything belonging to a whole community of organisms at once.
5.3.1 Whole Genome Sequencing (WGS)
WGS is a comprehensive method of determining the DNA sequence of the entire genome of an organism. Nothing is selected in advance and nothing is left out, which is why it is called comprehensive.
Using WGS, the first genome of Haemophilus influenzae was sequenced. That first complete genome mattered far beyond the organism itself, because it showed that a whole genome could be assembled from a large number of short pieces of sequence.
The availability of whole genome sequences is helpful in understanding the genetic regulation of inheritance, in the identification of genetic disorders that are inherited, and so on. Once every base of a genome is known, an inherited disorder can be traced to the exact change in the exact gene responsible for it.
Whole genome sequencing of the human genome started in 1990, and the complete sequence was published in 2003. Thirteen years and an international effort of many laboratories went into that single sequence.
With advances in sequencing technologies, as discussed in the previous section, it is now possible to sequence an entire genome in a few days. The whole genome sequence of a large number of microbes, animals and plants has already been obtained.
From sequence to patient care
Availability of the WGS can help to create personalised plans to treat human diseases. Two people with what looks like the same illness may carry different underlying genetic changes, and may therefore respond differently to the same drug.
Reading the variations in cancer cells can also help the physician to select the best chemotherapy. Cancer cells accumulate their own mutations, distinct from the patient’s inherited genome, and certain drugs work only against tumours carrying particular mutations. Sequencing the tumour turns the choice of drug from a guess into an evidence-based decision.
Two ways to assemble a genome
When a whole genome sequencing project uses a reference genome sequence — that is, an already sequenced and phylogenetically related genome sequence — to assemble its individual sequencing reads into a genome sequence, it is called reference based genome sequencing. The reference works rather like the picture on a jigsaw puzzle box: each read is matched to the place on the reference where it fits.
When no such reference is used, it is called de novo genome sequencing. Here the reads must be assembled purely by finding overlaps between them, with no picture to guide the work. It is far more demanding computationally, but it is the only option when the organism, or a close relative of it, has never been sequenced before.
| Feature | Reference based sequencing | De novo sequencing |
|---|---|---|
| Guide used for assembly | An already sequenced, phylogenetically related genome | None |
| How reads are placed | Matched to their position on the reference | Joined by finding overlaps between reads themselves |
| Computing demand | Lower | Much higher |
| Best suited for | Organisms whose relatives are already sequenced | An organism being sequenced for the first time |
| Main limitation | Can miss sequences absent from the reference | Assembly errors are harder to detect and correct |
5.3.2 Targeted sequencing
A targeted sequencing project is done to find out whether targeted regions of a genome carry variation or not. Instead of reading the whole genome, attention is fixed on the regions where the answer is expected to lie.
Such projects make use of an already sequenced genome as the reference genome sequence, in order to assemble the newly sequenced genome. A reference is essential here, because a handful of selected regions carry no information about where they belong; only the reference can tell us that.
Targeted sequencing focuses on the sequencing and analysis of a set of selected genes or genomic regions of the genome. It can be used to compare the smaller set of genomic regions among different genomes, to identify variations like mutations, insertions or deletions.
For this purpose, the target genomic regions are selected, isolated and then sequenced. Usually, PCR is used for this purpose, since a pair of primers designed to flank the chosen region will copy that region and nothing else, so what finally enters the sequencer is already enriched for the target.
Clinical exome sequencing
Clinical exome sequencing is also very similar to targeted sequencing. The exome is the protein-coding portion of the genome, which forms only a small fraction of the total DNA but carries a large share of the changes that cause disease.
Clinical exome sequencing is done for genes that are known to be disease associated, as reported and curated from databases like OMIM, HGMD, and others. Curated means the entries have been checked and maintained by experts, so the gene list used is not assembled casually.
Genetic diagnostic tests based on clinical exome sequencing are cost effective than whole genome sequencing. Reading a curated set of disease-associated genes means less sequencing, less data to analyse, and a faster result for the patient — with the accepted trade-off that a causative change lying outside the chosen genes will be missed.
Sequencing used to ask new questions
With the development of high-throughput DNA sequencing, DNA sequencing technology itself has been adapted to do much more than just reveal the genome sequence of an organism. One can use this technology to study the biology of an organism at the genome level. Some of the advanced applications of sequencing technologies are ChipSeq, RNASeq, and others.
ChipSeq sequencing projects are used to map the genome-wide DNA binding sites of a transcription regulator. A transcription regulator is a protein that binds DNA and switches transcription of a gene up or down.
Since transcription regulators play an important role in controlling the gene expression of one or more genes, ChipSeq projects are used to know the genome-wide DNA binding sites, as well as the target genes, of a transcription regulator. In other words, the sequencing machine is being used to answer a question about protein–DNA binding, not about the genome sequence itself.
RNASeq projects are carried out to study the global gene expression profile — the transcriptome — of an organism, a tissue or a sample. The transcriptome is the complete set of RNA molecules present in a cell or tissue at a given moment, and unlike the genome it changes with cell type, stage and condition.
Total RNA is extracted from the target sample and cDNA is synthesised, which is then sequenced using next generation sequencing technologies. cDNA, or complementary DNA, is DNA made from an RNA template using the enzyme reverse transcriptase; the conversion is necessary because the sequencing chemistry works on DNA, not on RNA.
The sequencing reads thus generated are mapped to the various genes on the genome, and the count of such reads mapping to those genes is in proportion to their expression. A gene that is being transcribed heavily contributes many RNA molecules to the sample, and therefore many reads; a gene that is silent contributes almost none. Counting reads is thus a way of measuring gene expression.
The complete RNASeq workflow is set out in Fig. 5.11.
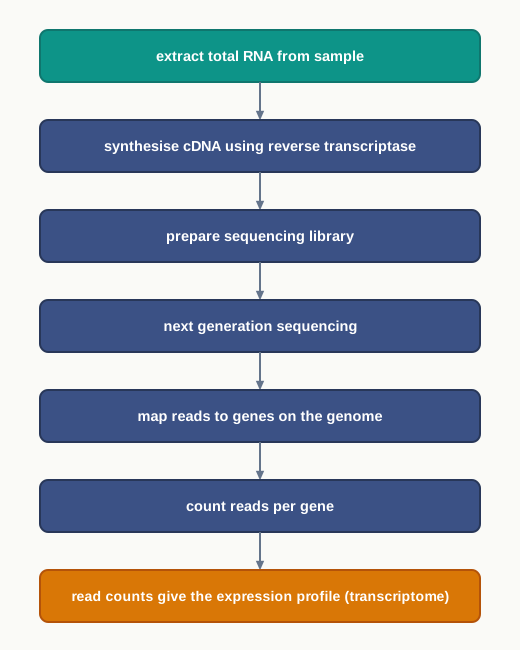
Fig. 5.11 – RNASeq workflow.
5.3.3 Metagenomics: Sequencing of DNA or cDNA present in a microbial community
Metagenomics projects are used to study the genomics of a community of organisms. Here, we do not separate the organisms or culture them individually.
That single sentence carries the whole significance of the field. The vast majority of microorganisms in nature cannot be grown in laboratory culture at all, and everything that could not be cultured was, for a long time, effectively invisible to microbiology. Metagenomics sidesteps the problem by never trying to culture anything.
Metagenomics, in fact, is the study of the total genetic material directly obtained from the microorganisms living in a particular environment — like the microbes living in the animal gut, or in any particular ecological environment. The DNA is extracted from the sample as it is, mixed genomes and all, and sequenced.
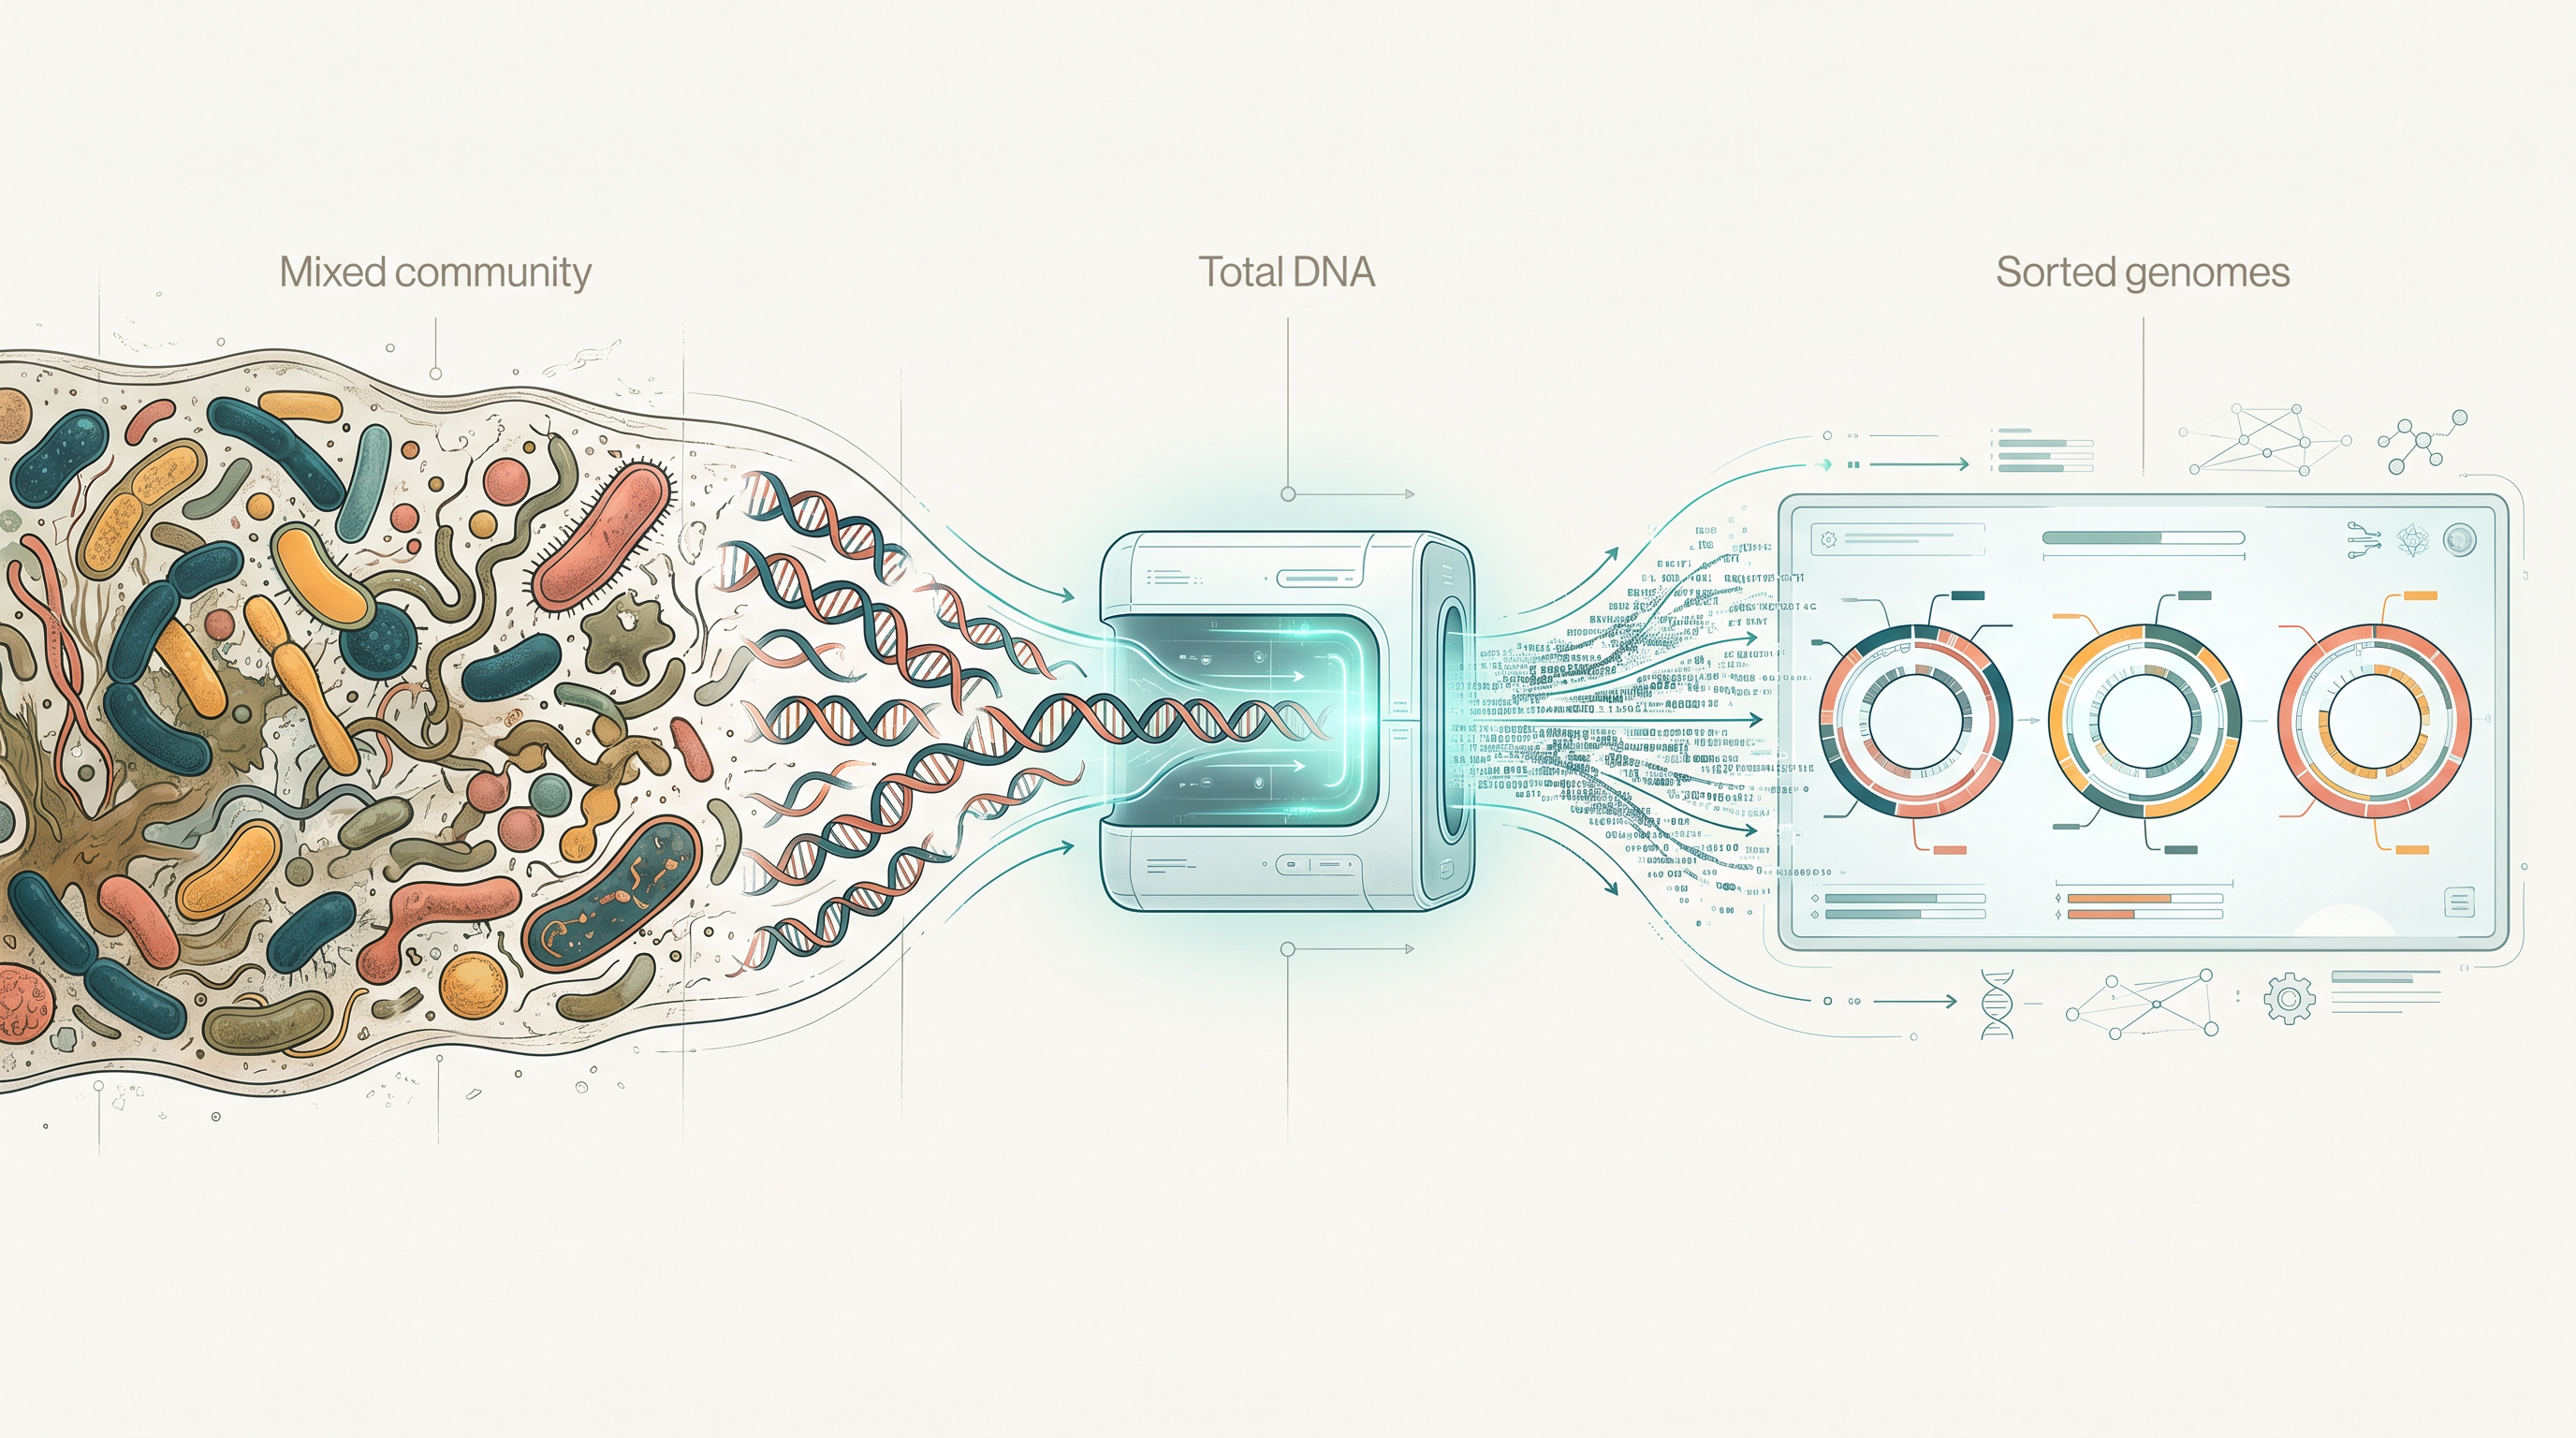
Fig. 5.12 – The metagenomics approach.
What metagenomics reveals
It has several applications in medical microbiology, agriculture, as well as environmental microbiology. In particular, it helps to study the diversity of microbial communities, and how the diversity of these microbes changes with changes in the environment. A shift in the microbial community can act as an early signal of change in the environment itself.
Metagenomics may also help in identifying novel genes or enzymes with significant industrial applications. For example, the study of microbial communities living in extreme environments, like high temperature sulphur springs, can help to identify novel enzymes that are resistant and functional at such high temperatures. An enzyme that works normally at the temperature of a hot spring is exactly the kind of enzyme an industrial process needs, since most ordinary enzymes would be denatured.
Thus, metagenomics has applications in understanding the genomes of gut microbes, throat microbes, microbes present on a toilet seat, and many more. It provides an insight into the genomes of diverse forms of microbes and their correlations with one another.
For example, the study of the genomes of diverse forms of viruses may provide an understanding about virus–host interaction, epidemiology, and also the evolution of viruses. Epidemiology is the study of how diseases spread through populations, and sequence data from many viral samples can show the path an infection has taken.
The presence of multiple genomes in a metagenomics sample creates special challenges in data analysis, and hence such projects require a different set of computing algorithms. In an ordinary sequencing project every read comes from one known organism; in a metagenomics project the machine hands over a mixture of reads from dozens of species at once, and the software must work out which read belongs to which organism before anything else can be concluded.
| Feature | Whole genome sequencing | Targeted sequencing | Metagenomics |
|---|---|---|---|
| What is sequenced | The entire genome of one organism | Selected genes or genomic regions of one organism | Total DNA or cDNA of a whole microbial community |
| Organisms cultured first | Yes, a pure sample is needed | Yes | No, organisms are neither separated nor cultured |
| Reference genome | Used in reference based work, not in de novo work | Essential | Not available for most members of the community |
| Relative cost | Highest | Lower, cost effective for diagnostics | Depends on community complexity |
| Typical use | Personalised treatment plans, inherited disorders | Detecting mutations, insertions or deletions; clinical exome tests | Microbial diversity, novel industrial enzymes, viral epidemiology |
5.4 Genome Engineering
This technology is used to modify the genome. It is often carried out to introduce or remove one or more genes.
The goal of this engineering is to introduce a new functionality, or to modify or remove an existing functionality, of a biological organism. Reading a genome, as the previous sections described, is an act of observation; engineering a genome is an act of deliberate change.
In this section we would get a glimpse of the approaches that have been used to engineer a genome. One of the approaches uses a transposon, or jumping gene, to inactivate or delete a gene or genes in a genome. Another approach is to edit the genome without introducing any additional unwarranted changes in it.
That contrast between the two approaches is worth holding on to as you read. The transposon approach borrows a natural element that inserts itself and disrupts whatever it lands in. The editing approach aims for something far more disciplined — a change at exactly one chosen place, and nowhere else.
5.4.1 Knock-out and knock-in of a gene by transposon insertion
Transposons are DNA sequences, also known as ‘Jumping Genes’, that move from one location to another on the genome. They are found in almost all organisms, both prokaryotes and eukaryotes, which tells us that this ability to move is very ancient.
A DNA transposon generally moves by a ‘cut and paste’ mechanism, in which the transposon is excised from one location and integrated elsewhere in the genome. The element is therefore not copied and left behind; it leaves its original site and takes up residence at a new one.
Many a time, such movement of a DNA segment results in the insertional inactivation of a gene located at the site of insertion. Think about what an extra block of DNA dropped into the middle of a gene must do to the reading of that gene: the codons downstream of the insertion no longer line up as they did, and the message becomes unreadable.
This behaviour of a transposon is exploited to knock-out an existing gene. In such a strategy, the transposon is engineered, so that it recognises a specific sequence of a target gene, where it gets inserted. This engineering step is what turns a random natural event into a controlled experiment — the element no longer lands wherever chance takes it, but at the gene the investigator has chosen.
Once the transposon is inserted at the target site, the coding frame of the target gene is disrupted, and therefore it can no longer produce the original transcript required to code for the gene product (Fig. 5.13).
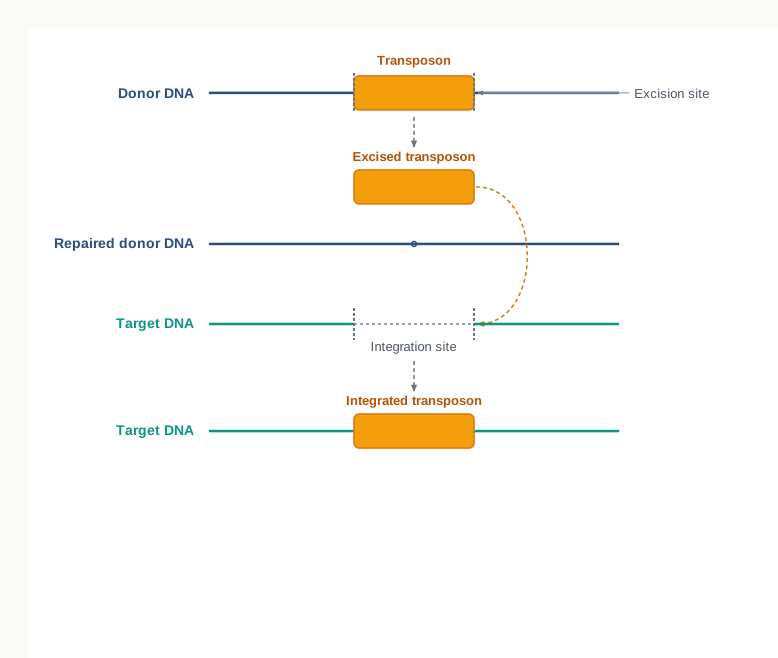
Fig. 5.13 – Genome engineering through transposition.
Follow Fig. 5.13 from top to bottom as a sequence of events. The transposon first sits in the donor DNA between two excision sites. It is then cut out at those sites, leaving the donor DNA behind. Finally the excised transposon integrates at the integration site of the target DNA, so that the target now carries a block of DNA it did not have before.
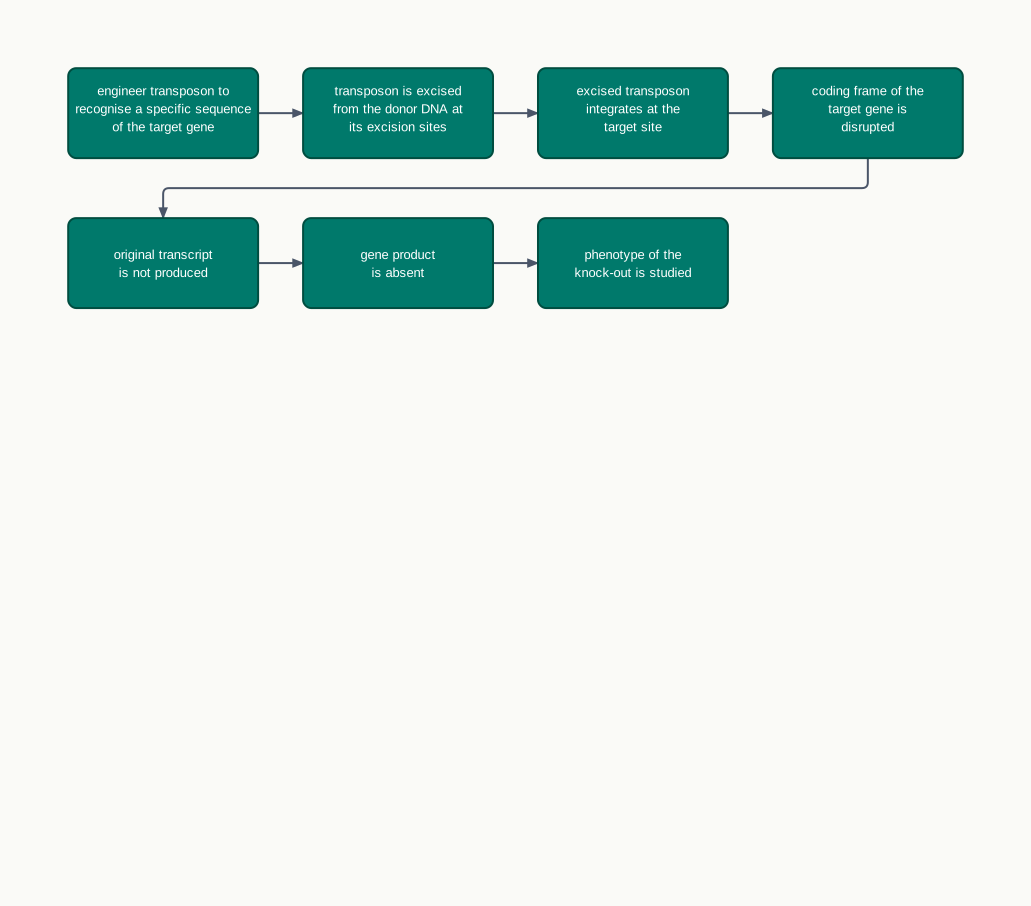
Fig. 5.14 – Gene knock-out by transposon insertion.
Turning insertion into an addition
In certain cases, when a transposon gets inserted at a particular site, it alters the genetic locus of interest in a different way — the insertion results in the addition of a DNA sequence that was not present on the said genetic locus. This property of a transposon is used for the knock-in of a functional gene.
The same event, insertion, is therefore being put to two opposite uses. If the insertion lands inside a gene and wrecks its reading frame, the result is a knock-out. If the inserted DNA itself carries a working gene placed at a chosen locus, the result is a knock-in.
| Feature | Knock-out | Knock-in |
|---|---|---|
| What happens to the target gene | Its coding frame is disrupted by the insertion | A new, functional DNA sequence is added at the locus |
| Effect on the gene product | Original transcript, and hence the product, is not made | A functional gene product is now produced from the added sequence |
| Question it answers | What does the organism lack when this gene is silenced? | What happens when this function is supplied at this locus? |
| Typical purpose | Working out the normal role of a gene | Supplying or replacing a function in a model organism |
This knock-in and knock-out technology helps in the generation of animal and plant models to understand the molecular basis of disease, and in the development of new drugs for that disease. A model organism carrying a knocked-out gene shows what goes wrong in its absence, and a candidate drug can then be tested on an animal that reproduces the disease in a controlled and repeatable way.
5.4.2 Genome editing using Clustered Regularly Interspaced Short Palindromic Repeats (CRISPR-Cas9)
Genome editing is a set of techniques or technologies that can be used to change the DNA of an organism by adding, removing or altering the specific DNA sequence of the genome. The word specific is the whole point — the change is made at a chosen address, not wherever an element happens to land.
Like restriction enzymes, this technique is a biotechnological adaptation, or repurposing, of a naturally occurring genome editing system present in bacteria. This is a recurring pattern in biotechnology and worth noticing as such: the most powerful tools of the laboratory are very often natural systems taken from microorganisms and put to a new use.
In its natural context, this system is used to memorise the DNA signature of past viral attacks, so that any subsequent viral infection carrying a matching DNA signature on the viral DNA can be countered or destroyed effectively. In other words, the bacterium keeps a record of its enemies, and this record functions as a primitive kind of immune memory.
How the editing is carried out
In this approach, a guide RNA is designed and produced in the cell, along with the Cas9 endonuclease. The guide RNA is required for positioning the Cas9 endonuclease at the location where the DNA is required to be edited or engineered.
The guide RNA is best understood as a molecule with two ends doing two different jobs. Part of the guide RNA is complementary to the DNA sequence where the sequence needs to be edited, and this part finds the target by base pairing. The other part of the guide RNA attracts and binds to the Cas9 endonuclease, and this part brings the cutting enzyme along.
Once this whole complex — the guide RNA bound to the target DNA, together with Cas9 — is assembled, a double strand break is introduced in the DNA by the endonuclease (Fig. 5.15). A double strand break means both strands of the DNA helix are cut across at the same position, which the cell treats as serious damage that must be repaired at once.
The broken DNA then undergoes a template based homologous DNA repair, in which a modified or edited DNA template is provided that carries the desired changes, that is, the edited sequence. The cell repairs the break by copying from the template supplied to it, and in doing so it writes the intended change into its own chromosome.
As a consequence of such a double strand break followed by template guided DNA repair, the repaired genomic DNA now possesses an edited DNA sequence. Notice the elegance of the strategy: the tool does not write the new sequence itself: it only makes a precise cut, and the cell’s own repair machinery does the writing.
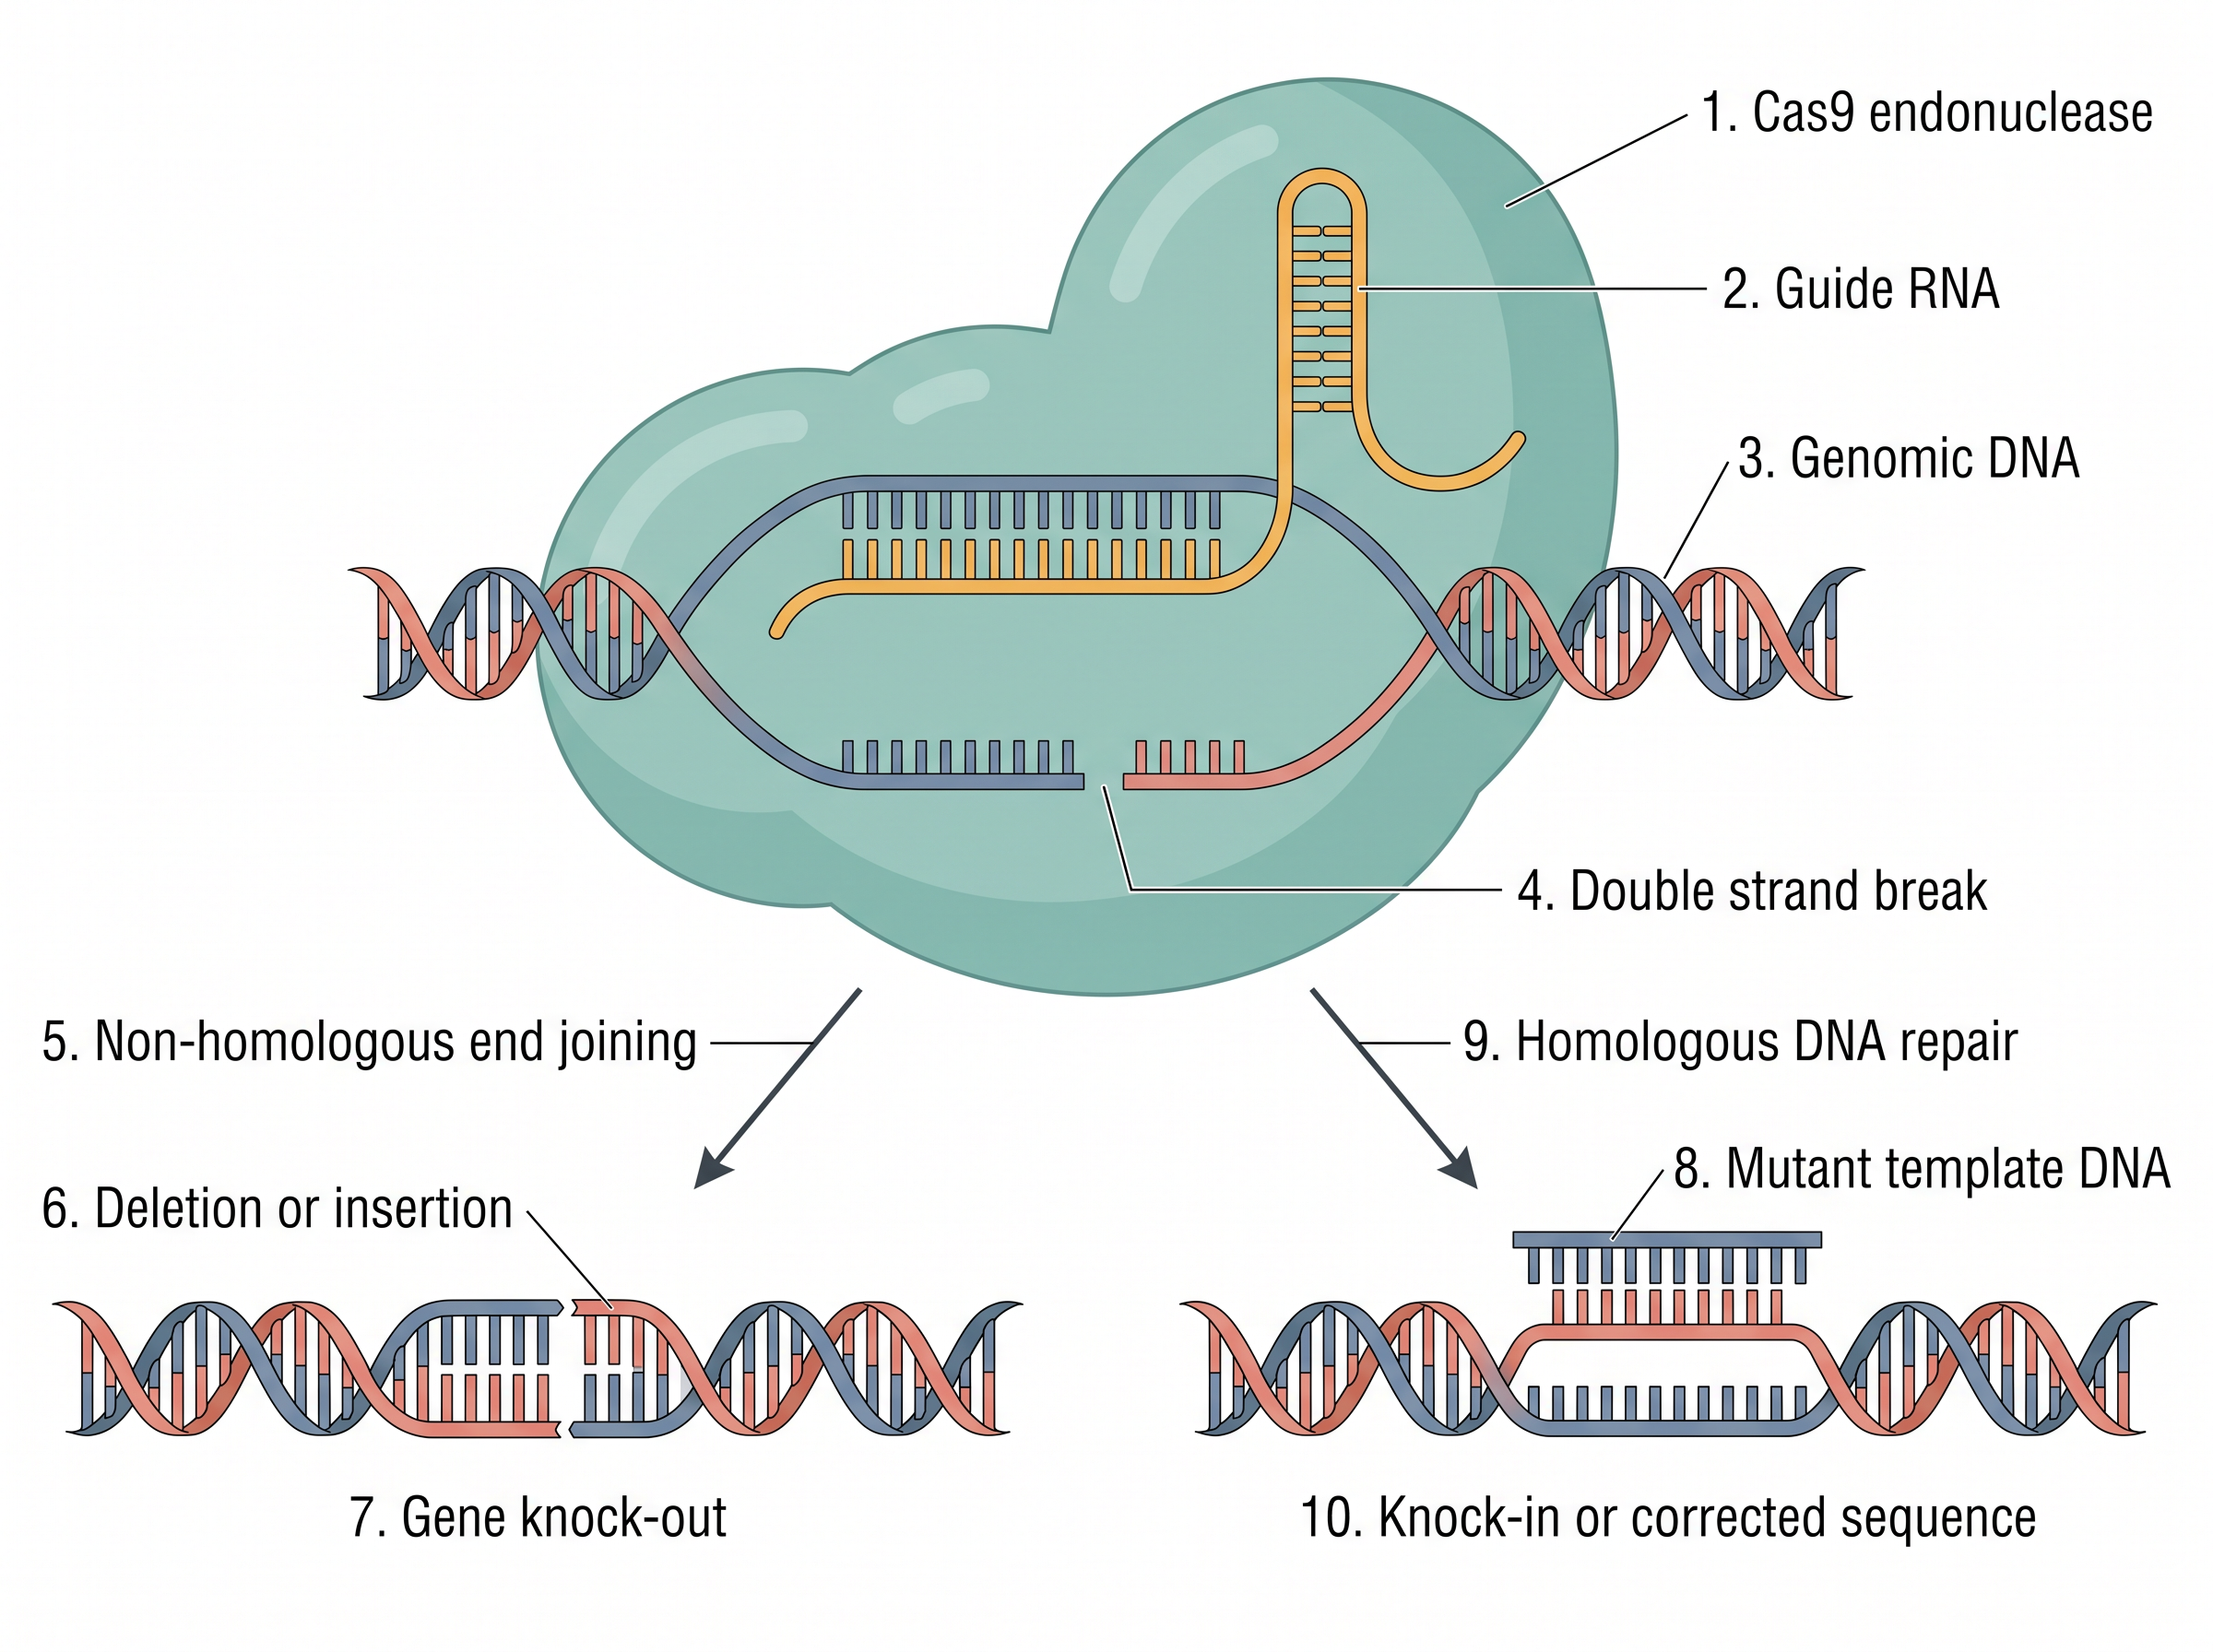
Fig. 5.15 – Gene editing using CRISPR-Cas9 technology.
Fig. 5.15 shows that what happens after the cut decides the outcome, and the figure branches accordingly. If the broken ends are simply rejoined by non-homologous end joining, small deletions or insertions occur at the join, and the result is a gene knock-out. If a desired mutant copy is supplied around the break site, homologous recombination uses it as a template and introduces those mutations at that exact place in the genomic DNA, giving a knock-in or a corrected sequence.
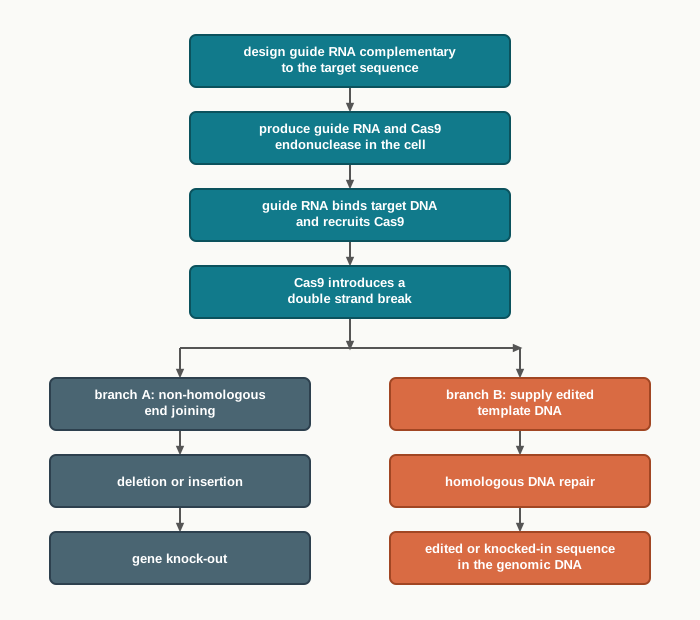
Fig. 5.16 – CRISPR-Cas9 genome editing.
| Feature | Transposon insertion | CRISPR-Cas9 editing |
|---|---|---|
| Natural origin of the tool | Jumping genes present in almost all organisms | Bacterial system that memorises the DNA signature of past viral attacks |
| How the target is found | The transposon is engineered to recognise a specific sequence | A guide RNA base pairs with the target sequence and brings Cas9 to it |
| Nature of the change | A whole DNA element is inserted at the site | A double strand break is made; the cell’s repair machinery makes the change |
| Precision | The insertion adds extra DNA at the locus | Editing can be done without additional unwarranted changes in the genome |
| Typical outcomes | Knock-out by insertional inactivation; knock-in of a functional gene | Knock-out by non-homologous end joining; knock-in or correction by homologous repair |
The concept of CRISPR-Cas9 was modified from naturally occurring ancient bacterial immune systems. Bacteria use CRISPR-Cas systems to recognise and cut the DNA of invading viruses into inactive segments, and records of these viral sequences are held in CRISPR arrays. This effectively disables the virus and contributes to the immune ‘memory’ of the bacterium. While studying Streptococcus pyogenes in 2011, Dr Charpentier discovered a new molecule in the CRISPR-Cas system, called tracrRNA, and started a collaboration with Dr Doudna to reprogram the CRISPR system. Together, they discovered that CRISPR could be directed to cut DNA at target sequences using the Cas9 protein. This allowed genetic material to be subsequently added, deleted or changed as desired, using the cell’s own DNA repair machinery. Researchers can use this technique to modify the DNA of a living organism with extremely high precision. This specialised gene editing tool allows very small and precise changes to be made to the genetic code; it can halt a disease that causes premature ageing in a mouse model and double the lifespan of the treated animals.
5.5 Structural, Functional and Comparative Genomics
Next generation sequencing projects generate a large volume of data that requires extensive computing for data analysis. Once a machine can read millions of fragments in parallel, the bottleneck shifts from the laboratory bench to the computer: the sequence exists, but its meaning does not yet.
Computational genomics is a field that uses high performance computing clusters and workstations to analyse genomics data, including the data generated by sequencing technology. A cluster is a group of computers linked to work on one problem together, which is necessary because a single ordinary machine cannot hold or process data of this size in reasonable time.
Computational genomics helps in understanding the functions of the genome, based on computational and statistical analysis, in order to decipher biology from genome sequences and related data — data based on DNA and RNA sequences, as well as other experimental data.
From raw sequence to biological meaning
With the increasing number of genome sequences of different organisms available, one major step is the identification of common genes through homology search and gene annotation, that is, assigning functional value. Homology means similarity of sequence arising from shared ancestry, and it is the basis of a very useful shortcut: if a newly sequenced gene closely resembles a gene whose function is already known in another organism, a likely function can be assigned to it without any new experiment.
Secondly, sequence comparisons across multiple sequences can be carried out by advanced computational genomics tools, such as BLAST, ClustalW and Phylip, in order to understand evolutionary relationships. Comparing many sequences at once shows which stretches have stayed the same across species and which have changed, and the pattern of that change carries the record of evolutionary descent.
Rapid progress in the field has led to advancements in structural genomics, which deals with the three dimensional information of the proteins encoded by the genome.
The general pipeline that takes a project from a sequencing machine to a biological conclusion is set out in Fig. 5.17.
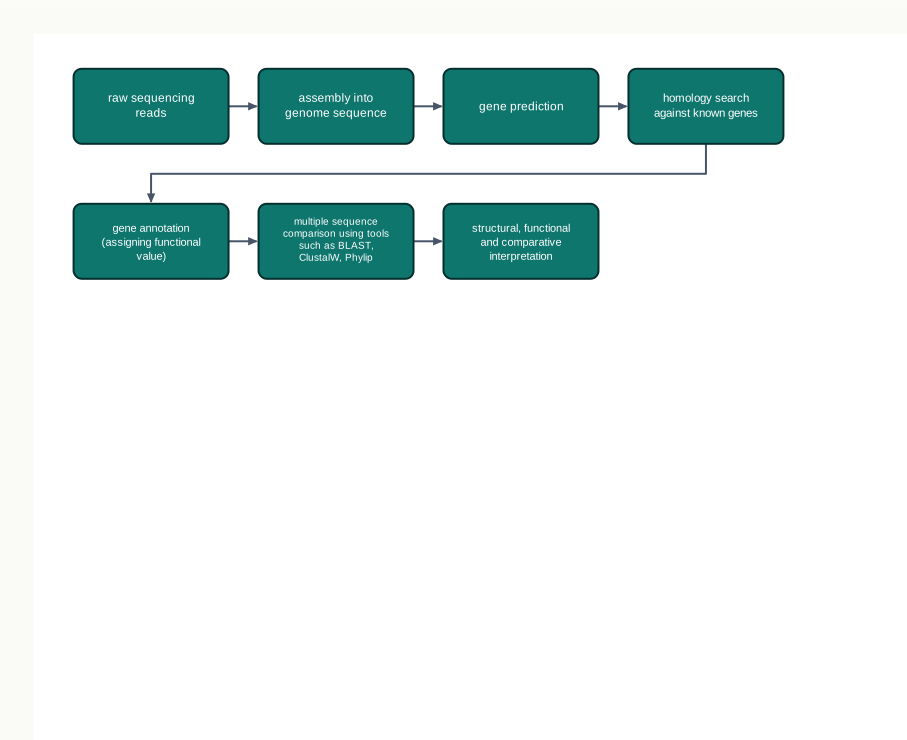
Fig. 5.17 – Computational genomics pipeline.
Computing power behind genomics
Advancements in the area of powerful computer graphics processing units (GPU) and graphic cards have been utilised for scientific computing, including computational genomics, to bring high performance computing for accelerated data analysis. This is done through General purpose GPU (GP-GPU) programming and Computer Unified Device Architecture (CUDA) programming.
A graphics processing unit was originally designed to draw images on a screen, a task that requires the same simple calculation to be performed on very many pixels at once. Genomic analysis has much the same shape — the same comparison repeated over millions of reads — which is why hardware built for graphics turned out to suit genomics so well.
Genomics facilities in India
Genomics work is capital intensive. Sequencing machines, computing clusters and trained staff all represent large investments, which no single small laboratory can easily make.
Since genomics has become a major tool to study biology and has a profound effect on biotechnology, the Department of Biotechnology, under the Ministry of Science and Technology, Government of India, has taken an initiative to establish three National Genomics Core facilities in India. These facilities would help Indian scientists and entrepreneurs to execute their genomic projects.
These facilities are located within two national laboratories — the Centre for DNA Fingerprinting and Diagnostics, Hyderabad, and the National Institute of Biomedical Genomics, Kalyani — and one university, the University of Allahabad, Prayagraj. Shared national facilities of this kind allow expensive infrastructure to be used by many research groups instead of lying idle in any one of them.
5.5.1 Structural genomics
Structural genomics means two different things to two different sets of people. This is one of the few places in the chapter where a single term genuinely carries two meanings, so it is worth learning both.
For those who are interested in protein structure, it refers to the 3D structure of every protein encoded by a particular genome. For those who are interested in chromosome organisation, it refers to the physical nature of the whole genome.
Earlier, the focus of structural genomics, as defined by the structural genomics consortium, was to search for new protein folds or structures in newly sequenced genomic DNA. A fold is the characteristic three dimensional shape into which a polypeptide chain arranges itself, and it matters because the shape of a protein determines what it can bind and what it can do.
Through this approach, scientists address the need for solving more protein structures, especially of proteins whose sequences are of unknown fold types. A sequence that resembles nothing already solved is exactly the one whose structure cannot be predicted and must therefore be determined.
An expanded view of structural genomics includes the study of the structural organisation of DNA regions in the chromosome, and the nucleosome status of the genome. A nucleosome is the basic packing unit of eukaryotic DNA, in which the DNA is wound around a core of histone proteins; how tightly a region is packed influences whether the genes in it can be transcribed at all.
This expanded view also includes the study of large structural changes in the genome organisation of related species. An interesting example is to see how genes that are common between mice and human beings are redistributed across the different chromosomes of the two species.
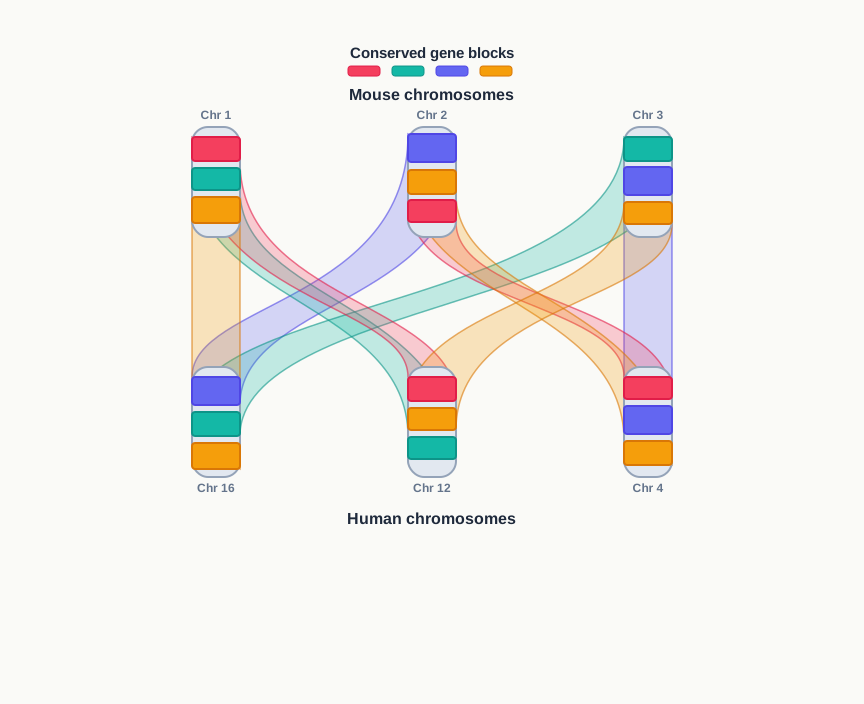
Fig. 5.18 – Gene redistribution across chromosomes in mice and humans.
Fig. 5.18 is read by following the connecting lines. Blocks of the same colour contain the same genes in both species, but a block sitting on one mouse chromosome may correspond to a block on a quite different human chromosome. The genes have been conserved; their arrangement into chromosomes has not.
5.5.2 Functional genomics
Functional genomics aims to understand how the physiological function information encoded in the genome is executed. The genome is a set of instructions; functional genomics asks what actually happens when those instructions are carried out in a living cell.
A set of genomics based tools and techniques — such as RNAseq, ChipSeq and metagenomics of microbial communities, all of which you met in Section 5.3 — are used to understand the physiological and pathological function associated with the state of a cell.
Notice why these particular tools belong here. Each of them reports on activity rather than on sequence alone: RNAseq reports which genes are being expressed, ChipSeq reports where a transcription regulator is binding, and metagenomics reports what a whole community of organisms is capable of doing in its environment.
The word pathological in that description is important too. The same techniques applied to a diseased cell and to a healthy cell of the same tissue reveal which functions have gone wrong, which is the starting point for understanding a disease at the molecular level.
5.5.3 Comparative genomics
Comparative genomics deals with the comparison of genes and genomes of multiple species, or of multiple individuals within the same species. Both comparisons are useful, but they answer different questions — comparison across species speaks to evolution, while comparison within a species speaks to variation between individuals.
It can help in the genome annotation of a newly sequenced genome, based on its comparison with a related, well-known genome. A genome that has already been carefully annotated acts as a guide for annotating a new one.
It can also help identify the set of common genes that form the core genome, and the other genes that are unique to a species. The core genome is the set shared by all the organisms being compared, and it tends to contain the genes needed for basic survival.
The genes unique to a species may be responsible for the unique behaviour or function of that particular species. This is a satisfying idea to hold on to: what makes one species different from another is not the long list of genes they share, but the smaller set that only one of them carries.
Comparative genomics may also identify whether a functional molecule is present or absent in a genome. If the gene for an enzyme cannot be found anywhere in a genome, that organism almost certainly cannot carry out the reaction the enzyme performs.
It may also be used as a starting point for genome based taxonomy and phylogenetic lineage study. Taxonomy is the classification of organisms and a phylogenetic lineage is the line of evolutionary descent; basing both on whole genome comparison gives far more evidence to work from than external features alone.
| Feature | Structural genomics | Functional genomics | Comparative genomics |
|---|---|---|---|
| Central question | What is the shape of the encoded proteins, and how is the genome physically organised? | How is the function encoded in the genome actually executed? | How do genes and genomes differ between species or individuals? |
| Main focus | 3D protein structures and folds; organisation of DNA in chromosomes, nucleosome status | Physiological and pathological function associated with the state of a cell | Core genes shared by species and genes unique to one species |
| Typical tools | Protein structure determination, study of genome organisation | RNAseq, ChipSeq, metagenomics | Sequence comparison tools such as BLAST, ClustalW, Phylip |
| Typical outcome | New protein folds solved; large structural changes between related species described | Genes linked to cell state and disease | Genome annotation, genome based taxonomy, phylogenetic lineage study |
5.6 Protein Engineering
In this unit we would learn about another advanced usage of rDNA technology — one that can be used to create and produce engineered proteins having an additional or extended property, as compared to the original protein.
The idea rests on a link you have met throughout biology: the sequence of amino acids in a protein determines the shape it folds into, and that shape determines what the protein can do. Change a chosen amino acid, and the property of the protein changes with it.
The engineered proteins may have greater stability when exposed to elevated temperature, a change in pH, the presence of salts, or an organic solvent. These are exactly the conditions a protein meets outside the body — inside a washing machine, an industrial reactor or a diagnostic kit — and a natural protein, evolved for conditions inside a cell, is often destroyed by them.
Proteins can also be engineered to develop and produce novel reagents for research, diagnostics and therapeutics. In other words, protein engineering is not limited to repairing weaknesses; it can add properties that the natural protein never possessed at all.
5.6.1 Applications of protein engineering
To engineer a protein, the critical amino acids responsible for the desired trait are first identified. This identification is the hardest and most important step, because a protein may contain hundreds of amino acids while only a few of them actually govern the property in question.
The codon sequences for those amino acids on the gene are then modified by creating point mutations, so that the amino acid can be mutated or replaced by another amino acid that modulates the desired activity. A point mutation is a change at a single position in the DNA sequence, and because a codon of three bases specifies one amino acid, altering a codon replaces exactly one amino acid in the protein.
Notice that the change is always made in the gene, never in the protein itself. The protein is not chemically modified in a tube; the instruction is rewritten, and the cell then manufactures the new protein from the corrected instruction, over and over again.
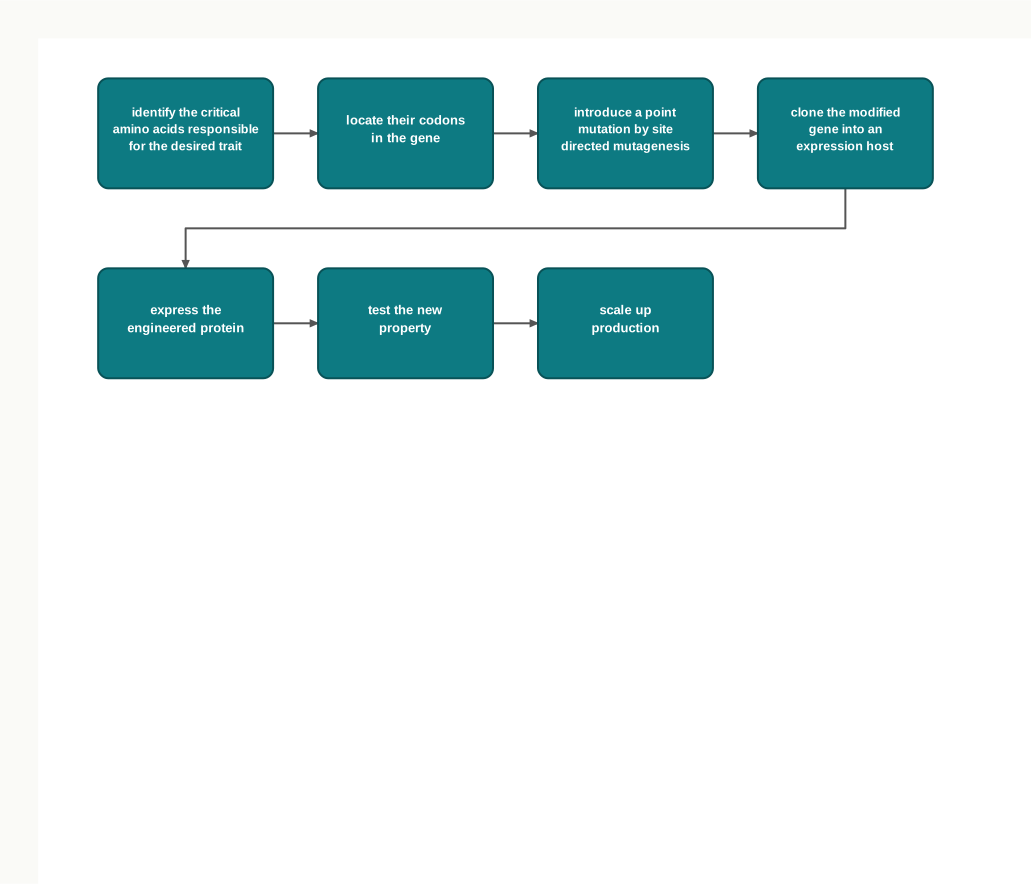
Fig. 5.19 – General protein engineering workflow.
Let us now discuss some examples of engineered proteins.
1) Recombinant protein to improve cleansing action of detergent
Subtilisin is a proteolytic enzyme that is added to detergents to hydrolyse the protein component of dirt. Many everyday stains — blood, egg, milk, gravy — are protein in nature, and breaking those proteins into small soluble fragments is what allows them to be washed away. This improves the cleansing action of the detergent.
The catalytic triad of subtilisin is Ser 221, His 64 and Asp 32. A catalytic triad is a set of three amino acid residues that sit close together in the folded protein and act jointly at the active site, even though they lie far apart along the amino acid chain. The numbers give the positions of these residues in the sequence.
However, in the presence of bleach, Met 222 is oxidised, and this leads to reduced action of subtilisin. Bleach is an oxidising agent, and methionine is one of the amino acids most easily oxidised. Met 222 sits immediately next to Ser 221 of the catalytic triad, so damage to it disturbs the active site and the enzyme loses activity — which is a real problem, since bleach and protein-digesting enzymes are frequently present in the same detergent.
If the codon for Met 222 is replaced by the codon for Ala by a point mutation, using site directed mutagenesis — a process by which a point mutation can be introduced at a specific site — the engineered protein becomes stable even in the presence of bleach (Fig. 5.20). Alanine has a small, simple side chain that cannot be oxidised, so the vulnerable point is removed while the catalytic triad itself is left untouched.
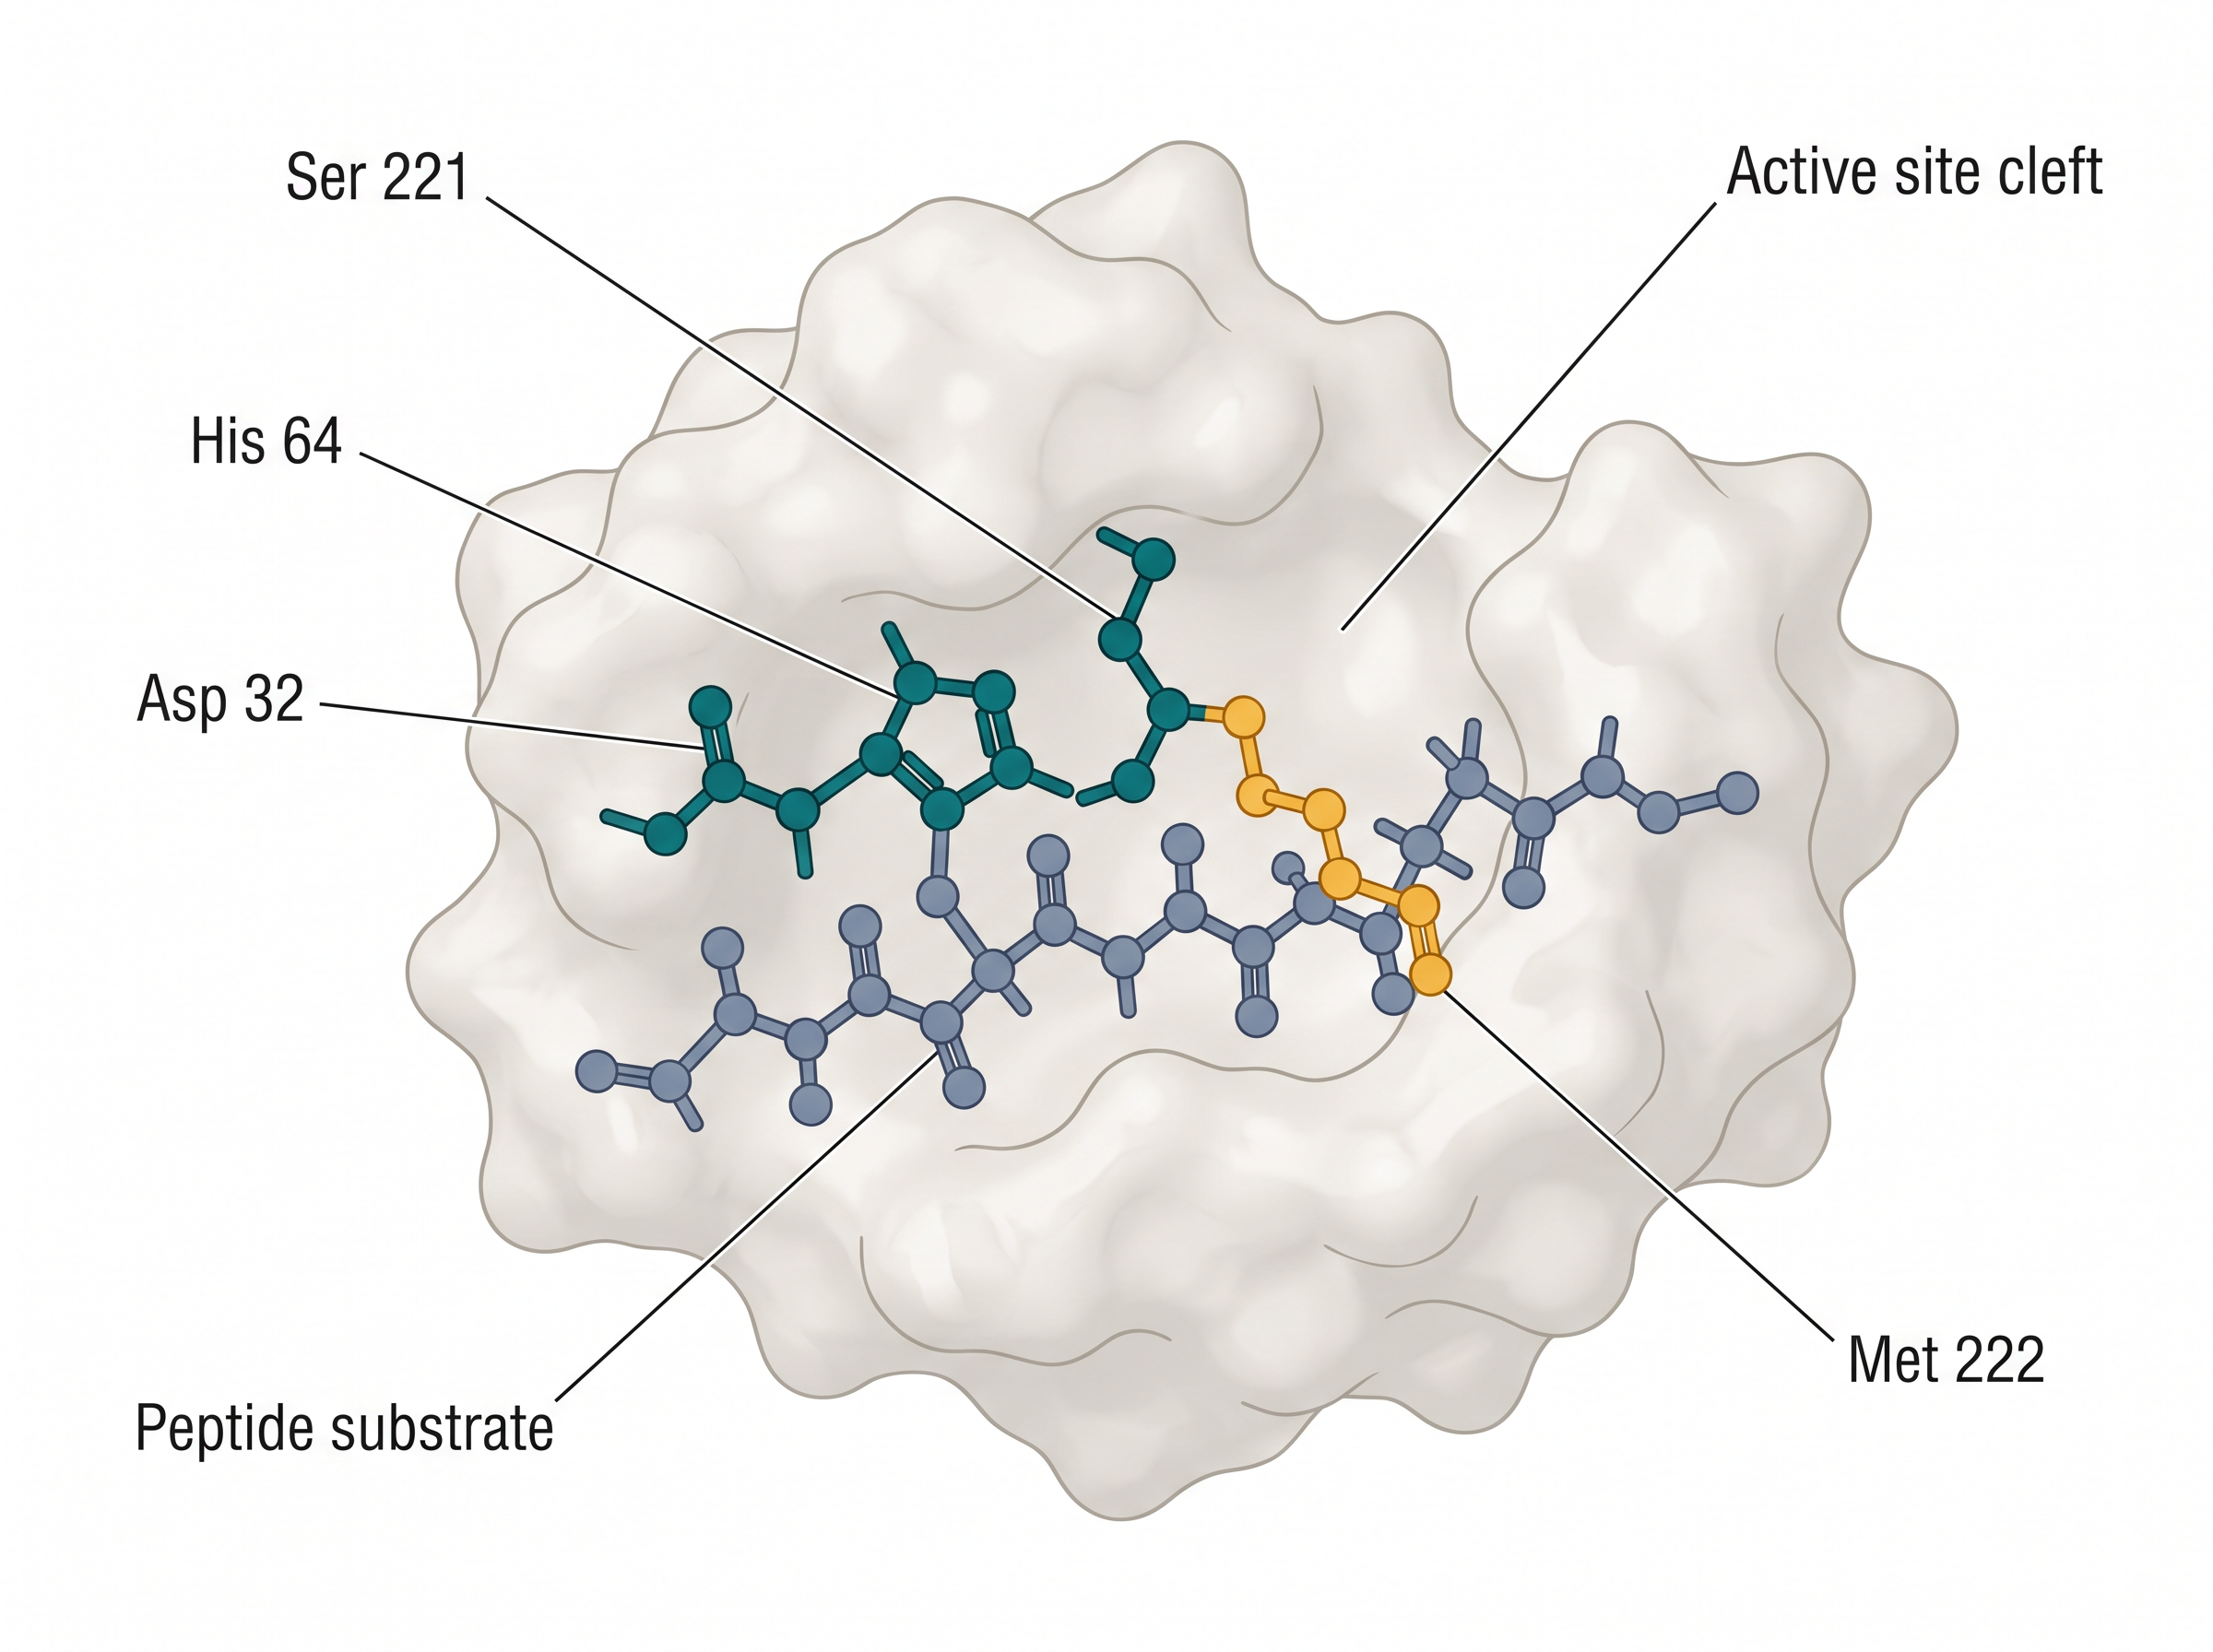
Fig. 5.20 – Catalytic triad in subtilisin.
2) Recombinant protein for protein purification
A peptide with six consecutive His amino acids, called the 6-His-Tag, can bind to metal ions like Nickel, Zinc and Cobalt with great affinity at mildly alkaline pH. Histidine side chains coordinate metal ions, and six of them in a row bind far more strongly than any one alone. This property of the 6-His-tag is exploited for the purification of recombinant protein.
The purification problem is worth stating plainly. When a recombinant protein is expressed in a host cell, it is produced inside a cell already crowded with thousands of the host’s own proteins, and it must somehow be separated from all of them.
DNA encoding for the 6-His-tag is fused with the gene sequence of the recombinant protein of interest. Because the tag is added at the DNA level, every molecule of the protein the cell makes carries the tag automatically — there is no separate labelling step afterwards.
During protein purification by affinity chromatography, the 6-His-tagged recombinant protein will be immobilised by the presence of metal ions in the agarose gel. Affinity chromatography is a separation method in which the molecule of interest is held back by its specific binding to a partner fixed on the column, while everything else flows past.
All other proteins will be removed by washing the gel, since they have no tag and therefore nothing to hold them. The 6-His-tagged recombinant protein can then be eluted by using an elution buffer, which breaks the interaction between the tag and the metal ions and releases the pure protein (Fig. 5.21).
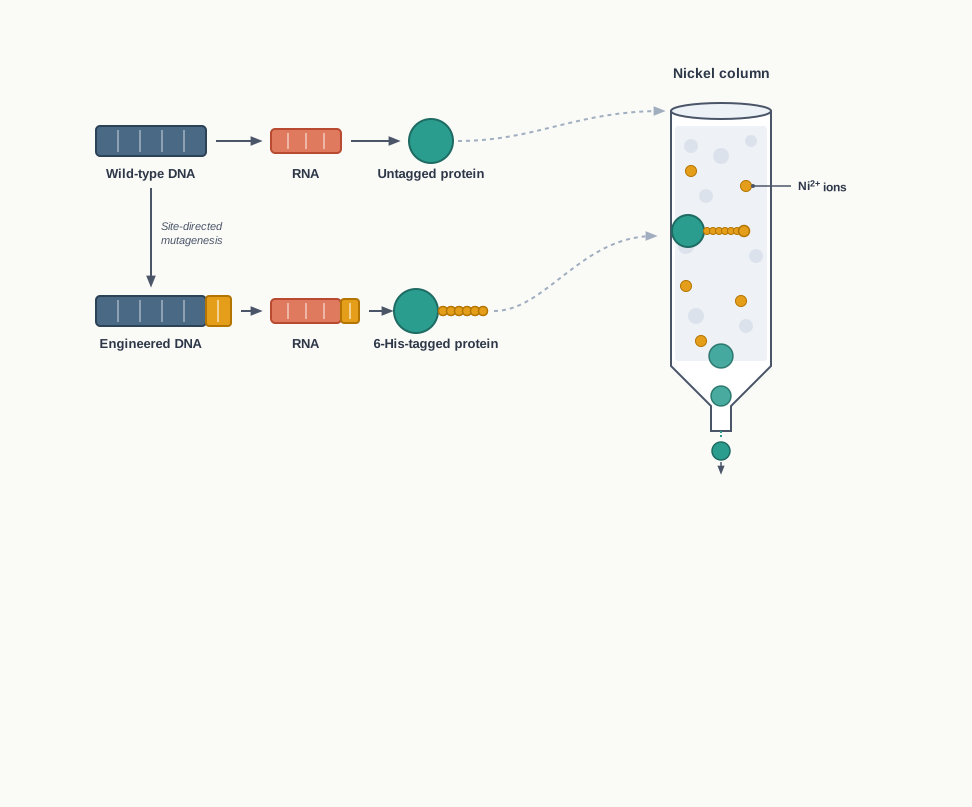
Fig. 5.21 – Protein purification using the 6-His-tag.
Fig. 5.21 is best read as two parallel rows. The upper row follows the natural gene from DNA to RNA to a protein with no tag. The lower row follows the same gene after the His-tag coding sequence has been fused to it, giving an RNA and finally a protein that carries six extra histidine residues at its end — and it is those six residues that make purification possible.
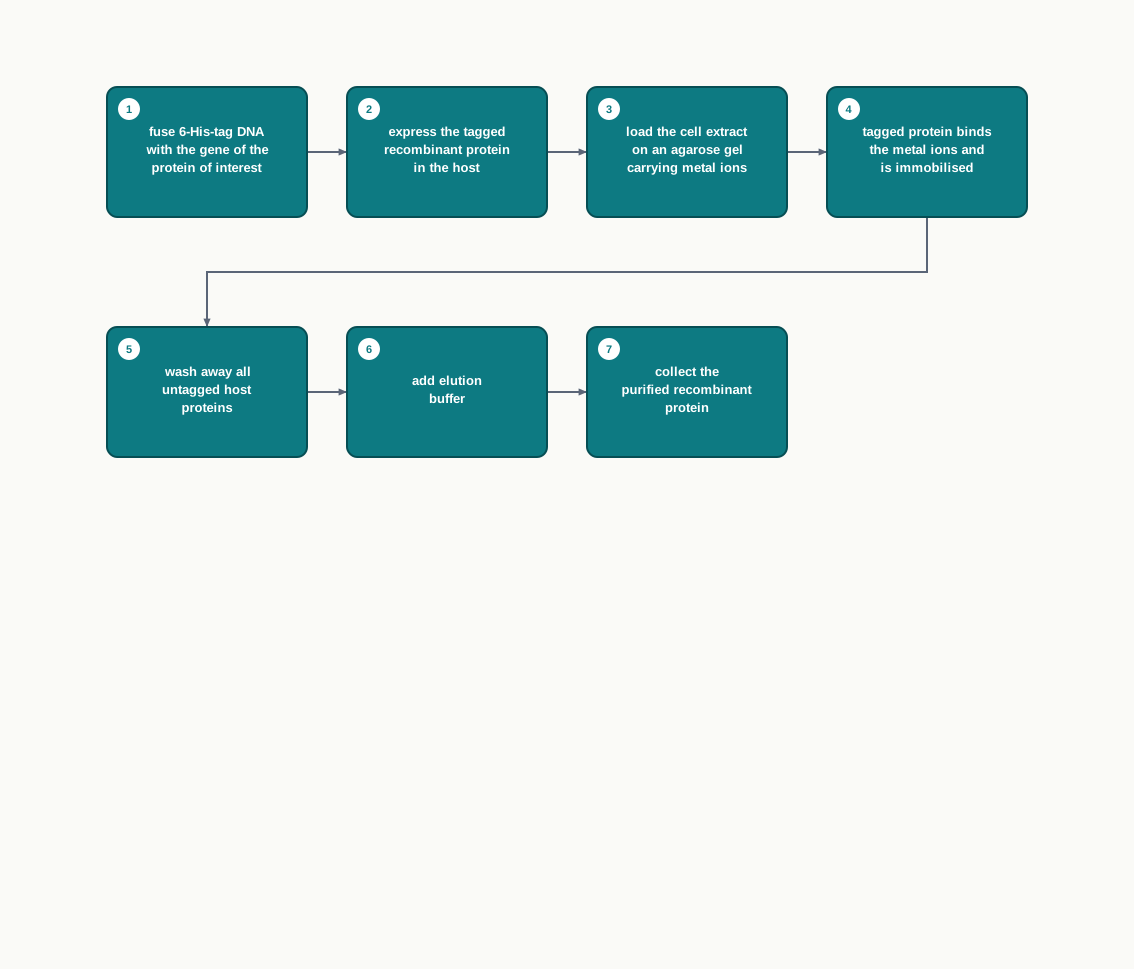
Fig. 5.22 – Purification using the 6-His-tag.
3) Recombinant protein for tracking the location of the protein in a cell
The gene encoding for green fluorescent protein (GFP), obtained from the jelly fish Aequorea victoria, is fused with the DNA sequence of interest. The result is a chimeric DNA — a single DNA molecule assembled from two different sources.
This chimeric DNA now encodes for an engineered protein that appears as a green fluorescent molecule when exposed to UV light, thus revealing its location inside the cell (Fig. 5.23). The protein of interest is ordinarily invisible under a microscope; joined to GFP, it carries its own light source and can be watched in a living cell.
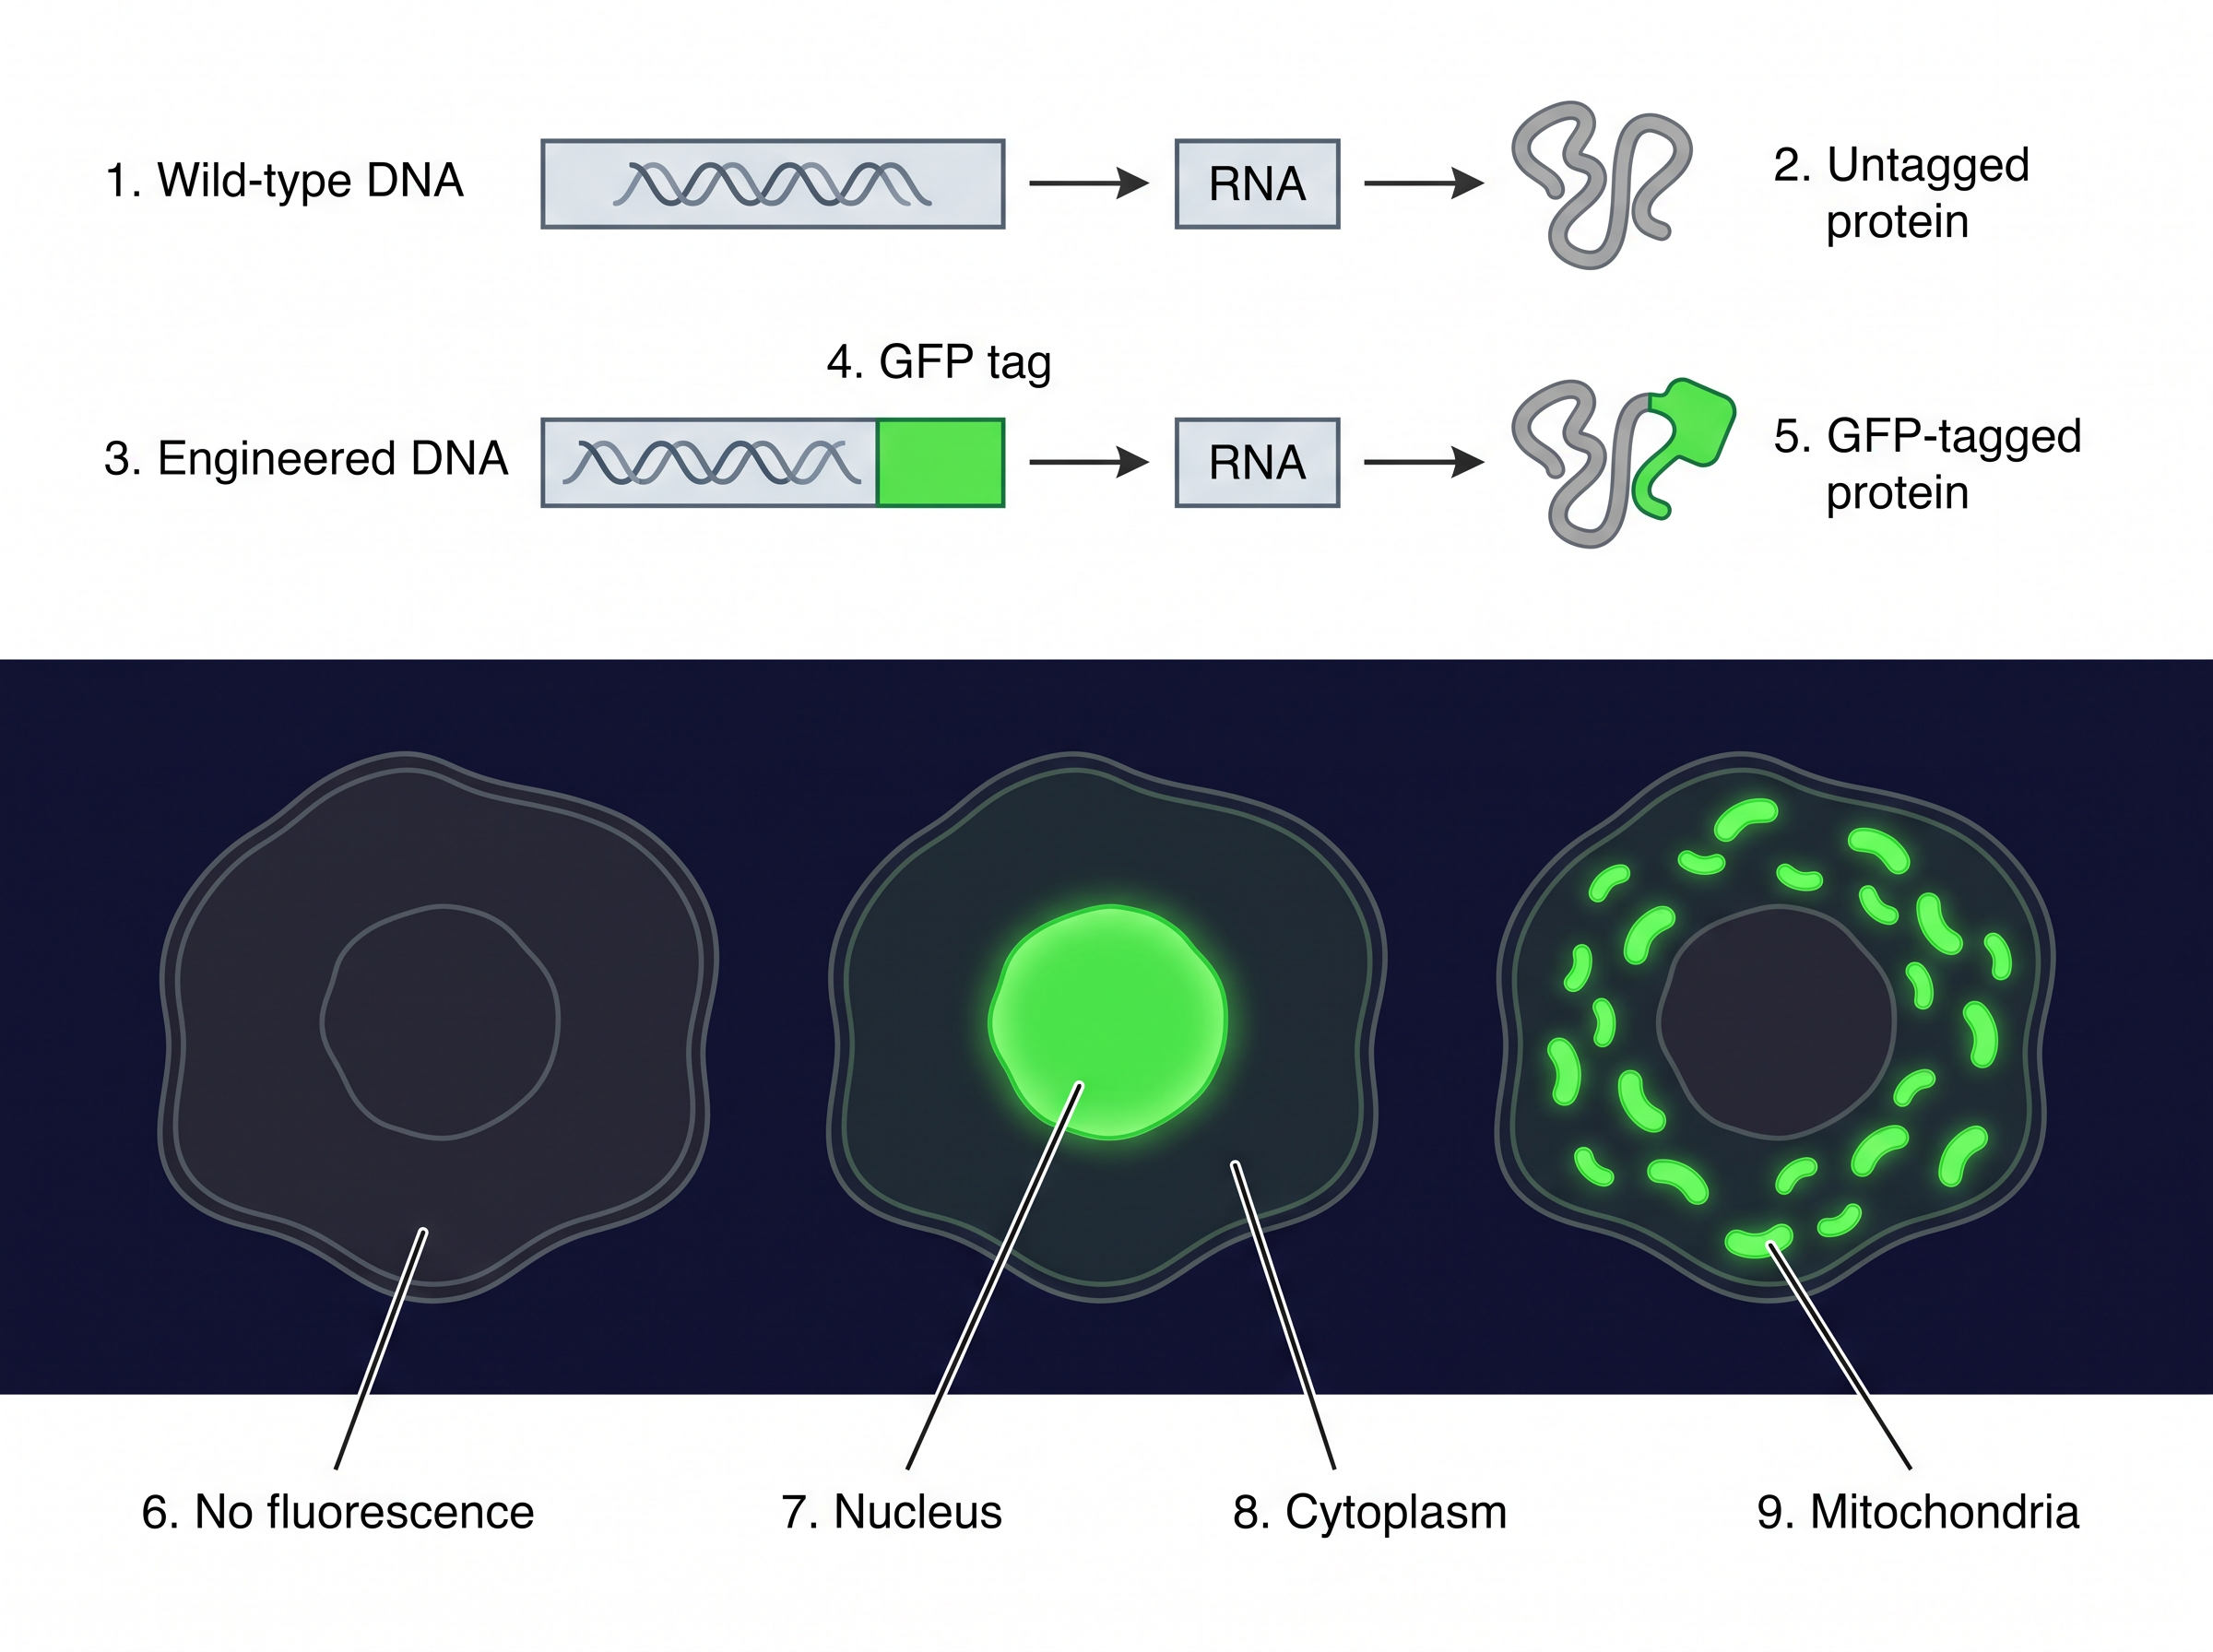
Fig. 5.23 – Protein engineering for protein localisation.
Fig. 5.23 demonstrates how the result is actually read. Under UV light, the region of the cell that glows green is the region where the tagged protein has gone. If the nucleus glows, the protein is nuclear; if the mitochondria glow, the protein is mitochondrial. Since these tags are visualised using epifluorescence or confocal microscopy, the localisation can be followed in the intact cell.
4) Recombinant protein as immunotoxin
Recombinant immunotoxins are rationally engineered protein agents, often anti-cancer agents, that combine the selectivity of an antibody with the cell-killing potency of a toxin.
The word rationally is doing real work in that sentence. Each half of the molecule is chosen for a defined purpose — one half to decide which cell is attacked, the other to do the killing — and the two are then deliberately joined into a single engineered protein.
For the production of recombinant immunotoxins, recombinant single-chain antibodies, also known as single-chain variable fragments (scFv), are produced through rDNA technology. These antibodies consist of the variable regions of the heavy (VH) and light (VL) chains of immunoglobulins, linked by a short flexible peptide linker. Such an scFv can be conveniently produced in bacteria, as it can be encoded by a single gene through genetic manipulation and is expressed as a single-function polypeptide chain. During the production of recombinant immunotoxins, an scFv that specifically binds to the target antigen on the surface of cancer cells is designed. Then a toxin fragment that can effectively kill the target cells is selected, such as Pseudomonas exotoxin A (PE), Diphtheria toxin (DT), or ricin. The designed scFv with the toxin is finally fused with a linker, which allows for proper folding and activity of both the components (Fig. 5.24). This engineered protein uses the antibody part for selectively targeting the cancer cells displaying their antigens, and gets internalized. The toxin part gets released from the endosome and effectively kills the cells.
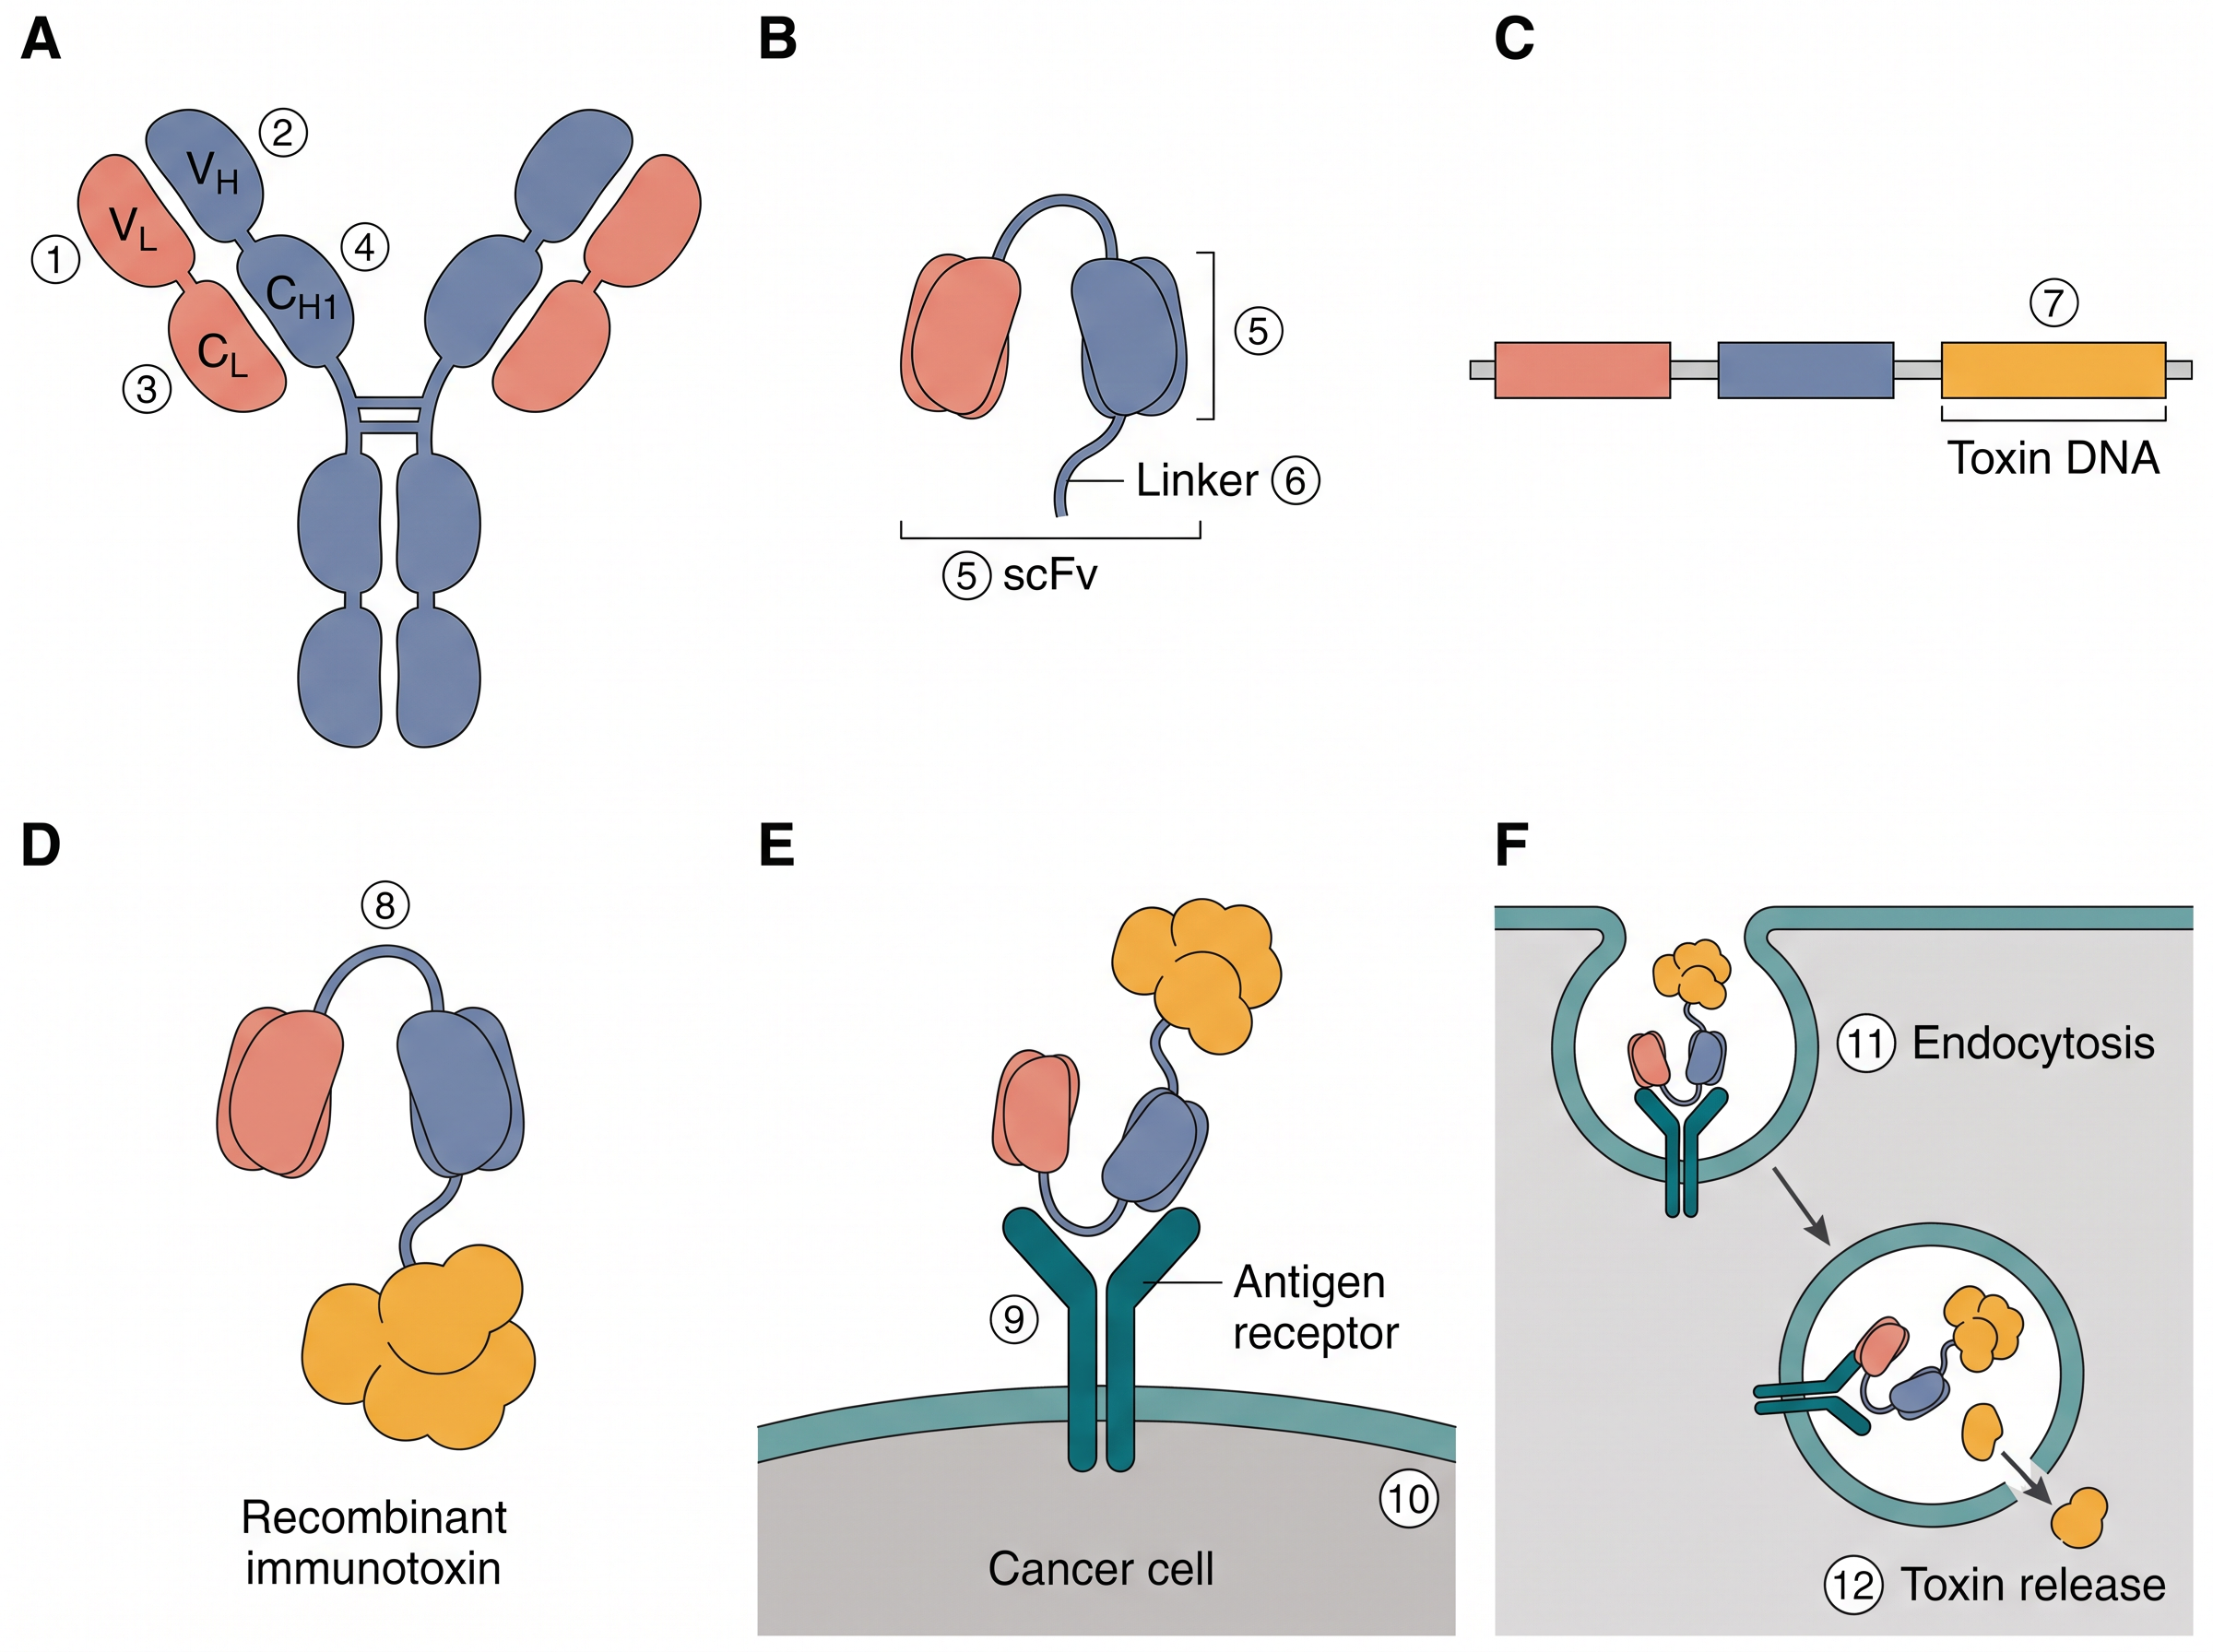
Fig. 5.24 – Production of recombinant immunotoxin.
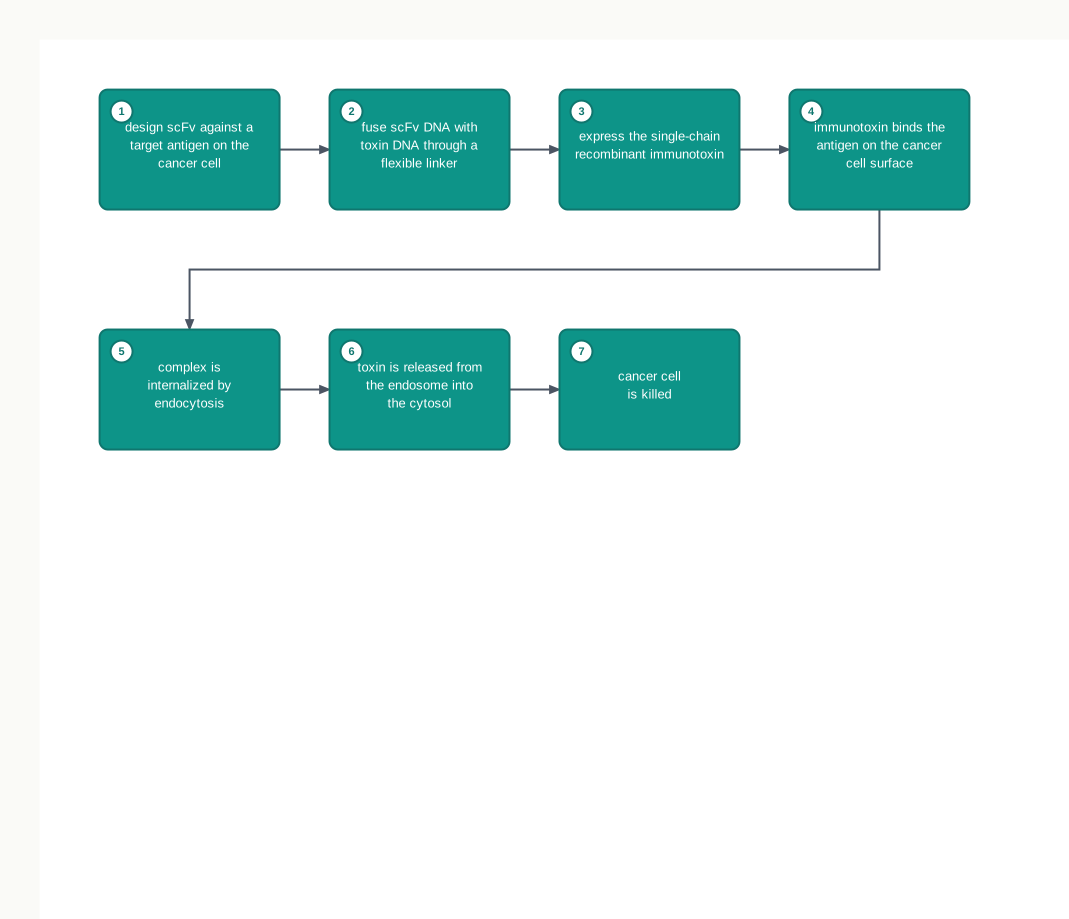
Fig. 5.25 – Action of a recombinant immunotoxin.
While these mouse monoclonal antibodies are useful as reagents, the same cannot be used as immune-therapeutics in human beings. This restriction is due to the ability of the human immune system to recognise the mouse antibody as a foreign antigen, leading to an anti-mouse monoclonal antibody immune response. Raising monoclonal antibodies directly in human beings is not practical. As a result, a biotechnological strategy of protein engineering is applied to humanise the mouse monoclonal antibody. In this strategy, the part of the mouse antibody involved in antigen binding is identified and transferred to a human antibody, which again is done at the DNA level. The DNA coding sequence that codes for the part of the mouse antibody involved in binding the antigen is transferred to the equivalent position in the human antibody coding genes using recombinant DNA techniques, thereby producing a humanised version of the mouse monoclonal antibody. The humanised antibody is often considered self, and therefore has good immune acceptance in human beings when administered for therapeutic purposes.
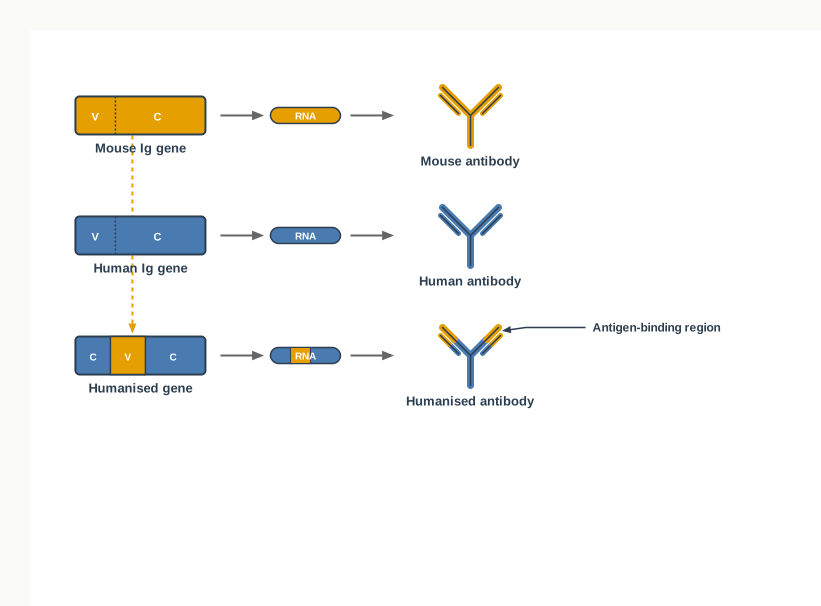
Fig. 5.26 – Humanised mouse antibody using protein engineering.
| Feature | Mouse monoclonal antibody | Humanised monoclonal antibody |
|---|---|---|
| How it is produced | Mouse hybridoma technology, by fusing antibody-producing mouse plasma cells with mouse myeloma cells | Protein engineering at the DNA level, transferring the mouse antigen-binding coding sequence into human antibody coding genes |
| Composition | Entirely mouse protein | Mostly human protein, with the mouse antigen-binding part retained |
| Response of the human immune system | Recognised as a foreign antigen; provokes an anti-mouse monoclonal antibody response | Often considered self; good immune acceptance |
| Suitability | Useful as a laboratory reagent | Suitable as an immune-therapeutic in human beings |
5.7 Summary
- The genome of an organism is its complete DNA content. In prokaryotes this includes the DNA present in the nucleoid, and in eukaryotes it includes the DNA present in the chromosomes of the nucleus as well as in mitochondria and plastids.
- There are two different approaches to genome mapping — physical mapping and genetic mapping.
- A genetic map estimates the genetic distances between genetic loci that are responsible for a set of well-known phenotypes. These distances are measured in centimorgan, or map unit, which is a unit for measuring the genetic linkage of two phenotypes.
- Physical mapping is based on map features such as restriction enzyme sites, used in restriction mapping, and sequence tagged sites (STS).
- In restriction mapping, restriction enzymes cut DNA at a specific base sequence. This gives DNA fragments that can be visualised by agarose gel electrophoresis, in which the fragments are separated on the basis of their sizes.
- STS are unique DNA sequences of 200–500 bp whose location is well known. They serve as useful landmarks in creating a physical map of a genome, and their presence can be demonstrated by PCR.
- First generation DNA sequencing technology was a multistep procedure. It involved separation of chromosomes, restriction digestion, and ligation of the fragments to high capacity cloning vectors.
- The first generation technique used sequencing by chain termination. A ladder of single stranded DNA, with specific fluorescence tagged terminating bases, is separated and detected by a fluorescence detector. This identifies both the position of a base and the type of DNA base present there.
- Next generation DNA sequencing technology depends on advanced computing algorithms that take millions of short sequence outputs and assemble them into large contigs — long stretches of sequence built from overlapping reads — which represent the DNA sequences of large genomes.
- Next generation sequencing includes techniques like whole genome sequencing (WGS), targeted resequencing and clinical exome sequencing. ChipSeq and RNAseq are some of the advanced applications of sequencing technologies.
- Nanopore sequencing technology uses two proteins, a DNA helicase and a porin-like molecule. Together they bind and unwind double stranded DNA and push the single stranded DNA through the porin-like molecule, so that the base pattern can be identified. The technique is simple, rapid and cost efficient, displays results in real-time, and is useful for genotyping and high mobility testing.
- Metagenomics involves the sequencing of DNA or cDNA present in a microbial community.
- Computational genomics involves the use of high performance computing clusters and workstations to analyse genomics data.
- Genome engineering is a technology used to modify a genome — to inactivate, delete, integrate, transduce and edit it.
- Transposons are DNA elements with the ability to move from one position of DNA to another, and they can be exploited to engineer a knockout of existing genes.
- Genome editing using CRISPR-Cas9, which uses a guide RNA along with the Cas9 endonuclease, involves a double strand break followed by homologous DNA repair to generate the edited DNA sequence.
- Structural genomics includes the study of the structural organisation of DNA regions in the chromosome and the nucleosome status of the genome.
- Comparative genomics identifies the set of common genes that form the core genome, and the other genes that are unique to a species. It is therefore a starting point for genome based taxonomy and phylogenetic lineage study.
- Functional genomics aims to study the physiological and pathological function associated with the state of a cell.
- Protein engineering is applied to develop novel reagents, diagnostics and therapeutics. It is used to develop recombinant protein carrying a 6-histidine tag (6-His-tag) for ease of purification, and to develop fluorescent proteins that track the cellular localisation of proteins.
- Protein engineering technology is also involved in the production of humanised monoclonal antibody, single chain antibody, and recombinant immunotoxin — an engineered antibody that delivers a toxin to specific cellular targets.
The overall sequence followed by the chapter, from locating genes to rewriting them, is condensed in Fig. 5.27.
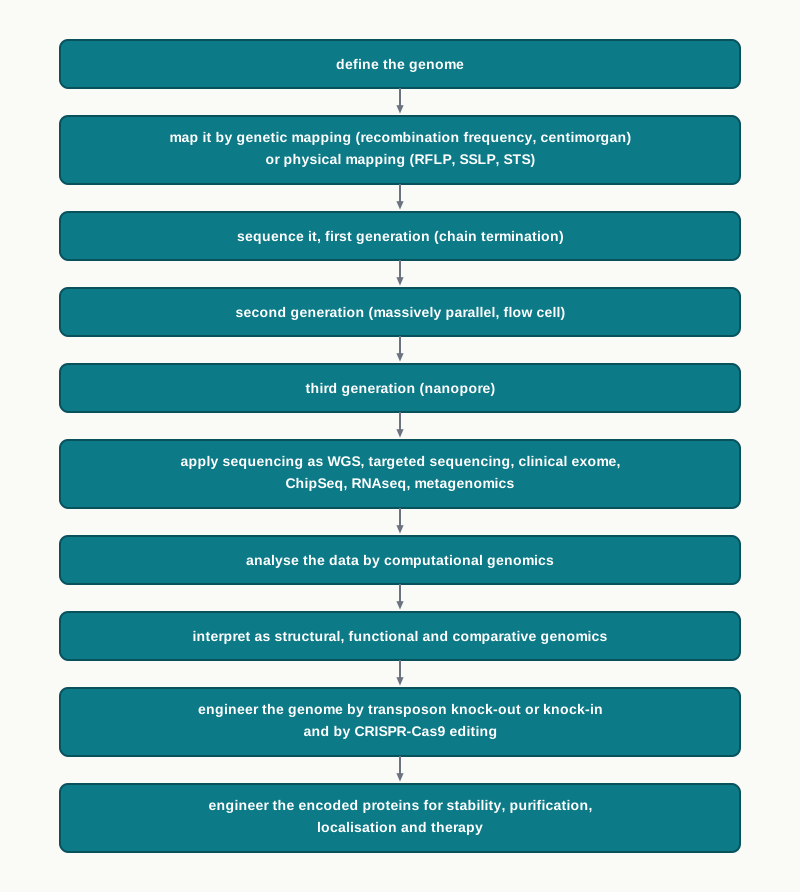
Fig. 5.27 – Sequence of topics in the chapter.
5.8 Key Terms
- Genome — The complete genetic information present in the cell of an organism.
- Nucleoid — The region of a bacterial cell where the main circular chromosome lies, without a surrounding nuclear membrane.
- Plasmid — A small, circular, self-replicating DNA molecule that exists separately from the main chromosome of a bacterium.
- Locus — The fixed position occupied by a gene or a marker on a chromosome.
- Phenotype — The observable characteristic of an organism, produced by the expression of its genes.
- Genetic mapping — The mapping approach that estimates distances between genetic loci by crossover analysis of well-known phenotypes.
- Recombination frequency — The rate of crossing over between two loci, expressed as the percentage of recombinant offspring.
- Map unit (centimorgan, cM) — The genetic distance corresponding to one per cent of observed cross-over between two loci.
- Genetic map — An arrangement of genetic loci in order, based on the genetic distances between them.
- Physical mapping — The mapping approach that identifies specific locations on a genome using DNA-based map features.
- Restriction enzyme — A DNA endonuclease that cuts DNA at its own specific recognition base sequence.
- Restriction Fragment Length Polymorphism (RFLP) — Variation in the lengths of DNA fragments produced when different DNA samples are cut with the same restriction enzyme, caused by the gain or loss of restriction sites.
- Agarose gel electrophoresis — A technique in which DNA fragments are driven through a gel by an electric field and separated according to their sizes.
- Probe — A short, labelled, single-stranded DNA sequence that binds by complementary base pairing to the one fragment matching it.
- Southern hybridisation — A technique in which a labelled DNA probe detects a chosen fragment among a very large number of restriction fragments.
- DNA morph — One of the alternative versions of a DNA region distinguished by its fragment length in an RFLP analysis.
- Simple Sequence Length Polymorphism (SSLP) — Variation in the length of repeat arrays, such as microsatellites and minisatellites, used as a physical map feature.
- Sequence Tagged Site (STS) — A unique DNA sequence of 200–500 bp that occurs once in a genome and whose location is known, used as a physical landmark.
- Polymerase Chain Reaction (PCR) — A technique in which a chosen stretch of DNA is copied many times over using a pair of primers that flank it.
- Pulse Field Gel Electrophoresis (PFGE) — An electrophoresis technique in which the field direction is changed at intervals, allowing very large DNA molecules such as whole chromosomes to be separated.
- High-capacity cloning vector — A vector such as BAC, YAC or PAC that can carry a very large DNA insert into a host cell and replicate there.
- Sub-cloning — Transfer of a smaller DNA fragment from one vector into another, more convenient vector.
- Sequencing by chain termination — The first generation sequencing method in which a ladder of single stranded DNA molecules is created, each terminating at a base identified by its fluorescent tag.
- Capillary gel electrophoresis — Electrophoresis of DNA fragments carried out inside a fine, gel-filled capillary, giving separation sharp enough to resolve single-base differences.
- Chromatogram — The fluorescence output of a first generation sequencer, in which each peak represents a base position and the peak colour indicates the base present.
- Next generation sequencing — A massively parallel sequencing approach in which millions of sequencing reactions are carried out in one machine without any cloning step.
- Depth of coverage — The number of independent times each base of a genome is read, which determines the accuracy of the final sequence.
- Flow cell — The glass slide of an Illumina sequencer, carrying attached single stranded oligonucleotides of 8–10 bases on which DNA fragments are captured and amplified.
- Adaptor — A short oligonucleotide attached to the ends of DNA fragments, complementary to the oligonucleotides on the flow cell, which also serves as a primer.
- Bridge amplification — The amplification of a flow-cell-bound DNA fragment that bends over to pair with a neighbouring oligonucleotide, forming a bridge and producing a cluster of identical fragments.
- Nanopore sequencing — A third generation technique in which bases are identified from the characteristic disruption each one causes in the ionic current across a nanopore.
- Helicase — An enzyme that unwinds double stranded DNA; in nanopore sequencing it also feeds one strand through the pore.
- Porin — A protein that forms a pore across a membrane, used here to create the nanopore.
- Whole Genome Sequencing (WGS) — The comprehensive determination of the DNA sequence of the entire genome of an organism.
- Reference based genome sequencing — Assembly of sequencing reads by matching them against an already sequenced, phylogenetically related genome.
- De novo genome sequencing — Assembly of sequencing reads purely from their overlaps, without using any reference genome.
- Targeted sequencing — Sequencing and analysis of a selected set of genes or genomic regions rather than the whole genome.
- Clinical exome sequencing — Targeted sequencing of genes already known to be disease associated, as curated in databases like OMIM and HGMD.
- ChipSeq — A sequencing application used to map the genome-wide DNA binding sites, and target genes, of a transcription regulator.
- Transcription regulator — A protein that binds DNA and controls the transcription of one or more genes.
- RNASeq — A sequencing application in which total RNA is converted to cDNA and sequenced, so that read counts measure gene expression.
- Transcriptome — The complete set of RNA molecules present in an organism, tissue or sample at a given time.
- cDNA — Complementary DNA, synthesised from an RNA template using reverse transcriptase.
- Metagenomics — The study of the total genetic material obtained directly from the microorganisms of a particular environment, without separating or culturing them.
- Genome engineering — Technology used to modify a genome by inactivating, deleting, integrating, transducing or editing it.
- Transposon — A DNA sequence, also called a jumping gene, that moves from one location to another in the genome, generally by a cut and paste mechanism.
- Insertional inactivation — Loss of function of a gene caused by the insertion of a DNA segment that disrupts its coding frame.
- Knock-out — Deliberate inactivation of an existing gene so that its original transcript and product are no longer made.
- Knock-in — Deliberate addition of a functional DNA sequence at a chosen genetic locus.
- Genome editing — A set of technologies used to change the DNA of an organism by adding, removing or altering a specific DNA sequence.
- CRISPR-Cas9 — A genome editing system repurposed from the bacterial defence mechanism that memorises the DNA signature of past viral attacks.
- Guide RNA — The RNA molecule that base pairs with the target DNA sequence and binds Cas9, positioning the endonuclease at the site to be edited.
- Cas9 endonuclease — The enzyme that introduces a double strand break in DNA at the position specified by the guide RNA.
- Double strand break — A cut across both strands of a DNA molecule at the same position, which triggers the cell’s repair machinery.
- Non-homologous end joining — Repair of a double strand break by direct rejoining of the broken ends, often causing small deletions or insertions and hence a knock-out.
- Homologous DNA repair — Template based repair of a double strand break, which writes the sequence of the supplied template into the genome.
- tracrRNA — The molecule of the CRISPR-Cas system discovered in Streptococcus pyogenes, whose finding led to the reprogramming of the system for genome editing.
- Computational genomics — The use of high performance computing clusters and workstations to analyse genomics data.
- Homology — Similarity of sequence between genes or proteins arising from shared ancestry.
- Gene annotation — Assigning a functional value to a stretch of sequence, usually by homology search against genes of known function.
- Contig — A long stretch of sequence assembled from many overlapping short sequencing reads.
- Structural genomics — The study of the 3D structures of the proteins encoded by a genome, or of the physical organisation of the genome itself.
- Protein fold — The characteristic three dimensional shape adopted by a polypeptide chain, which determines what the protein can do.
- Nucleosome — The basic packing unit of eukaryotic DNA, in which DNA is wound around a core of histone proteins.
- Functional genomics — The study of how the physiological function information encoded in a genome is executed in a cell.
- Comparative genomics — The comparison of genes and genomes across species, or among individuals of one species, to annotate genomes and study evolutionary relationships.
- Core genome — The set of common genes shared by all the organisms being compared.
- Protein engineering — The use of rDNA technology to produce proteins with an additional or extended property compared with the original protein.
- Point mutation — A change at a single position in a DNA sequence, which can replace one amino acid in the encoded protein.
- Site directed mutagenesis (SDM) — A process by which a point mutation is introduced at a specific chosen site in a gene.
- Subtilisin — A proteolytic enzyme added to detergents to hydrolyse the protein component of dirt.
- Catalytic triad — A set of three amino acid residues that act together at the active site of an enzyme; in subtilisin these are Ser 221, His 64 and Asp 32.
- 6-His-tag — A peptide of six consecutive histidine residues that binds metal ions such as Nickel, Zinc and Cobalt with great affinity at mildly alkaline pH.
- Affinity chromatography — A purification method in which the molecule of interest is held back by specific binding to a partner fixed on the column, while other molecules are washed away.
- Green Fluorescent Protein (GFP) — A protein from the jelly fish Aequorea victoria that fluoresces green under UV light and is used to track protein localisation.
- Chimeric DNA — A single DNA molecule assembled from sequences of two different sources.
- Recombinant immunotoxin — An engineered protein that combines the selectivity of an antibody with the cell-killing potency of a toxin.
- Single-chain variable fragment (scFv) — A recombinant single-chain antibody made of the variable regions of the heavy and light chains joined by a short flexible peptide linker.
- Monoclonal antibody — An antibody produced by immortalised hybrid cells, which binds its target in a well-defined way.
- Hybridoma technology — The technique of fusing antibody-producing mouse plasma cells with mouse myeloma cells to make immortalised antibody-producing cells.
- Humanised monoclonal antibody — A mouse monoclonal antibody whose antigen-binding coding sequence has been transferred into human antibody genes, so that it is accepted as self in human beings.
5.9 Points to Ponder
- A genetic map places loci in order using recombination frequency, and a physical map places them using features of the DNA itself. If both maps of the same chromosome were laid side by side, would the order of the landmarks necessarily agree? Would the distances between them?
- Genetic mapping can only use loci that produce a phenotype somebody can see and score. Think about what this means for the parts of a genome that produce no visible character at all — and whether such regions can be considered less important simply because they were harder to map.
- Cutting a circular DNA once gives one fragment, while cutting a linear DNA once gives two. Consider how many other conclusions in molecular biology depend on knowing the shape of the molecule before the experiment begins.
- A restriction enzyme may cut a mammalian genome into lakhs of fragments, which appear on a gel as an unreadable smear. Southern hybridisation solves this by making only one fragment visible. Reflect on how often progress in biology has come not from seeing more, but from deliberately choosing to see less.
- First generation sequencing needed cloning, mapping and sub-cloning before a single base could be read; next generation sequencing needed none of these. Which of the two do you think placed the greater limit on early genome projects — the chemistry of reading bases, or the labour of preparing the DNA?
- Nanopore sequencing reads a DNA molecule directly, as a change in electric current, with no fluorescent tag and no camera. Think about what becomes possible when an instrument no longer needs optics — and what a scientist can do with a sequencer that can be carried to where the sample is.
- Whole genome sequencing reads everything, while clinical exome sequencing reads only the genes already known to be disease associated. What is gained and what is lost when a test is designed around what we already know?
- Metagenomics studies organisms without ever culturing them. Consider how much of the microbial world may have remained unknown for over a century simply because it would not grow in a laboratory dish.
- Both transposon insertion and CRISPR-Cas9 can knock out a gene, but only one of them was designed to leave the rest of the genome untouched. Why should precision matter so much when the intended change in both cases is the silencing of a single gene?
- CRISPR-Cas9 does not write the new sequence itself; it makes a cut, and the cell’s own repair machinery does the writing. Reflect on what this tells you about how biotechnology usually works — as an instruction given to living machinery, rather than a task performed on it.
- The same insertion event can be used to destroy a gene or to add one, and the same sequencing machine can be used to read a genome, measure gene expression or survey a community of microbes. What does this suggest about the relationship between a technique and the question it is used to answer?
- In subtilisin, the amino acid replaced by engineering was not one of the three residues that carry out catalysis, but a neighbouring one that bleach could oxidise. Think about why identifying the right amino acid to change is harder, and more important, than making the change itself.
- A mouse monoclonal antibody is a valuable reagent but cannot be given to a patient, while its humanised version can. Consider how much biotechnology is concerned not with making a molecule work, but with making the body accept it.
- Genome sequences of patients are stored in databases, and because relatives share DNA, one person’s sequence carries information about people who never agreed to the test. How should a laboratory balance the medical value of such data against the privacy of a whole family?
5.10 NCERT Questions
- What is a genome? How is the genome of prokaryotes different from eukaryotes?
- What are the types of genome mapping? Explain each with a comparative approach.
- Suppose a DNA is extracted, purified and digested with enzyme BamH1. What type of mapping can be achieved? Mention the application of this type of mapping.
- What is STS and its role in genome mapping?
- Give a brief insight about the development of DNA sequencing technology and genomic workflow.
- Discuss how next generation DNA sequencing technology has overcome the drawbacks of the first-generation DNA sequencing technology. Elaborate the methodology.
- What is a unit of physical mapping? Discuss in detail.
- Discuss the methodology and applications of third generation sequencing technology.
- What are the different variations of Next Generation Sequencing? Explain in brief.
- What are the applications of advanced sequencing technologies? Elaborate.
- Discuss the applications of metagenomics.
- What are the goals of genome engineering? Explain each in detail.
- One of the applications of genome engineering is to achieve high level recombinant protein production. How can we achieve this? Explain in detail.
- What is a genome editing? Why is there a need to edit a genome? Explain the methodology of editing using CRISPR-Cas9.
- What are the structural, functional and comparative genomics?
- What are the applications of protein engineering? Discuss in brief.
- If you are given a recombinant protein with 6-His-tags, how are you going to use it? Explain the methodology and application in detail.
- How do you apply protein engineering to track cellular localisation of proteins?
- How to generate a recombinant immunotoxin? Why do you think there is a need for generation of an immunotoxin? Mention its mechanism of action.
- Assertion: RFLP is variation in length of DNA fragments when cleaved by same restriction endonuclease. Reason: Genome of every individual has different position of restriction sites.
- Both assertion and reason are true and the reason is the correct explanation of the assertion.
- Both assertion and reason are true but the reason is not the correct explanation of the assertion.
- Assertion is true but reason is false.
- Both assertion and reason are false.
- Assertion: Recombinant immunotoxins are rationally engineered protein agents. Reason: It is prepared by fusing DNA-coding region of antibody with the DNA code of toxin.
- Both assertion and reason are true and the reason is the correct explanation of the assertion.
- Both assertion and reason are true but the reason is not the correct explanation of the assertion.
- Assertion is true but reason is false.
- Both assertion and reason are false.
5.11 Objective Questions
- The genome of a prokaryote includes the DNA present in the
- nucleus and mitochondria
- nucleoid and plasmid
- nucleoid and plastids
- chromosomes and nucleolus
- In eukaryotes, organellar DNA that forms part of the genome is present in
- lysosomes and Golgi body
- ribosomes and centrioles
- mitochondria and plastids
- nuclear envelope and plasma membrane
- One map unit is equal to
- one per cent of observed cross-over
- ten per cent of observed cross-over
- one base pair of DNA
- one hundred base pairs of DNA
- The unit used to denote genetic distance between genes based on offspring phenotype frequency is the
- base pair
- kilobase
- centimorgan
- micrometre
- A decreased recombination frequency between two loci indicates that the loci are
- on different chromosomes
- closer to each other
- farther from each other
- identical in sequence
- The main drawback of genetic mapping is that
- restriction enzymes are expensive
- only a limited number of loci with well-known phenotypes are available
- crossing over does not occur in eukaryotes
- DNA cannot be separated on a gel
- A single cut in a circular DNA molecule yields
- one fragment
- two fragments
- three fragments
- no fragment
- Two cuts in a linear DNA molecule yield
- one fragment
- two fragments
- three fragments
- four fragments
- Sequence tagged sites (STS) are unique DNA sequences of length
- 20–50 bp
- 200–500 bp
- 2000–5000 bp
- 1–2 kb
- The presence or absence of an STS site in a given DNA fragment is most easily demonstrated using
- PCR
- Pulse Field Gel Electrophoresis
- affinity chromatography
- confocal microscopy
- Microsatellites and minisatellites are used as map features in
- restriction mapping
- SSLP mapping
- genetic mapping by crossover analysis
- nanopore sequencing
- Separation of whole chromosomes on an agarose gel during first generation sequencing was achieved by
- capillary gel electrophoresis
- Pulse Field Gel Electrophoresis
- affinity chromatography
- Southern hybridisation
- In first generation sequencing, each capillary in a single run sequences DNA of about
- 75–300 bases
- 800–1000 bases
- 1–2 kb
- 1 Mb
- A first generation DNA sequencer with 96 capillaries can provide up to
- 960 bases per run
- 9600 bases per run
- 96 000 bases per run
- 960 000 bases per run
- In the output of first generation sequencing, the colour of each peak of the chromatogram indicates
- the length of the fragment
- which DNA base is present at that position
- the number of capillaries used
- the depth of coverage
- In Illumina sequencing technology, DNA fragments are amplified on the flow cell by
- chain termination
- bridge amplification
- homologous recombination
- transposition
- The oligonucleotides attached to the surface of an Illumina flow cell are
- 8–10 bases long
- 75–300 bases long
- 200–500 bases long
- 1–2 kb long
- The read length generated by next generation sequencing technology is about
- 75 to 300 bases
- 800 to 1000 bases
- 1 to 2 kb
- 1 Mb or more
- In nanopore sequencing, the two proteins used are
- DNA ligase and DNA polymerase
- DNA helicase and a porin-like molecule
- Cas9 and a guide RNA
- reverse transcriptase and subtilisin
- Bases are identified in nanopore sequencing by measuring
- the colour of fluorescence emitted
- the disruption in ionic current across the pore
- the size of fragments on a gel
- the pH change in the buffer
- Whole genome sequencing of the human genome started in 1990 and the complete sequence was published in
- 1995
- 2000
- 2003
- 2011
- Assembly of sequencing reads without using any already sequenced related genome is called
- reference based genome sequencing
- de novo genome sequencing
- targeted sequencing
- clinical exome sequencing
- ChipSeq projects are carried out mainly to
- measure the transcriptome of a tissue
- map genome-wide DNA binding sites of a transcription regulator
- sequence a microbial community
- purify recombinant proteins
- In an RNASeq project, the material actually loaded for sequencing is
- total RNA
- cDNA synthesised from total RNA
- genomic DNA
- plasmid DNA
- A DNA transposon generally moves by a
- copy and paste mechanism
- cut and paste mechanism
- reverse transcription mechanism
- bridge amplification mechanism
- In CRISPR-Cas9 editing, the part of the guide RNA that finds the target does so by
- binding to Cas9
- complementary base pairing with the DNA sequence to be edited
- cutting both strands of DNA
- forming a nanopore in the membrane
- After a double strand break made by Cas9, a knock-in or corrected sequence is obtained when the break is repaired by
- non-homologous end joining
- template based homologous DNA repair
- bridge amplification
- insertional inactivation
- The molecule discovered in the CRISPR-Cas system of Streptococcus pyogenes in 2011 was
- tracrRNA
- cDNA
- scFv
- GFP
- Comparative genomics identifies the set of common genes shared by the organisms compared, known as the
- exome
- transcriptome
- core genome
- metagenome
- The catalytic triad of subtilisin consists of
- Ser 221, His 64 and Asp 32
- Ser 32, His 221 and Asp 64
- Met 222, Ala 221 and His 64
- Ser 221, Met 222 and Asp 32
- In engineered subtilisin, the codon for Met 222 is replaced by the codon for
- Ser
- His
- Ala
- Asp
- The 6-His-tag binds with great affinity, at mildly alkaline pH, to
- agarose fibres
- metal ions such as Nickel, Zinc and Cobalt
- fluorescent dNTPs
- restriction enzymes
- Green fluorescent protein used for tracking protein localisation is obtained from
- Escherichia coli
- Streptococcus pyogenes
- Aequorea victoria
- Haemophilus influenzae
- A single-chain variable fragment (scFv) consists of
- the Fc region of an antibody alone
- the variable regions of the heavy and light chains joined by a flexible peptide linker
- two heavy chains and two light chains
- a toxin joined directly to a whole antibody
- A mouse monoclonal antibody cannot be used directly as an immune-therapeutic in human beings because
- it is too small to bind antigen
- the human immune system recognises it as a foreign antigen
- it cannot be produced in sufficient quantity
- it loses activity at body temperature
- Assertion: A genetic map is described as coarsely grained or sparsely populated. Reason: Only a limited number of genetic loci responsible for well-known phenotypes are available for crossover analysis.
- Assertion: Southern hybridisation is used along with restriction digestion when studying a mammalian genome. Reason: An enzyme like EcoRI may cut a mammalian genome into lakhs of fragments, which cannot be distinguished on the basis of electrophoresis alone.
- Assertion: Next generation sequencing reduces the cost of a genome sequencing project. Reason: It does not require the time consuming cloning and subcloning steps needed by first generation sequencing.
- Assertion: The fluorescent tag on an incorporated base must be removed before the next base is passed through the flow cell. Reason: Bridge amplification produces a cluster of similar fragments at the same location.
- Assertion: Nanopore sequencing is highly useful for genotyping even in a field setup. Reason: It offers rapid and simple sample processing and has the potential to display sequencing results in real-time.
- Assertion: Metagenomics can study microorganisms that have never been grown in a laboratory. Reason: In metagenomics, the total genetic material is obtained directly from the environment without separating or culturing the organisms.
- Assertion: Insertion of an engineered transposon into a target gene results in a knock-out. Reason: The insertion disrupts the coding frame of the target gene, so the original transcript required for the gene product is no longer produced.
- Assertion: Engineered subtilisin remains active in the presence of bleach. Reason: The catalytic triad of subtilisin is replaced by alanine residues through site directed mutagenesis.
- Assertion: A recombinant immunotoxin is joined together through a flexible peptide linker. Reason: The linker allows proper folding and activity of both the antibody component and the toxin component.
- Assertion: A humanised monoclonal antibody has good immune acceptance in human beings. Reason: The antigen-binding coding sequence of the mouse antibody is transferred to the equivalent position in human antibody coding genes, so the product is often considered self.
5.12 Check Your Concepts
- Why is it not enough to say that the genome is “the DNA in the nucleus”? Answer with reference to both prokaryotes and eukaryotes.
- Two loci on the same chromosome show a recombination frequency of 1 per cent. Explain, in terms of crossing over, why this value tells us they lie close together.
- A student writes that a genetic map and a physical map of the same chromosome must show the same distances between landmarks. Explain what is wrong with this statement.
- Why can a physical map include landmarks in regions of DNA that produce no visible phenotype, while a genetic map cannot?
- A circular plasmid is digested with a restriction enzyme that has four recognition sites on it. State the number of fragments obtained, and state how the answer would change if the same four sites were present on a linear DNA molecule. Justify both answers.
- Genome (1) carries a restriction site that genome (2) has lost. Predict how the band pattern of genome (1) will differ from that of genome (2) on an agarose gel, and explain the reasoning behind your prediction.
- What would happen if a researcher tried to study RFLP in a mammalian genome using only restriction digestion and gel electrophoresis, without a probe? Name the technique that solves the problem and explain the principle on which it works.
- In a Southern hybridisation experiment, an individual shows two bands after the probe is applied while another shows only one. What can you conclude about the two individuals?
- Compare and contrast SSLP and STS as physical map features, mentioning what varies in each and how each is detected.
- Explain why an STS is a useful landmark only because it satisfies two conditions at once. State both conditions and explain what would go wrong if either were not met.
- Arrange the following steps of first generation genome sequencing in the correct order and explain why the order cannot be changed: sub-cloning into a sequencing plasmid; separation of chromosomes by PFGE; ligation into high-capacity cloning vectors; identification of overlapping clones; restriction digestion.
- Why was Pulse Field Gel Electrophoresis, rather than ordinary agarose gel electrophoresis, used for separating chromosomes?
- In chain termination sequencing, explain why the fragments must be separated by size before the sequence can be read, and what the colour of each peak on the chromatogram represents.
- Explain why the overlap between cloned DNA segments, which might seem like wasteful duplication, was actually essential for assembling a genome in first generation projects.
- Why is bridge amplification necessary in Illumina sequencing? What would go wrong at the imaging step if each fragment were sequenced as a single molecule on the flow cell?
- DNA fragments in an Illumina library are all given the same adaptor sequences at their ends. Explain the purpose of doing this, given that the fragments themselves have completely different sequences.
- A laboratory forgets to remove the fluorescent tag from the incorporated base before adding the next base in an Illumina run. Predict the effect on the sequencing images and explain why the read would become unusable.
- Next generation sequencing gives millions of reads but each read is very short. Explain why short reads create difficulty when a genome contains repeated sequences.
- Explain how high depth of coverage improves the accuracy of a next generation sequencing result.
- In nanopore sequencing, what would happen if the helicase were absent from the system? Answer with reference to both of the jobs the helicase performs.
- Explain how four different bases can be distinguished by a single measurement of electric current across a nanopore.
- Draw a labelled diagram of nanopore based sequencing and mark the synthetic membrane, the protein pore, the unwinding enzyme, the single stranded DNA and the direction of ionic current.
- Compare reference based and de novo genome sequencing. Which would you choose for an organism whose close relatives have never been sequenced, and why?
- A diagnostic laboratory chooses clinical exome sequencing rather than whole genome sequencing for a suspected inherited disorder. Give one advantage and one limitation of that choice.
- In an RNASeq experiment, gene A gives many more mapped reads than gene B in the same sample. What does this tell you about the two genes, and why is cDNA rather than RNA sent to the sequencer?
- Explain why metagenomics requires a different set of computing algorithms from an ordinary whole genome sequencing project.
- Why are microbial communities of extreme environments, such as high temperature sulphur springs, of particular interest to industry?
- The same event — insertion of a transposon — can produce either a knock-out or a knock-in. Explain how the outcome is decided.
- Explain why insertion of a DNA segment in the middle of a gene prevents the gene product from being formed, even though none of the original bases of the gene has been deleted.
- Match the following:
| Column A | Column B |
|---|---|
| a. Guide RNA | i. Introduces the double strand break |
| b. Cas9 | ii. Positions the enzyme at the target sequence |
| c. Non-homologous end joining | iii. Writes the supplied edited sequence into the genome |
| d. Homologous DNA repair | iv. Gives a knock-out through deletion or insertion |
- Arrange in correct order the steps of CRISPR-Cas9 genome editing, from the design of the guide RNA to the appearance of the edited sequence in genomic DNA.
- It is said that CRISPR-Cas9 does not itself write the new DNA sequence. Explain what it does instead, and which part of the system actually produces the edited sequence.
- In its natural setting in bacteria, what is the CRISPR-Cas system used for? Explain how a defence system was converted into a genome editing tool.
- Compare and contrast transposon-based gene knock-out with CRISPR-Cas9 based gene knock-out, mentioning precision as one of your points.
- Structural genomics is said to mean two different things to two different sets of people. State both meanings and give one example of the kind of study each involves.
- Why is homology search a useful shortcut for assigning function to a newly sequenced gene? Under what circumstance would this shortcut fail?
- A newly sequenced genome contains a gene of unknown function. Suggest one approach each from structural, functional and comparative genomics that could be used to learn more about it.
- Explain why graphics processing units, originally built for drawing images on a screen, turned out to be well suited to computational genomics.
- Why is the set of genes unique to a species often more informative about that species than the much larger core genome it shares with others?
- In protein engineering, the change is always made in the gene rather than in the protein. Explain the advantage of doing it this way.
- Why was Met 222 of subtilisin chosen for replacement rather than Ser 221, His 64 or Asp 32? Explain in terms of both the cause of the problem and the need to retain enzyme activity.
- A student proposes to purify a recombinant protein by fusing a 6-His-tag to it, loading the extract on a metal-ion column, and then immediately collecting whatever comes out of the column. Identify the step that has been left out of this protocol and explain why the omission would ruin the purification.
- Explain why the elution buffer is required at the end of an affinity chromatography purification using a 6-His-tag.
- A GFP-tagged protein is expressed in a cell, and green fluorescence is seen in the mitochondria under UV light. What conclusion can be drawn, and why would this conclusion be impossible to reach without the tag?
- Explain the roles of the two different components of a recombinant immunotoxin, and state what would be lost if either component were used on its own.
- Why is an scFv, rather than a whole antibody, used in the construction of a recombinant immunotoxin?
- Explain the biological reason why a mouse monoclonal antibody must be humanised before it can be used therapeutically, and describe at what level — protein or DNA — the humanisation is carried out.
- Draw and label a simple diagram showing the natural antibody, the scFv and the finished recombinant immunotoxin, marking the position of the linker in each case where it applies.
5.13 Case-Based Questions
- A family is being studied for an inherited disorder that appears in some members and not in others. DNA from every member is extracted, digested with the same restriction enzyme, separated on an agarose gel, and probed by Southern hybridisation. Every affected member shows a single large band at the probed locus, while every unaffected member shows two smaller bands.
- Explain, in terms of restriction sites, why the affected members give one large band while the unaffected members give two smaller ones.
- Name the type of polymorphism being detected and state which kind of genome map it contributes to.
- The laboratory omitted the probe in a trial run and obtained an unreadable smear on the gel. Explain why.
- Can this result by itself prove that the probed locus contains the gene causing the disorder? Justify your answer.
- A university laboratory has an old first generation sequencer with 96 capillaries, each reading about 1000 bases per run, and has just been offered funding for a next generation sequencing platform. The group works on bacterial genomes of roughly 4 Mb each and sequences about twenty new isolates every year.
- Calculate the output of one run of the existing machine, and comment on whether it is well matched to the group’s yearly workload.
- State two steps in the existing workflow that the new platform would remove altogether.
- The group is warned that the new platform produces reads of only 75 to 300 bases. Explain what difficulty this could create during assembly.
- Suggest what kind of sequencing technology could be added to overcome that particular difficulty, and give the reason for your choice.
- A public health team is investigating a viral outbreak in a remote district with no molecular biology laboratory nearby. They carry a portable nanopore sequencer, a laptop and a small kit of reagents. Samples are processed on site and sequence data begin to appear within hours.
- Explain the principle by which the nanopore device reads the bases of the viral genome.
- State two features of this technology that make it suitable for use away from a laboratory.
- The team compares the sequences from different patients. Name the branch of genomics that deals with such comparisons and state one conclusion it could allow about the outbreak.
- Would the same investigation have been practical using first generation sequencing? Give reasons.
- A group of students collects water and sediment from a hot sulphur spring. Attempts to culture the microorganisms in the laboratory fail almost completely, so the group extracts total DNA directly from the sample and sends it for sequencing. The data show sequences belonging to many different organisms mixed together.
- Name the approach the group has used and define it.
- Explain why the failure to culture the organisms did not prevent the study from going ahead.
- State one reason why industry would be interested in the enzymes encoded by these genomes.
- Explain why the analysis of this data set needs a different set of computing algorithms from an ordinary genome project.
- A researcher wants a mouse in which a particular gene produces no functional product, so that the role of the gene in a disease can be studied. Two strategies are available: inserting an engineered transposon into the gene, or using CRISPR-Cas9 to cut within the gene and allowing the break to be repaired by non-homologous end joining.
- Explain how each of the two strategies silences the gene.
- State one advantage of the CRISPR-Cas9 route over the transposon route.
- The researcher later wants to restore the gene’s function at the same locus. Name the type of modification required and explain how CRISPR-Cas9 could achieve it.
- Explain why a knock-out animal model is valuable in the development of new drugs.
- A biotechnology company expresses a new therapeutic enzyme in bacteria. The gene has been fused with DNA encoding six consecutive histidine residues. The cell extract is passed over an agarose matrix carrying nickel ions at mildly alkaline pH, the column is washed, and a buffer is then applied to collect the product.
- Explain the property of the tag that makes this purification possible.
- Explain what happens to the host cell’s own proteins during the washing step and why.
- State the purpose of the buffer applied at the end.
- A junior technician suggests attaching the tag to the purified protein chemically instead of fusing the DNA. Give one clear disadvantage of this suggestion.
- A hospital laboratory is developing a treatment aimed at cancer cells that display a particular antigen on their surface. The design joins a single-chain variable fragment directed against that antigen to a bacterial toxin through a short flexible peptide linker. The finished molecule is produced in bacteria.
- Name the class of engineered protein being made and state the two properties it combines.
- Explain the function of the flexible linker.
- Describe, in sequence, what happens after the molecule binds to the antigen on a cancer cell.
- Explain why an scFv can be produced conveniently in bacteria while a complete antibody cannot be made as easily in this way.
- A hospital offers whole genome sequencing to patients whose cancers have not responded to standard treatment, so that a better-matched chemotherapy can be chosen. The consent form covers only the patient. During analysis, the laboratory also detects an inherited variant that carries a high risk of a serious disease in the patient’s children.
- Explain how reading the variations in cancer cells can help a physician choose chemotherapy.
- Explain why a genome sequence taken from one person also carries information about that person’s relatives.
- Present the arguments on both sides of whether the laboratory should disclose the inherited finding, given that the family did not consent to any test.
- Suggest two safeguards a hospital could put in place before offering such sequencing.
- A plant biotechnology group has sequenced the genome of a wild relative of a crop plant. They annotate it by comparison with the well-studied crop genome, identify the genes shared by both, and find a small number of genes present only in the wild relative — including one predicted to encode an enzyme that works at high temperature.
- Name the branch of genomics used for the annotation and explain how comparison makes annotation possible.
- What is the term for the set of genes shared by both plants?
- Explain why the genes unique to the wild relative are of particular interest to the group.
- The group next wants to know whether the predicted enzyme gene is actually expressed in the leaves. Name a suitable technique from this chapter and outline how it would answer the question.
5.14 Practice With Data
- In a test cross, 2000 offspring were scored. Of these, 1860 showed parental combinations of characters and 140 showed non-parental combinations. Calculate the recombination frequency between the two loci and express the genetic distance in map units.
- Three loci P, Q and R lie on the same chromosome. The recombination frequency between P and Q is 12 per cent, between Q and R is 5 per cent, and between P and R is 17 per cent. Using these values, work out the order of the three loci along the chromosome and mark the distances in centimorgan on a simple line map.
- Two loci are 3 cM apart and two others are 21 cM apart. Out of 500 offspring scored for each pair, calculate the expected number of recombinant offspring in each case.
- A circular plasmid of 8000 bp carries three recognition sites for a particular restriction enzyme. State the number of fragments obtained on complete digestion. If two of the fragments measure 3200 bp and 2900 bp, calculate the size of the third fragment.
- A linear DNA molecule of 12 kb is digested with EcoRI alone and gives fragments of 7 kb and 5 kb. Digestion with BamHI alone gives fragments of 9 kb and 3 kb. Double digestion with both enzymes together gives fragments of 5 kb, 4 kb and 3 kb. Using these data, work out the positions of the two restriction sites and draw a labelled restriction map of the molecule.
- The table below shows the fragments obtained when the same DNA region from two individuals is digested with the same restriction enzyme and separated on an agarose gel.
| Lane | Fragment sizes obtained |
|---|---|
| Individual 1 | 4.0 kb, 2.5 kb, 1.5 kb |
| Individual 2 | 4.0 kb, 4.0 kb |
- State which individual retains the extra restriction site in this region and justify your answer using the fragment sizes.
- Explain how the total length of the region compares between the two individuals.
- Predict the pattern that would be obtained from an individual carrying one copy of each version.
- A first generation DNA sequencer has 96 capillaries and each capillary reads 850 bases in one run. Calculate the output of a single run. Calculate the minimum number of runs needed to read a bacterial genome of 4.6 Mb once over, ignoring any overlap between reads.
- A next generation sequencing run produces 40 million reads, each 150 bases long, from a genome of 3000 Mb. Calculate the total number of bases sequenced and the average depth of coverage obtained for this genome.
- A researcher wants an average depth of coverage of 30x for a genome of 120 Mb, using reads of 250 bases. Calculate the total number of bases and the number of reads required.
- A single nanopore run produces reads averaging 20 kb, while a next generation platform produces reads of 250 bases from the same sample. Calculate how many next generation reads would be needed to span the same length of DNA as one nanopore read, and comment on why long reads are helpful across repeated regions.
- An STS is defined as a unique sequence of 200–500 bp. A PCR test for a particular STS gives a product of 380 bp in DNA fragments A and C, and no product at all in fragment B.
- State what can be concluded about each of the three fragments.
- Explain why the absence of a band is itself a useful piece of mapping information.
- State one reason why a product of 1500 bp from the same primer pair would make you suspect a problem with the reaction.
- A nanopore trace records the ionic current across the pore against time. The open-pore current is 100 pA, and the four bases reduce the current to 78 pA, 65 pA, 52 pA and 40 pA respectively. The trace shows successive levels of 65 pA, 52 pA, 40 pA and 78 pA.
- Calculate the drop in current caused by each of the four bases with respect to the open-pore current.
- Write out the order in which the four bases passed through the pore, using the levels recorded.
- Explain what the depth of each dip represents and why each base gives its own characteristic value.
- An RNASeq experiment maps reads from a leaf sample and a root sample of the same plant to four genes. The counts are given below.
| Gene | Reads in leaf | Reads in root |
|---|---|---|
| W | 12 400 | 11 900 |
| X | 9 800 | 240 |
| Y | 60 | 8 700 |
| Z | 15 | 20 |
- Identify the gene that is expressed at a similar level in both tissues.
- Identify one gene that is strongly expressed in the leaf but almost silent in the root, and one showing the opposite pattern.
- What can be said about gene Z, and what caution must be kept in mind before concluding that it is switched off?
- Explain why the read count is taken as a measure of expression at all.
- Whole genome sequencing of the human genome started in 1990 and the complete sequence was published in 2003. Using these figures, calculate the duration of the project. If the human genome is taken as 3000 Mb and a modern platform can sequence it in 2 days, calculate how many times faster the modern approach is than the average rate achieved over the whole duration of the original project.
- A metagenomics study of a gut sample assembles reads into groups belonging to different organisms, with the following percentages of total reads: organism P 46 per cent, organism Q 27 per cent, organism R 18 per cent, and all others together making up the remainder.
- Calculate the percentage of reads belonging to all the remaining organisms taken together.
- If the run produced 25 million reads in total, calculate the number of reads assigned to organism R.
- A second sample from the same person after a change of diet gives organism P 21 per cent and organism Q 52 per cent. Interpret what this change suggests about the microbial community.