Chapter 6: Basic Principles of Inheritance
In the royal households of nineteenth-century Europe, a strange and frightening illness kept appearing. A small bruise would not stop swelling. A minor fall would leave a boy in agony for days because the bleeding inside his joints simply would not clot. The condition was haemophilia, and it ran through the descendants of Queen Victoria of Britain, spreading into the royal families of Spain, Prussia and Russia as her daughters and granddaughters married across the continent.
The most famous case was Alexei, the only son of the last Tsar of Russia. His illness was kept a secret from the public, and the family’s desperate search for someone who could help him became tangled with the politics of a collapsing empire.
What puzzled physicians of the time was the pattern. The disease struck the boys. The girls almost never suffered from it — yet somehow the illness travelled through them to the next generation. Mothers who were perfectly healthy gave birth to affected sons. It looked as though something invisible was being passed down, carried quietly by one sex and revealed only in the other.
That invisible something was a gene, sitting on a particular chromosome. Understanding how such units are passed from parent to offspring — sometimes hidden, sometimes shuffled, sometimes tied to sex — is what this chapter is about.
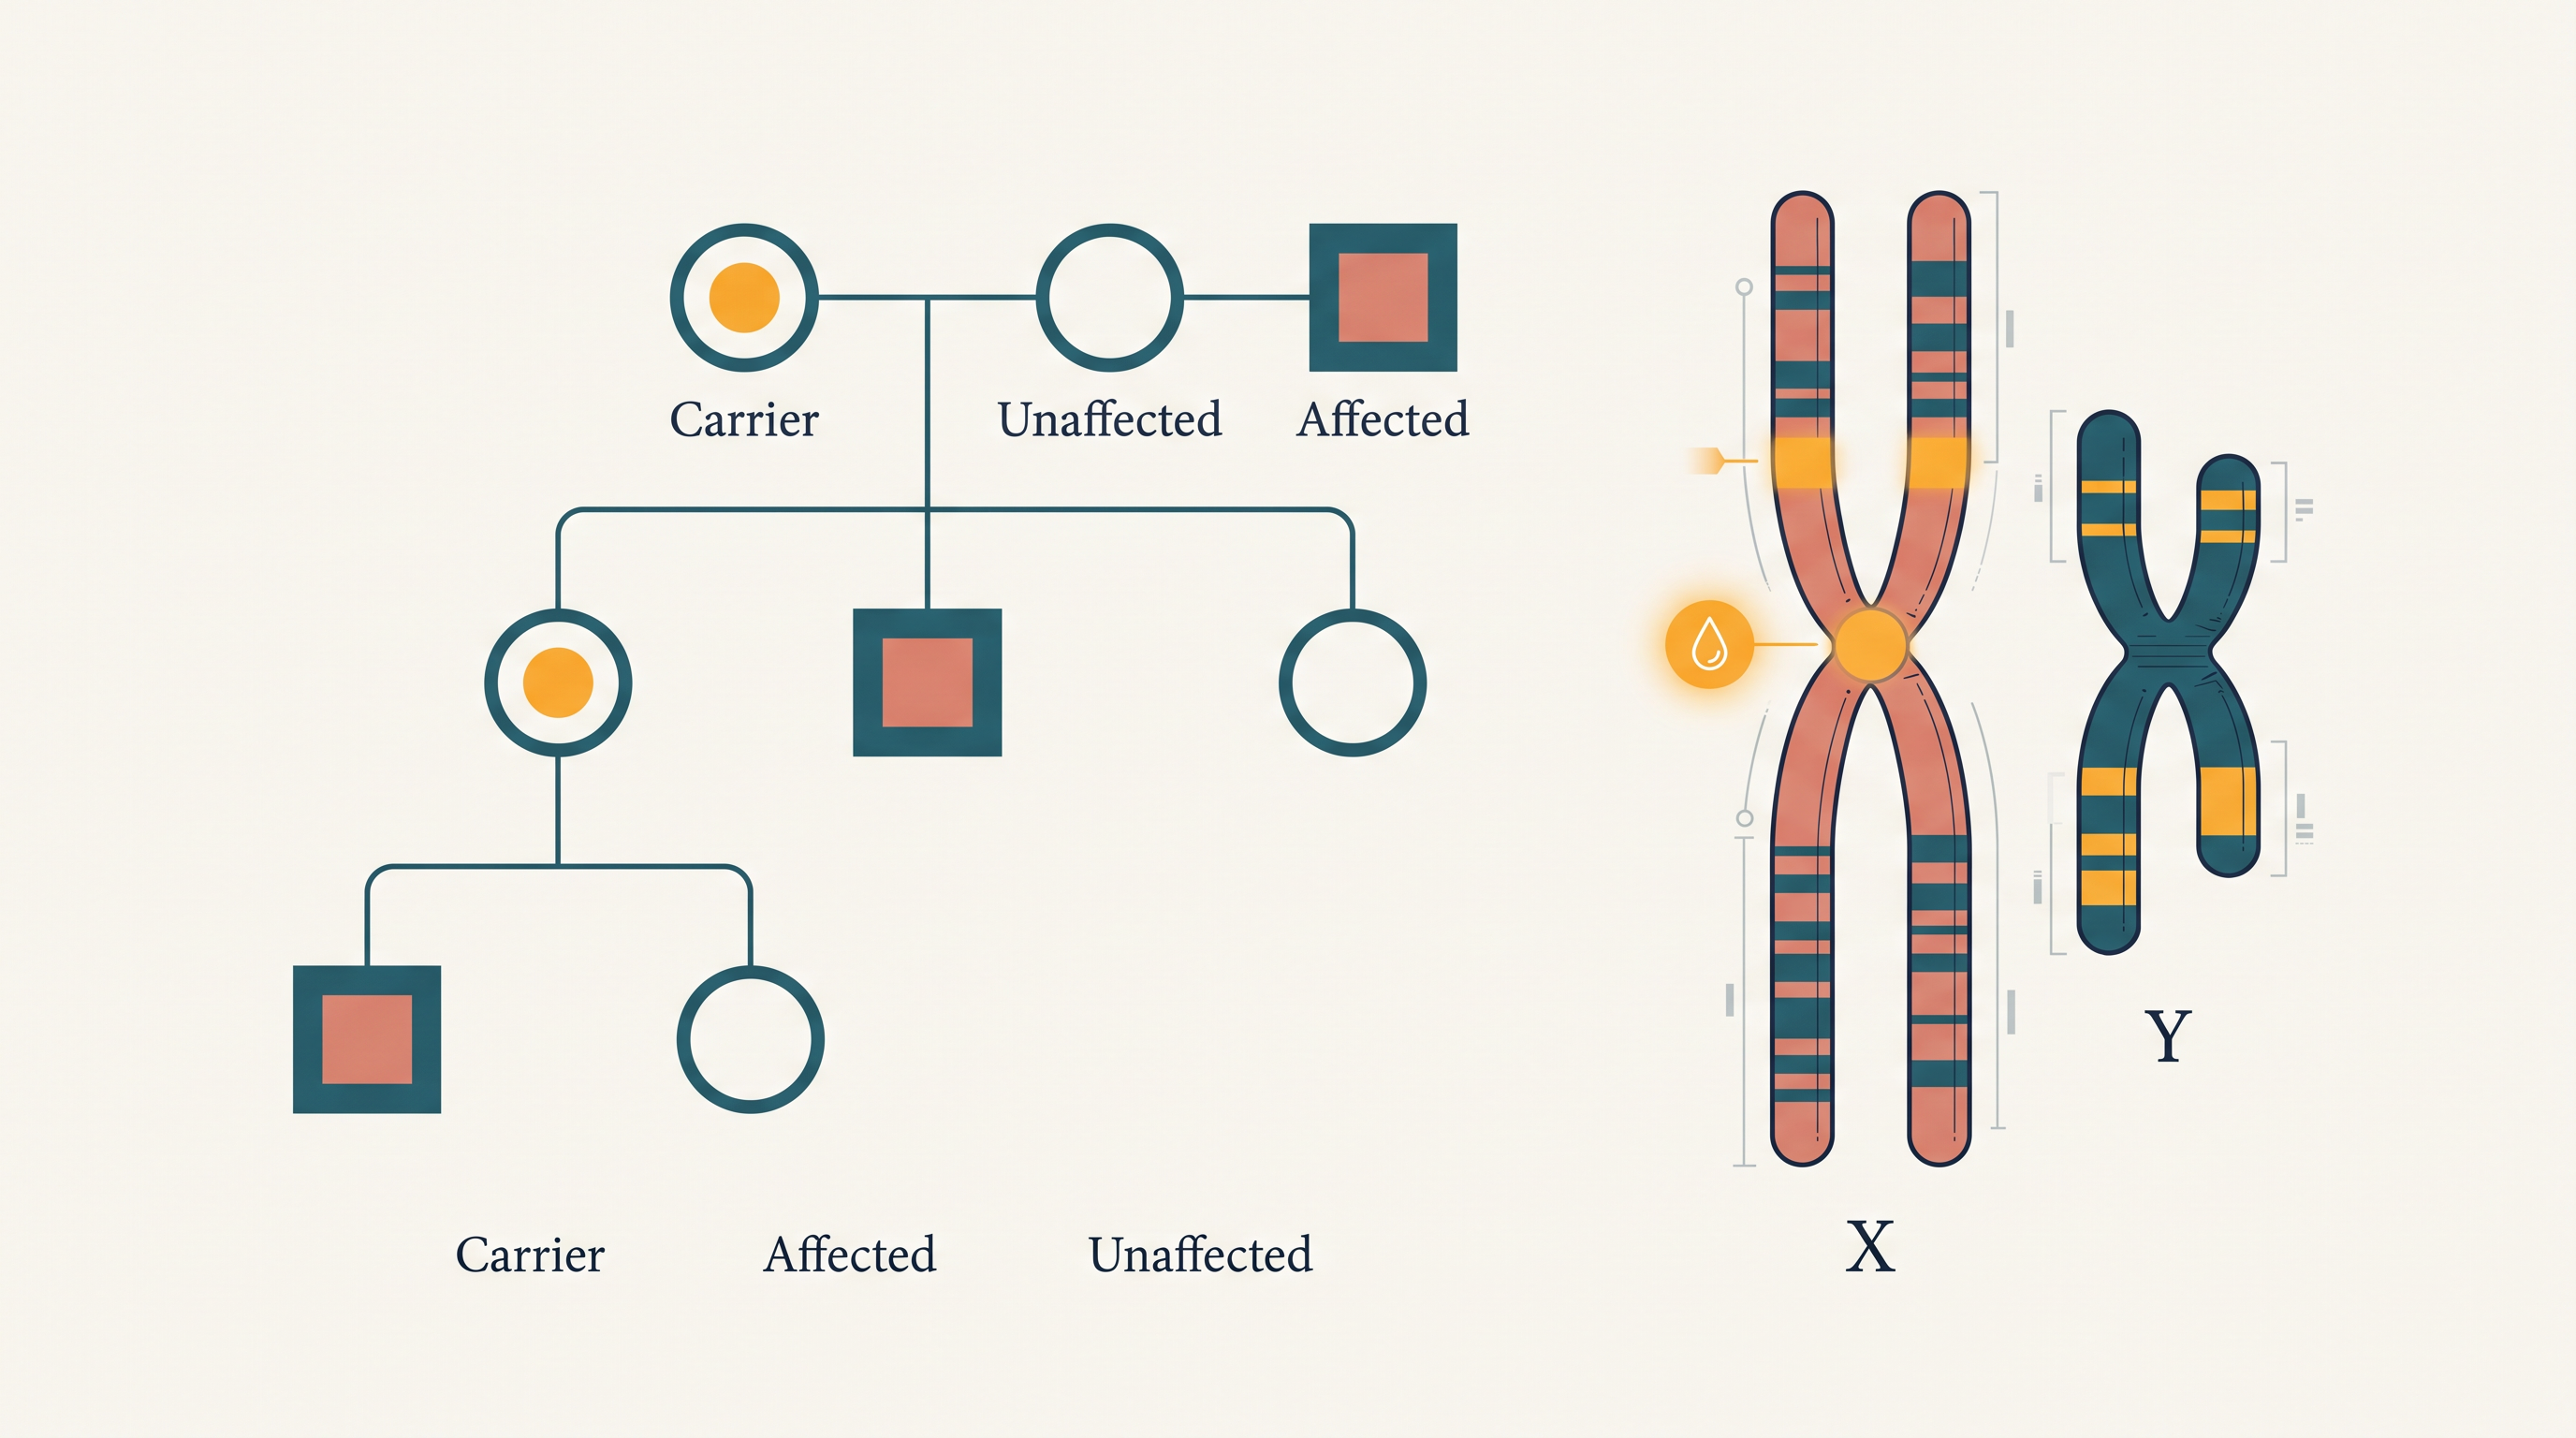
Fig. 6.0 – Haemophilia inheritance in a royal family.
Keep these five questions in mind as you read — this chapter will give you the answer to every one of them.
6.1 Introduction to Inheritance
Look carefully at the people in your family. You will almost certainly find features that repeat — the shape of a nose, the curl of the hair, the colour of the skin or eyes, even the way someone’s dimples appear when they smile. Some of these features you share with your mother, some with your father, and some with a grandparent you may have only seen in photographs.
Why should this be so? Characteristics that run in families have a genetic basis. That means they depend on genetic information that a person inherits from his or her parents. Exactly the same is true for every plant and every animal around you — a mango tree, a stray dog, a paddy plant in a field.
This passing on of characters from one generation to the next — the tendency of offspring to inherit the characters of their parents — is called heredity. The inherited characters are not carried in some vague, invisible way. They are present on the chromosomes, in the form of genes.
But heredity is only half the story. If you observe closely, you will notice that offspring are never exact copies of their parents. A child may have the father’s height but the mother’s eye colour, and a chin that resembles neither. These differences between offspring and their parents are called variations.
Heredity explains why living things resemble their parents; variation explains why they are never identical to them. The branch of science that studies the scientific facts of both heredity and variation is called genetics.
Why Biotechnology Begins with Genetics
You may be wondering why a Biotechnology textbook opens with a chapter on inheritance. The reason is practical. The major objective of biotechnology is the manipulation of living organisms — or, more precisely, the modification of the genetic constitution of an organism — so that it manufactures products intended to improve the quality of human life.
Insulin made by bacteria, a crop variety that resists a pest, an enzyme produced in a fermenter for the detergent industry: every one of these begins with a deliberate change to an organism’s genes.
Now think about what such a change demands. Before you can alter a gene, you have to know which gene controls the character you are interested in, what alternative forms of that gene exist in the population, and how those forms behave when they are passed on. In other words, to use biotechnological tools for manipulating genes, an understanding of the genetics and heredity of traits is essential.
It is essential to identify the genetic constituents — the genes and their allelic forms in the population — that regulate a trait, before that trait can be manipulated. A plant breeder who does not know whether a desirable character is dominant or recessive will not know what to expect in the next generation, and will waste years of field trials. This chapter therefore builds the foundation: the principles of inheritance on which the rest of biotechnology stands.
6.1.1 Mendel’s work: The foundation
Our modern understanding of how traits are inherited through generations comes from the studies made by Gregor Mendel, an Austrian monk. Working in a monastery garden, without a microscope powerful enough to see chromosomes and without any knowledge of DNA, he worked out the basic rules of inheritance simply by crossing plants carefully and counting the offspring.
His choice of experimental material was itself a piece of good scientific judgement. He selected pea plants (Pisum sativum) for his breeding experiments as a good model system, for several reasons. The pea is an annual plant, so a full generation is completed within a single season and results arrive quickly. It has perfect bisexual flowers, which means each flower carries both male and female parts, so a plant can be made to self-pollinate whenever the experimenter wants a pure line. And it offers many contrasting pairs of characters — features that occur in two clearly different, easily recognisable forms with nothing in between.
He selected seven pairs of contrasting characters for his breeding experiments, shown in Fig. 6.1. For each of these seven characters he first produced a pure line by self-pollinating the plants for several generations, until the character bred true and no other form appeared.
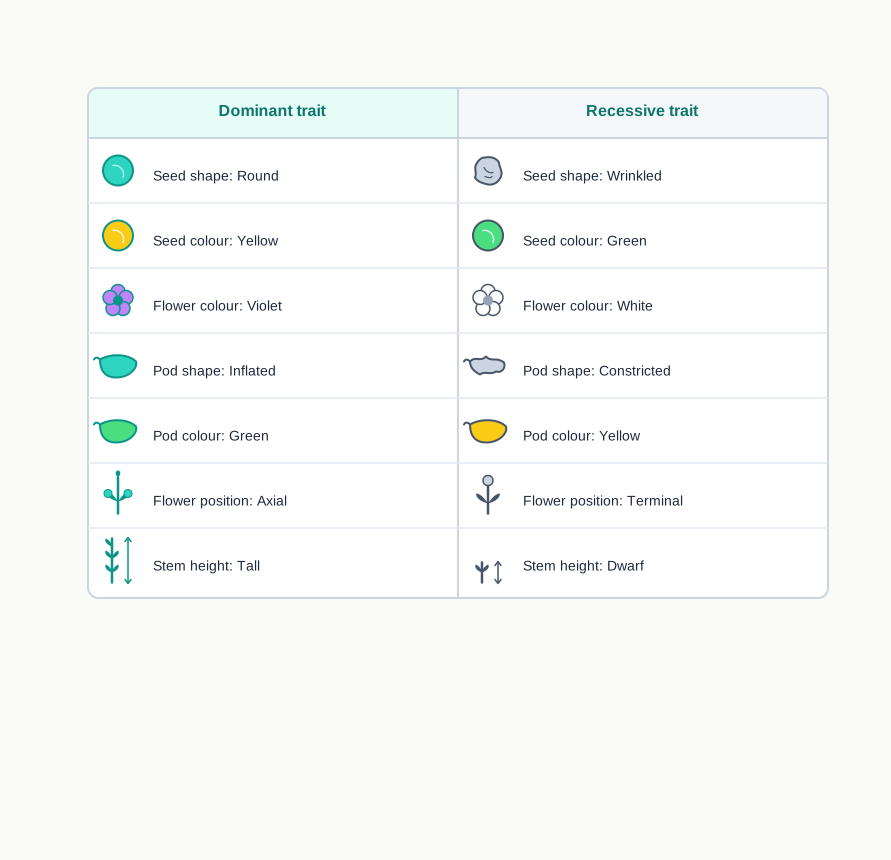
Fig. 6.1 – Seven pairs of contrasting traits in pea plants.
Why did the pure lines matter so much? Because an experiment is only readable if you know exactly what you started with. If Mendel’s “tall” parent had secretly carried a hidden dwarf factor, the offspring would have been a confusing mixture and no clean ratio would ever have emerged. Producing pure lines first was what made the later counting meaningful.
He then performed artificial cross pollination in plants with contrasting traits, transferring pollen from one flower to another with a small brush. To do this reliably he had to prevent the flower from pollinating itself, and then place pollen from the chosen parent on its stigma — so that the parentage of every seed was known with certainty.
Finally, he grew a large number of plants for each cross and collected data for several generations. This last step is easy to overlook, but it is the heart of his success. Inheritance behaves like a game of chance, and chance only reveals its rules over large numbers. Ten plants would have given him noise; hundreds gave him ratios. The whole sequence he followed is summarised in Fig. 6.2.
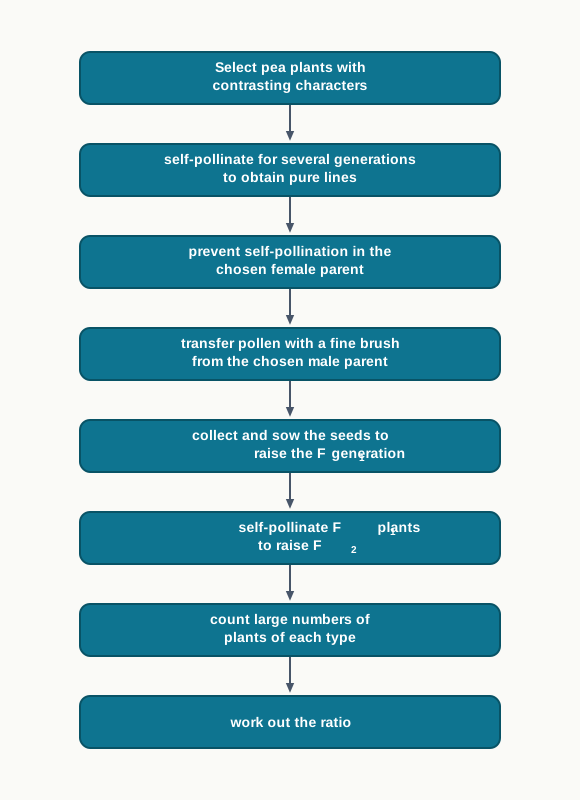
Fig. 6.2 – Mendel’s experimental method.
Single gene inheritance
Mendel began with the simplest possible experiment: one character at a time.
When he cross pollinated a pure (homozygous) tall pea plant with a pure dwarf pea plant, he noticed that the progeny of the first generation were all tall. This first generation is called the first filial or F₁ generation, and it was raised by collecting the seeds produced from that cross. The dwarf phenotype was simply missing.
What happened to the dwarf trait? Had it been destroyed? Diluted away? Mendel answered this by taking the next step. When the F₁ offspring were self-pollinated to raise the F₂ generation, both tall and dwarf plants appeared — and they appeared in the ratio of 3:1, that is, 3 tall to 1 dwarf.
Since Mendel designed this experiment by considering only one contrasting trait, namely tall and dwarf, this cross is called a monohybrid cross (Fig. 6.3). The full sequence is set out in Fig. 6.4.
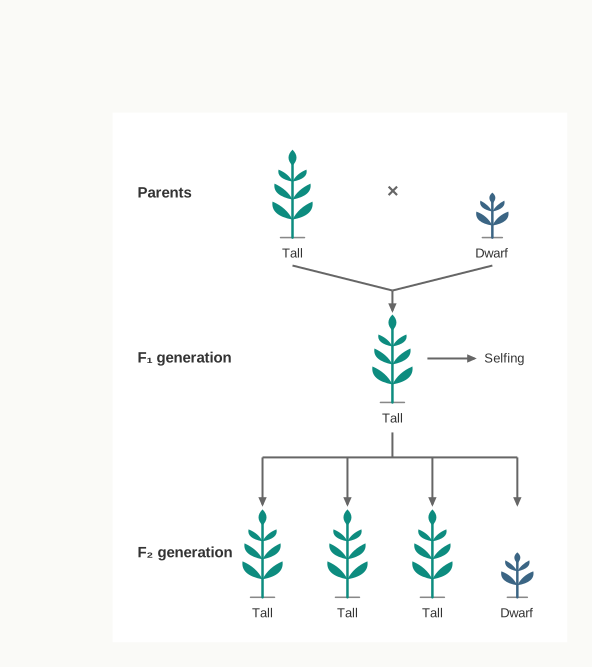
Fig. 6.3 – Monohybrid cross in pea plants.
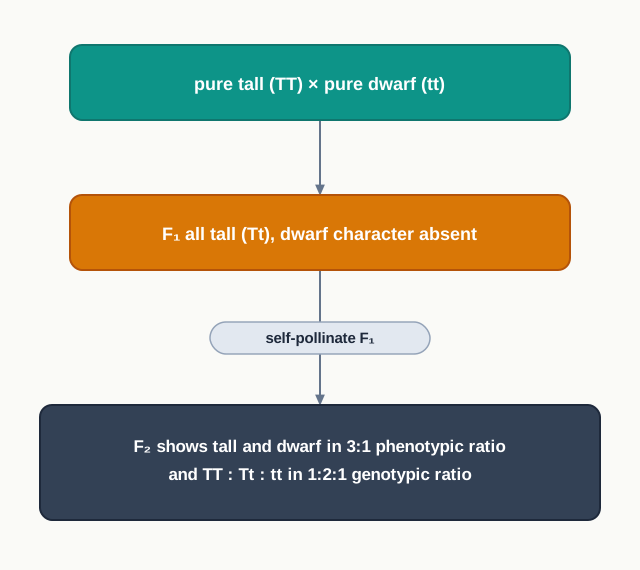
Fig. 6.4 – Monohybrid cross ratios.
Interestingly, in all such monohybrid crosses involving the other contrasting pairs of characters carried out by Mendel, a similar ratio of approximately 3:1 was obtained in the F₂ generation. Round versus wrinkled seed, violet versus white flower, inflated versus constricted pod — the same 3:1 came back every time. A rule that repeats across seven independent characters is no accident.
These results prompted Mendel to propose that each individual has two factors for each character (trait), and that one factor — later named a gene — was inherited from each parent through the gametes.
This proposal explains the puzzle neatly. The dwarf feature was not destroyed in the F₁ generation; it was present but not expressed, and it reappeared in F₂. Hence the F₁ tall plants are heterozygotes, as they contain two different alleles (Tt). Since the F₁ plants are heterozygous yet tall, the tall allele (T) must be dominant over the dwarf allele (t). Thus the dwarf allele (t) is recessive to the tall allele (T).
Two useful words follow from this. When the two alleles present in an individual are alike (TT or tt), the individual is said to be homozygous for that character; when they are different (Tt), it is heterozygous.
Reading a Punnett square
The outcome of these crosses can be understood far more easily through a graphical representation developed by Reginald C. Punnett, a British geneticist. Using a Punnett square, we can easily calculate the probability of all possible genetic combinations, or genotypes.
The idea behind it is simple. Write the possible gametes of one parent along the top, the possible gametes of the other parent down the side, and fill each cell with the combination that results from that particular pair of gametes meeting. Every cell is one equally likely outcome of fertilisation.
We can see in Fig. 6.5 that when the heterozygous F₁ plants were self-pollinated, they produced two kinds of gametes, ‘T’ and ‘t’. The progeny then revealed three genotype combinations — TT, Tt and tt — in the ratio of 1:2:1 respectively.
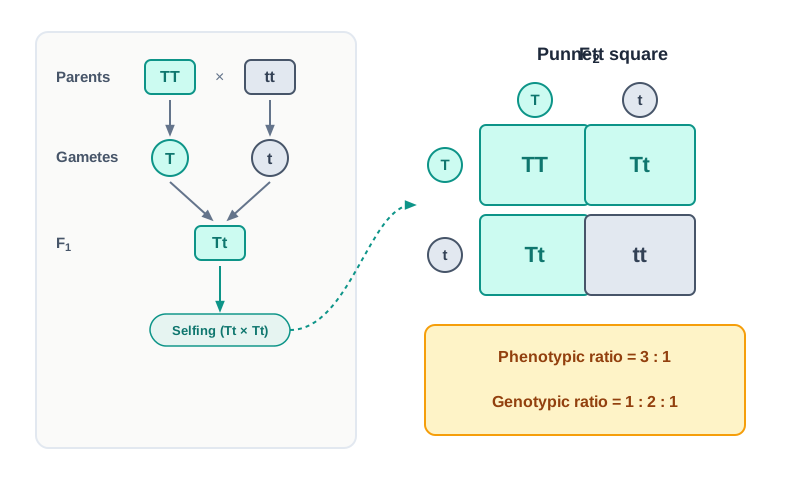
Fig. 6.5 – Segregation of the height character in pea plants.
Here we learn something important: through the Punnett square, by using simple mathematics, we can easily calculate the probability of the genotype (the genetic make-up) and the phenotype (the morphological or observable traits) of future progeny.
Notice how the two ratios relate. Three of the four boxes contain at least one T and are therefore tall; only one box is tt and dwarf. This clearly shows that the phenotypic ratio of a monohybrid cross is 3:1, while the genotypic ratio is 1:2:1. The genotypic ratio always carries more information than the phenotypic ratio, because two different genotypes — TT and Tt — hide behind the same tall appearance.
The test cross
Are you able to tell the genotype of a particular plant merely by looking at it? For example, can you say whether a tall plant of the F₁ or F₂ progeny has the genotype TT or Tt?
You cannot — and this is a real practical problem, not just an academic one. A breeder who sells “pure” tall seed needs to be certain that the parent plant is TT and not Tt, otherwise dwarf plants will turn up unexpectedly in the customer’s field.
For such an analysis, the F₁ and F₂ tall plants are crossed with dwarf plants. The appearance of both tall and dwarf plants in the succeeding generation confirms the heterozygous genotype of the said plant. Such a cross is called a test cross (Fig. 6.6).
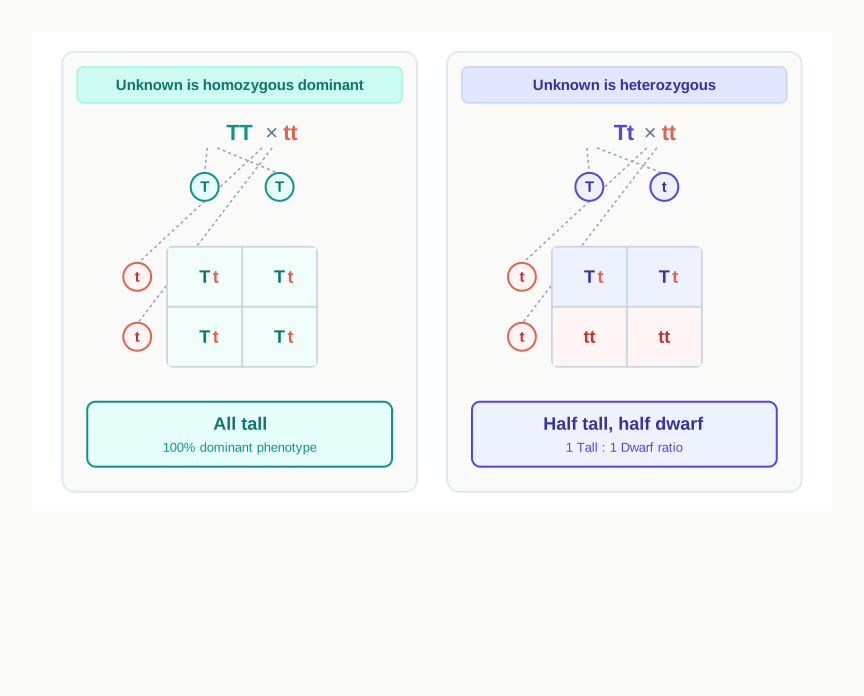
Fig. 6.6 – Test cross for identification of genotype.
Why choose the dwarf, recessive plant as the tester? Because the dwarf plant can only form t gametes. It contributes nothing that could mask the contribution of the unknown parent, so whatever appears in the offspring is a direct readout of what the unknown parent supplied. If the unknown plant were crossed with a TT plant instead, every offspring would be tall regardless of the unknown genotype, and the test would tell you nothing.
From all these crosses two inferences can be drawn. First, out of two contrasting characters, one is dominant and the other is recessive — this is what Mendel’s law of dominance is all about. Second, the alleles of these traits do segregate while being inherited, as we have seen in the cross above; this is called the law of segregation.
Incomplete dominance
Mendel’s seven characters all behaved in the same neat way, but nature is wider than a pea patch. When similar experiments were conducted with other plant varieties, it was observed that the F₁ hybrids were not related to either of the parents, but exhibited a blending, or intermediate, form of the characters of the two parents.
This means the two alleles of one trait are not related as dominant and recessive. Instead, the dominant gene in the heterozygous condition has reduced expression, so that each of the alleles expresses itself partially. This is called incomplete dominance.
The classic example is the four-o’clock plant, Mirabilis jalapa. When homozygous plants with red flowers (RR) are crossed with homozygous plants having white flowers (rr), the F₁ plants (Rr) bear pink flowers. When these F₁ plants with pink flowers undergo selfing, they yield a 1:2:1 ratio of red, pink and white (Fig. 6.7).
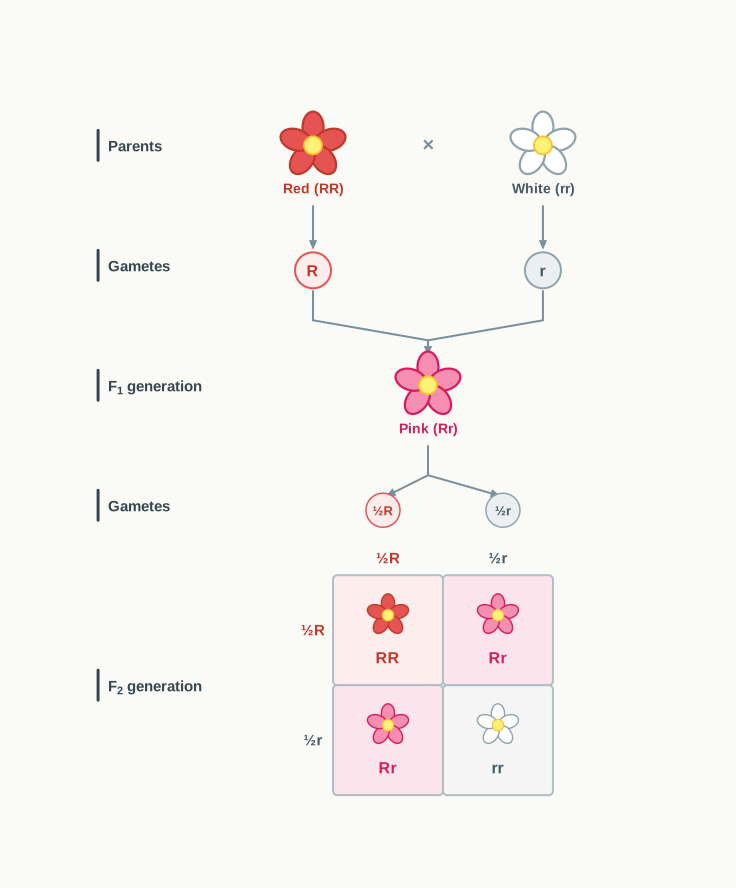
Fig. 6.7 – Incomplete dominance in the four-o’clock plant.
Read that F₂ ratio carefully, because it carries a lesson. Here the phenotypic ratio 1:2:1 is exactly the same as the genotypic ratio. That happens because each genotype now has its own distinct appearance — nothing is hidden. The 3:1 phenotypic ratio of ordinary dominance appears only because two genotypes share one appearance.
Notice also that the pink colour is not a permanent blending. If pink flowers were a true blend, the red and white forms could never be recovered. They do reappear in F₂, which proves that the R and r alleles remained separate and unchanged inside the pink plant. The alleles did not mix; only their expression combined.
Codominance
So far we have seen that both alleles in the heterozygous condition either have a dominant–recessive relationship, expressing only the dominant trait, or have an incompletely dominant relationship, producing an intermediate trait.
Many instances have been seen in which alleles of both parents get equally expressed in the F₁ heterozygote. This condition is known as codominance. It is observed in the coat colour of cattle and in the MN blood group of human beings (Fig. 6.8).
Inheritance of coat colour in many cattle, such as horses, cows and dogs, is an example of codominance. When pure red (RR) is crossed with pure white (WW), the F₁ generation will have a roan (RW) coat colour, which is heterozygous.
Roan coat colour is a mixture of white and pigmented coat colours that does not fade as the animal ages. Look closely at a roan animal and you will not see a uniform pink coat; you will see white hairs and coloured hairs side by side. Both the red (RR) and white (WW) traits are equally expressed in the F₁. Therefore, the F₁ generation progeny will have roan coat colour.
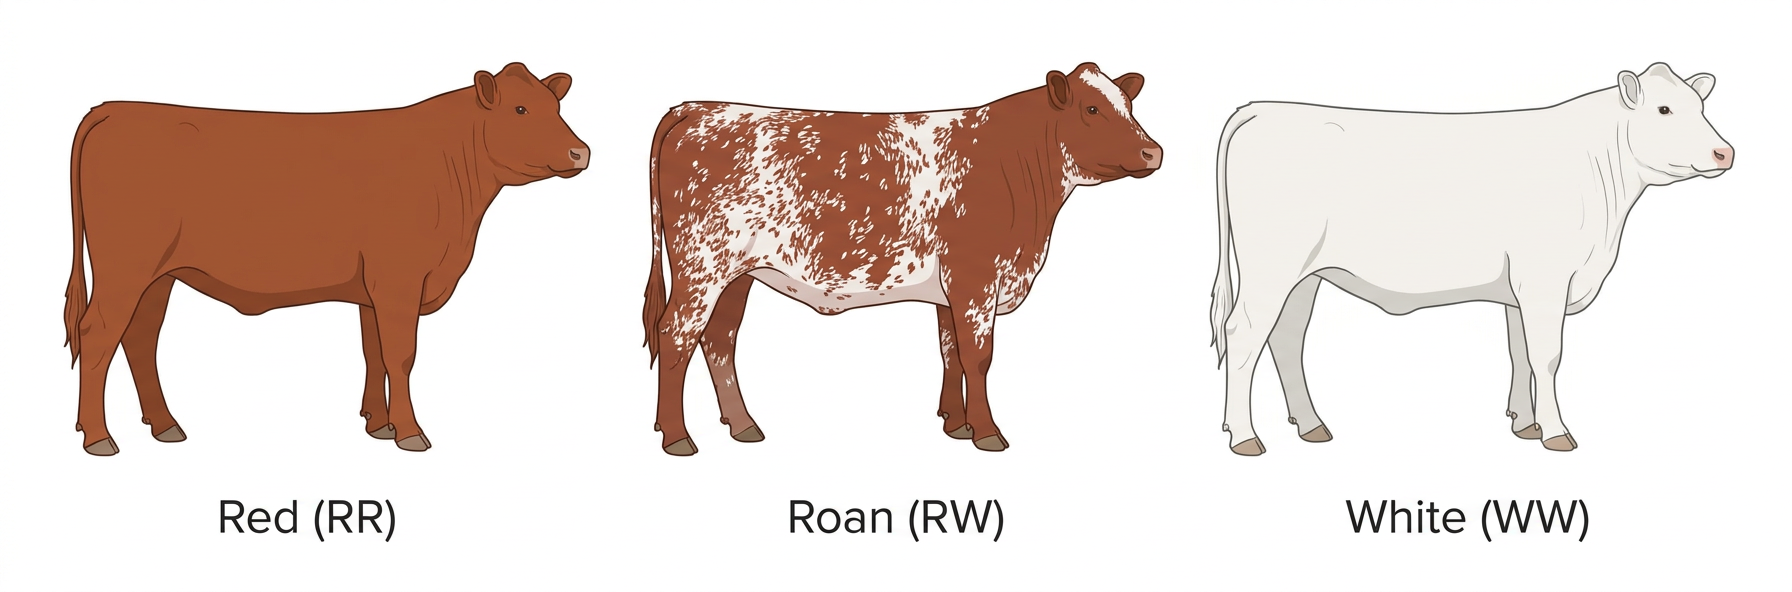
Fig. 6.8a – Codominance in cattle coat colour.
The MN blood group of human beings makes the same point at the molecular level. Here the two alleles code for two different antigens on the surface of the red blood cell, and a heterozygous person makes both.

Fig. 6.8b – The human MN blood group system.
Law of independent assortment
Let us now consider a dihybrid cross between a homozygous round-shaped and yellow-coloured (RRYY) seeded pea plant and a homozygous wrinkled and green-coloured (rryy) seeded pea plant. All the F₁ progeny were round seeded and yellow in colour.
Can you guess from this which traits are dominant and which are recessive? In the F₁ progeny, as all plants were round and yellow seeded, it clearly showed that round and yellow are dominant over the wrinkled and green seeded traits.
The result of the F₂ generation upon selfing is explained in Fig. 6.9, in which a ratio of 9:3:3:1 is observed — 9 round yellow, 3 wrinkled yellow, 3 round green and 1 wrinkled green. Since two pairs of contrasting characters are included in such crosses, they are called dihybrid crosses.
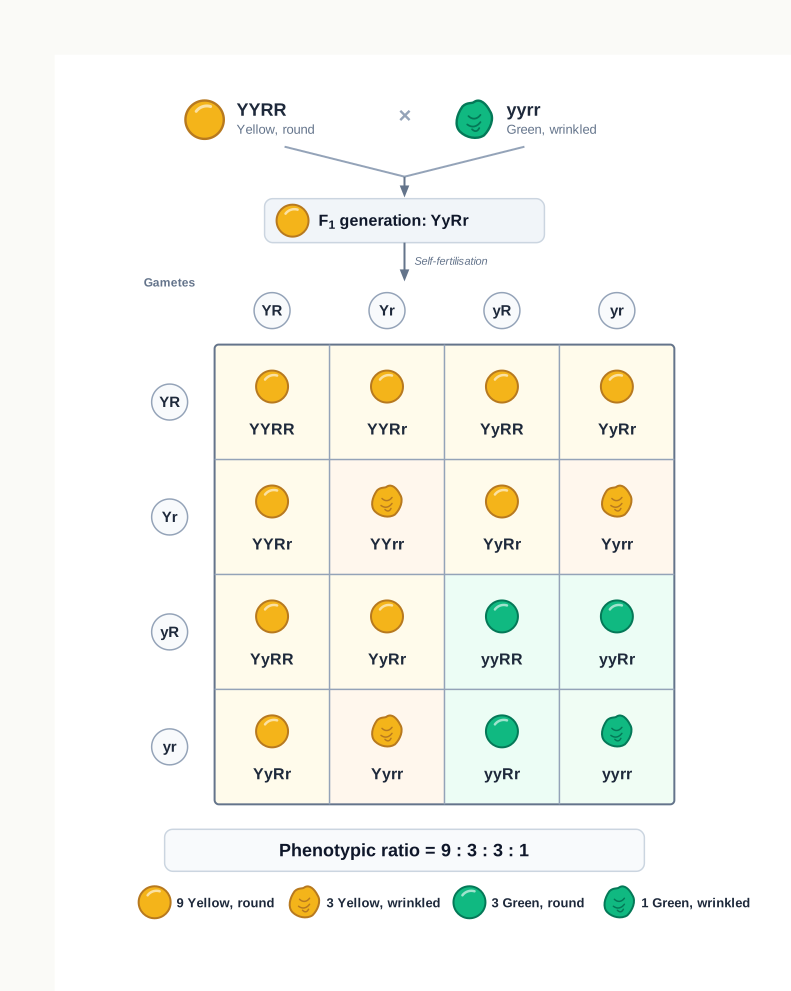
Fig. 6.9 – Dihybrid cross and independent assortment.
Based upon such observations on dihybrid crosses, the third principle of inheritance — the Law of Independent Assortment — was proposed.
There is an interesting observation to be made in such a dihybrid cross. Not only do the parental traits reappear in F₂, but there are also new combinations of traits, namely round-shaped seed with green colour, and wrinkled seed with yellow colour (Fig. 6.9).
This is the key observation, so pause on it. Neither parent had a round green seed, yet round green plants appear in F₂. Such a new combination is possible only in a situation where the factors or genes controlling a specific trait are inherited independent of each other. Had the two characters been forced to travel together, only the two parental combinations could ever have appeared.
Such a pattern of inheritance is known as the principle of independent assortment of alleles.
How This Section Is Tested
Board and competitive papers rarely ask you simply to state a law. They ask you to use it. The commonest formats are: being given a cross and asked to derive the genotypic and phenotypic ratios; being given an unexpected ratio in the offspring and asked what it tells you about the parents’ genotypes; assertion–reason items pairing a statement about incomplete dominance with a reason about codominance; and diagram questions in which a partly filled Punnett square must be completed. In every one of these, the safest habit is the same — write down the parental genotypes first, then the gametes, and only then the grid.
6.2 Linkage and Crossing Over
We have already learnt that there are several phenotypic traits in the body of an organism, such as the colour of the flower (red or white) and the shape of the pollen (round or elliptical) in pea. Each of these phenotypic traits is determined by a pair of alleles, which is located at a specific gene locus of the homologous chromosomes — and these chromosomes may be autosomes or sex chromosomes.
A locus is simply the fixed address of a gene on a chromosome. The two members of a homologous pair carry the same set of loci in the same order, which is why they carry a pair of alleles for every character.
Thus, organisms may have numerous genes for their various phenotypic traits. As you know, in humans there are 20,000 to 25,000 protein coding genes present on 23 pairs of chromosomes. Divide one number by the other and the consequence becomes obvious: each chromosome contains several genes — hundreds, or even more than a thousand.
Are Genes Inherited Together or Separately?
Can you think whether the genes present on each chromosome are inherited together or independently?
Here is the difficulty. Mendel’s law of independent assortment says that the factors of one character are inherited independently of the factors of another. But a chromosome is one physical thread. When it moves to a pole during meiosis, everything written along it moves with it. Because several genes are present in a chromosome, they should be inherited together as a unit during meiosis.
This phenomenon of the inheritance of genes together, and their retention of the parental combination even in the offspring, is known as linkage.
The genes located on the same chromosome and being inherited together are known as linked genes, and the characters controlled by these genes are known as linked characters. All the genes located on a single chromosome constitute a linkage group.
It follows that the number of linkage groups in an organism equals its number of chromosome pairs — for a species has as many linkage groups as it has different chromosomes.
The Sweet Pea Puzzle
W. Bateson and R. C. Punnett provided the evidence in favour of linkage in their experiments on sweet pea (Fig. 6.10). They crossed plants having red flowers and long pollen grains with plants having white flowers and short pollen grains.
All the plants in the F₁ progeny had red flowers with long pollen grains, thus indicating that the alleles for these two phenotypes were dominant. So far, nothing unusual — this is exactly what a dihybrid cross should give.
When the F₁ progeny was self pollinated, however, they observed a peculiar distribution of genotypes among the offspring (Fig. 6.10). The four expected classes did appear, but not in the expected proportions. The two parental types were far too common, and the two new combinations were far too rare.
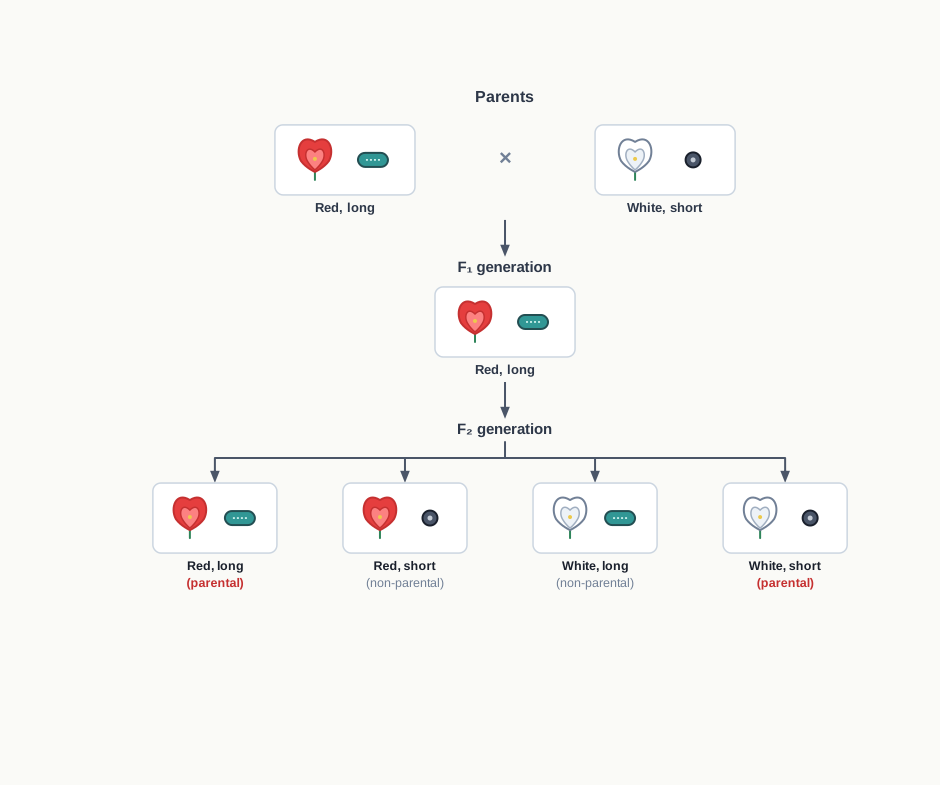
Fig. 6.10 – Bateson and Punnett’s experiment on sweet pea.
Bateson and Punnett could not provide the correct explanation for this experiment. Later on, similar kinds of experiments on Drosophila performed by Morgan and his colleagues in 1910 provided the explanation for the same, which is discussed in the next section.
The data revealed that the genes for flower colour — red (R) and white (r) — and for pollen grain length — long (L) and short (l) — do not assort independently as expected. The correct explanation for the lack of independent assortment in the data is that the genes for flower colour and pollen length are located on the same chromosome; that is, they are linked. This is explained in the diagram (Fig. 6.11).
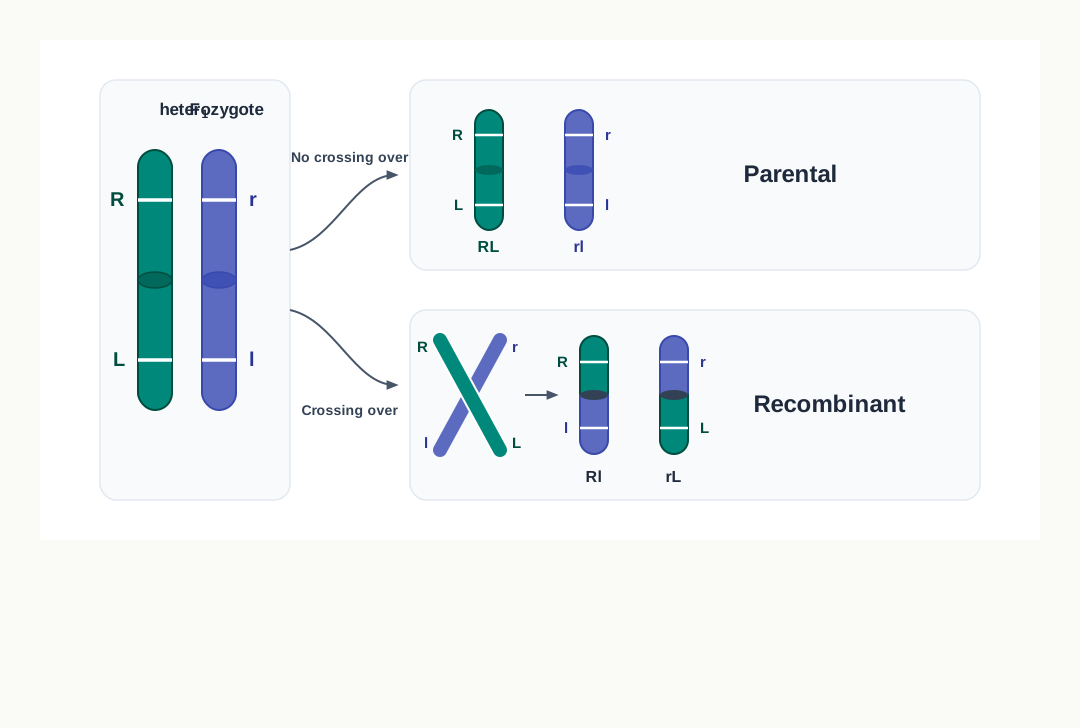
Fig. 6.11 – Linkage and crossing over among genes.
Look at Fig. 6.11 in this way. In the F₁ plant, R and L sit on one chromosome of the pair and r and l sit on the other. If that pair of chromosomes separates unchanged, only two kinds of gametes can be made — RL and rl — and only parental combinations can appear in the offspring. Any offspring showing Rl or rL is therefore direct evidence that something exchanged material between the two chromosomes.
Morgan’s Evidence from Drosophila
Later on, Morgan (1910) suggested that the genes are present in a linear fashion in the chromosome — arranged one after another along its length, like beads on a string, each at its own fixed locus. All the genes present in the same chromosome are inherited together generation after generation, retaining the parental combination.
A cross between a homozygous grey bodied, vestigial winged (BBvv) Drosophila and a black bodied, long winged (bbVV) Drosophila produced grey bodied and long winged (BbVv) flies in the F₁ generation. Grey body is therefore dominant over black body, and long wing over vestigial wing.
When these flies were crossed with a double recessive fly (bbvv), surprisingly, in addition to the parental combination (83 per cent), a non-parental (17 per cent) combination appeared.
This indicated that linked genes do not stay together always, but may get separated due to the exchange of segments during gametogenesis. This phenomenon of interchange of chromosome segments is known as crossing over (Fig. 6.12).
Let us set out the reasoning once more, because it is the reasoning, not the numbers, that examiners test. The linked genes are located on the same chromosome in a linear fashion. If chromosomes remain intact during inheritance, the genes located on one chromosome should be inherited together generation after generation, and only parental combinations must appear in the F₂ generation.
But in most of the cases, though parental combinations are more numerous, non-parental combinations also appear. This indicates that the linked genes do not always stay together, but get separated many a time. They get separated with an interchange of alleles, resulting in the appearance of non-parental combinations.
Reading Morgan’s Numbers
When Morgan mated grey bodied vestigial winged (BBvv) and black bodied long winged (bbVV) Drosophila, it produced an F₁ hybrid, all of them having grey body and long wings (BbVv). When female flies of the F₁ generation were crossed with double recessive males having black body and vestigial wings (bbvv), four types of offspring were produced, as follows:
- Grey vestigial — 41.5 per cent
- Grey long — 8.5 per cent
- Black vestigial — 8.5 per cent
- Black long — 41.5 per cent
In this case parental combinations are 83 per cent and non-parental combinations are 17 per cent. This phenomenon, in which non-parental combinations appeared due to the interchange of alleles, is called crossing over.
Notice which classes are the parental ones. The original parents were grey vestigial (BBvv) and black long (bbVV), so grey vestigial and black long are the parental combinations, and together they account for \(41.5 + 41.5 = 83\) per cent. Grey long and black vestigial are the new combinations, together accounting for \(8.5 + 8.5 = 17\) per cent.
Notice also the design of the cross. The F₁ female was mated to a double recessive male — that is, a test cross. The recessive parent contributes only b and v alleles, so the appearance of each offspring is a direct readout of the gamete it received from the F₁ female. The percentages above are therefore the percentages of gamete types she produced.
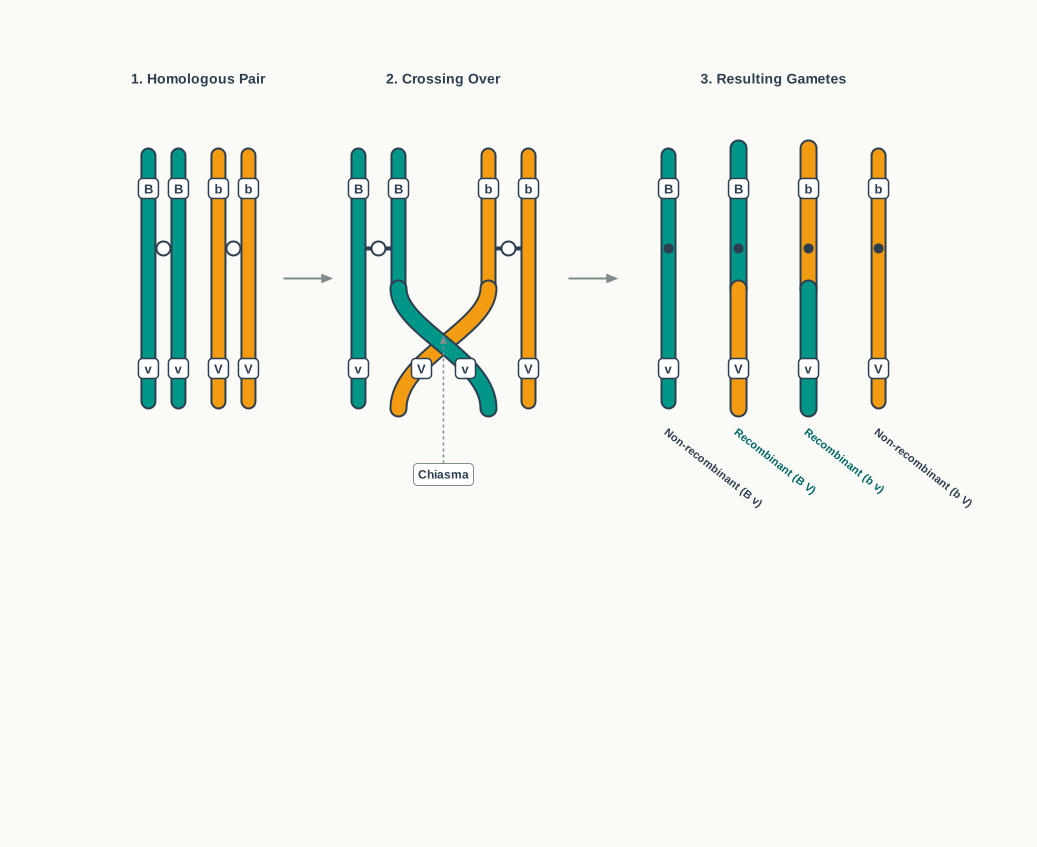
Fig. 6.12 – Single cross over between two non-sister chromatids.
Study Fig. 6.12 carefully, because two details in it are frequently asked. First, the exchange takes place between non-sister chromatids — that is, between one chromatid of the maternal chromosome and one chromatid of the paternal chromosome. Sister chromatids are identical copies, so an exchange between them would change nothing. Second, only two of the four chromatids take part in a single cross over, which is why two of the four resulting chromatids stay non-recombinant.
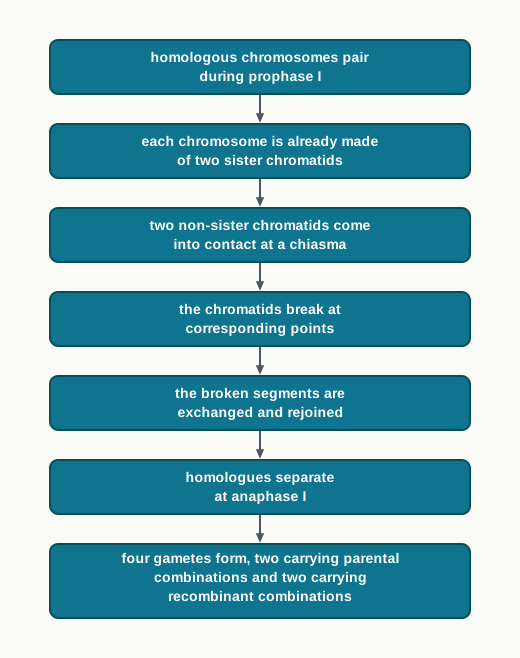
Fig. 6.13 – Crossing over during meiosis.
How This Section Is Tested
Questions on linkage almost always give you a set of offspring numbers and ask what they mean. Train yourself to do three things in order: first, identify the parental combinations by looking back at the original parents, not at the largest numbers; second, add up the parental and the non-parental classes separately and convert them to percentages; third, state the conclusion — a marked excess of parental types means the two genes are linked. Diagram-based questions usually ask you to label a cross over between non-sister chromatids, or to sort four resulting chromatids into recombinant and non-recombinant.
6.3 Recombination
The concept of recombination was very quickly observed by geneticists after the rediscovery of Mendel’s principles of inheritance in the year 1900. Once biologists began looking systematically for Mendelian ratios, the cases that refused to fit those ratios became just as interesting as the cases that fitted them.
The experiments performed by W. Bateson and R. C. Punnet in sweet pea clearly established that all genes do not assort independently. This was evident in the dihybrid cross performed in sweet pea, which we examined in the previous section — but it is worth looking again at the numbers rather than at the mechanism.
Crossing a pure line of red flower having long pollen grains with white flower having short pollen grains resulted in the expected red flower and long pollen offspring in the first generation. But among the selfed F₂ offspring, more than 50% of the offspring had parental combinations of red-long and white-short for flower colour and pollen shape. Recombinants — that is, red flower having short pollen and white flower having long pollen — were less than 50%. This was a deviation from the expected 9:3:3:1 ratio (Fig. 6.10).
The word recombinant is worth pausing on. A recombinant is simply an offspring showing a combination of characters that neither parent possessed. Recombination is the process that produces such offspring.
From Observation to Explanation
Though the initial explanation suggested by Bateson and Punnet was different, later this was established as the phenomenon of linkage, in which genes situated on one chromosome are inherited together.
The appearance of recombinants was attributed to the phenomenon of crossing over, in which the exchange of parts of homologous chromosomes during meiosis may result in recombinants. Obviously, the percentage of such recombinants is expected to be less in comparison to independently assorting traits, as has been observed in the experiment described earlier.
Why “obviously”? Consider the two situations side by side. If two genes lie on different chromosomes, every meiosis reshuffles them freely and half the gametes carry new combinations. If the two genes lie on the same chromosome, a new combination can arise only in those cells where an exchange happens to occur between the two loci — and that is a minority of cells. So linkage always pushes the recombinant percentage below the free-assortment value.
Later, similar experiments performed in Drosophila melanogaster by Thomas Hunt Morgan provided many instances of linkage and recombination.
Mapping Chromosomes with Recombination Frequency
Morgan’s work led to something far more useful than a mere explanation. Based on the frequency, or percentage, of recombinants, a physical map of the chromosomes of a number of organisms was prepared.
The reasoning behind such maps is beautifully simple. Crossing over can occur at almost any point along a chromosome. The farther apart two genes lie, the greater the length of chromosome between them, and therefore the greater the chance that an exchange will fall in that gap and separate them. Recombination percentage is therefore a measure of distance.
In preparing such a physical map of the chromosome, 1% of recombinants between two traits was designated to be apart by 1 map unit, or 1 centimorgan (cM), the unit being named in Morgan’s honour.
The recombination frequency itself is calculated as
\[\text{Recombination frequency (\%)} = \frac{\text{Number of recombinant offspring}}{\text{Total number of offspring}} \times 100\]
where the numerator counts only those offspring showing non-parental combinations of the two characters, the denominator counts all the offspring scored, and the result is a pure percentage with no unit. Converting it to distance is then direct:
\[1\% \text{ recombination} = 1 \text{ map unit} = 1 \text{ centimorgan (cM)}\]
Seeing the Exchange Under the Microscope
Further evidence came from cytology — the direct microscopic study of chromosomes. The cytological studies of meiosis and the appearance of chiasmata in the first meiotic division, when the homologous chromosome pair separates in the reductional division, provided insight about the direct connection of recombinants with the exchange of parts of the homologous chromosome pair.
A chiasma is the X-shaped point of contact seen between the chromatids of a paired homologous chromosome set during the first meiotic prophase, as shown in Fig. 6.14. Its position marks where the chromatids have exchanged material and are still held together.
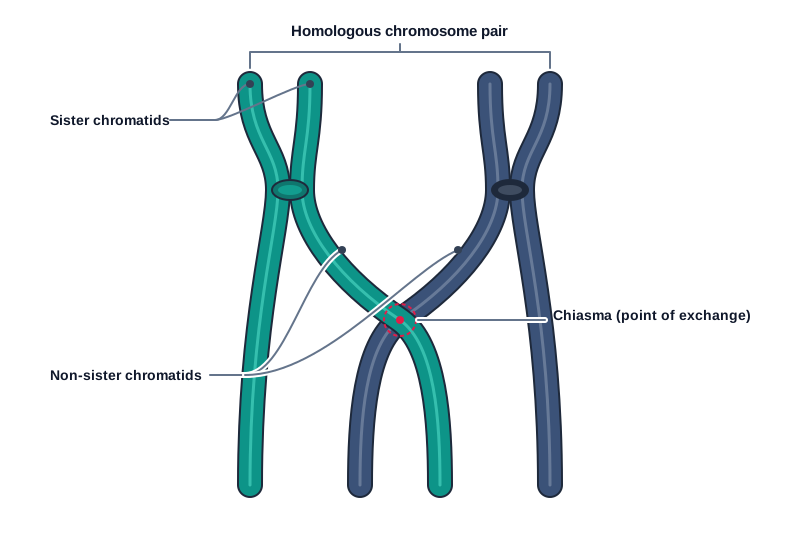
Fig. 6.14 – Homologous chromosomes at the first meiotic prophase.
But a chiasma seen under the microscope shows only that chromatids are touching. It does not by itself prove that genetic material has actually been swapped. To prove that, someone had to find a chromosome pair whose two members could be told apart by eye, and then show that the exchange of genes is accompanied by an exchange of the visible parts.
The Creighton and McClintock Experiment
One of the initial pieces of evidence that crossing over is responsible for recombination came from the classical experiment performed by Harriet Creighton and Barbara McClintock (1931) in maize.
Based on their careful observation, they found that some of the homologous chromosomes can be morphologically distinguished. In their investigation, two types of chromosome 9 were identified. One of the pair was a normal one, whereas the other had a heterochromatic knob at one end of the chromosome and a small piece of another chromosome on the other end of it. You have already studied chromosomal aberration and understood how these may arise.
This abnormal chromosome was the key to the whole experiment. It carried two physical labels — a knob at one end and a foreign piece at the other — that were visible under the microscope, so its two ends could be tracked individually.
In their experiment, two traits were used as markers to understand recombination. One was the gene responsible for the colour of the kernel, that is, coloured (C) versus colourless (c). The other was the gene responsible for the texture of the kernel, that is, starchy (Wx) versus waxy (wx).
The performance of the cross as per Fig. 6.15 provides evidence that during crossing over, an exchange of parts of homologous chromosomes occurs.
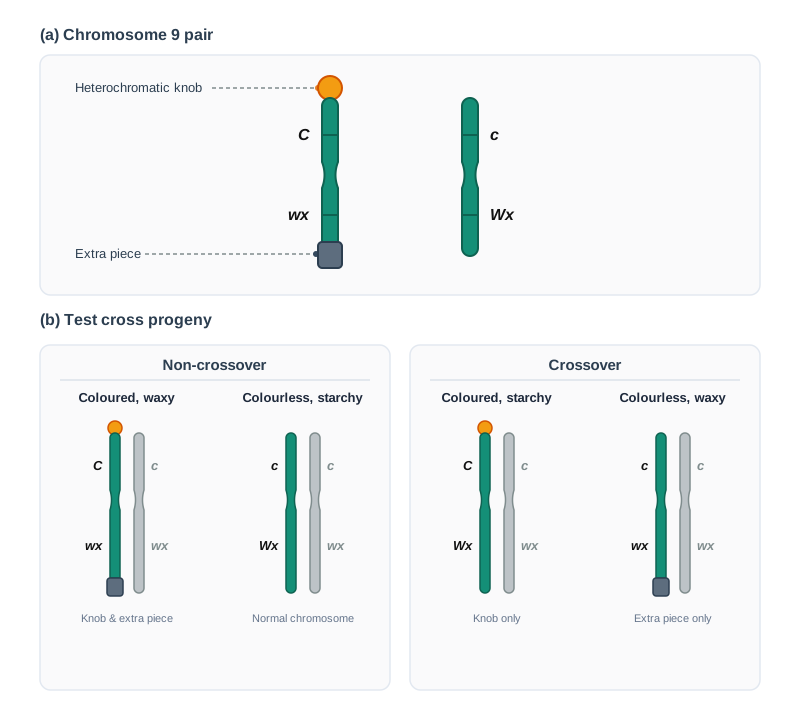
Fig. 6.15 – Experimental evidence of crossing over.
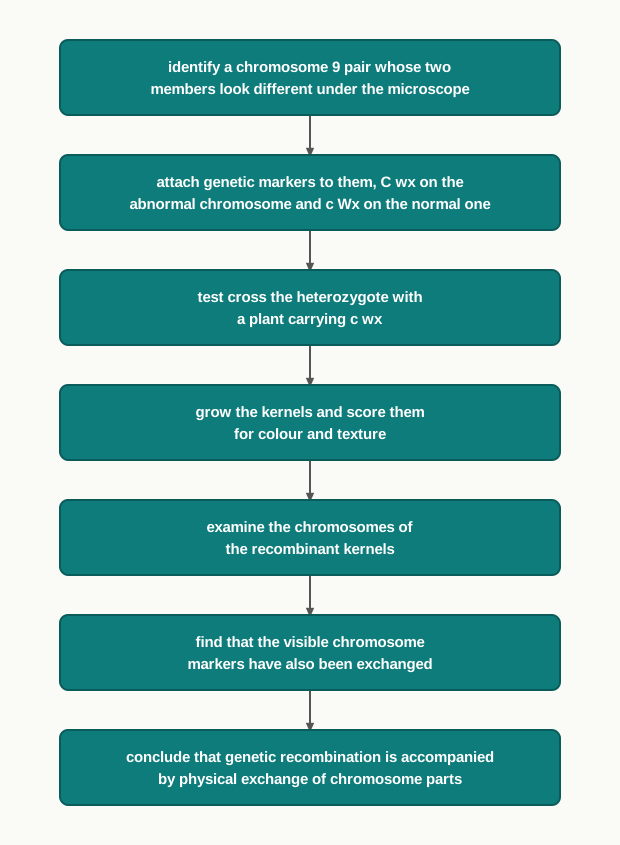
Fig. 6.16 – Logic of the Creighton and McClintock experiment.
When recombinant offspring were examined for the exchanged part of the chromosome, it was found that the recombinants — that is, either coloured with starchy kernel or colourless with waxy kernel — had different morphological forms of chromosome 9.
Here only one of the aberrant markers was found cytologically among the recombinants, contrary to the presence of both the markers on the same chromosome, establishing the fact that during recombination, exchange of part of homologous chromosomes does take place.
Read that conclusion once more. In the parent, the knob and the foreign piece were on the same chromosome, at opposite ends. If crossing over is a genuine physical exchange, then a chromosome that has crossed over somewhere in the middle should end up with only one of the two visible markers. That is exactly what the recombinant kernels showed — and it is why this experiment is regarded as the moment genetic recombination and physical chromosome exchange were finally shown to be the same event.
How This Section Is Tested
Two question types dominate here. The first is numerical: you are given the numbers of each progeny class and asked for the recombination frequency and the map distance, so practise identifying parental and recombinant classes before you start calculating. The second is reasoning: you are asked why the Creighton and McClintock experiment was considered decisive when chiasmata had already been seen under the microscope. The expected answer is that chiasmata show contact, whereas this experiment showed that genetic recombination and the exchange of visibly marked chromosome parts happen together in the same individuals.
6.4 Sex-linked Inheritance
One of the earliest known instances of a sex-linked character is the bleeders’ disease haemophilia, observed only in males in the royal family of Britain — the family whose story opened this chapter. For a long time the pattern was recorded without being understood. However, the concept of sex-linked inheritance was introduced by Thomas H. Morgan in 1910, while working on Drosophila melanogaster.
Before we follow his experiment, one point of background is needed. In Drosophila, as in human beings, the female carries two X chromosomes while the male carries one X and one Y. The X and Y are not true homologues over most of their length, so a gene present on the X may have no partner allele at all on the Y. A male therefore carries only a single copy of such a gene, and whatever that single allele says is expressed — there is no second allele to mask it.
Morgan’s White-Eyed Fly
Morgan and his coworkers noted the sudden appearance of one white-eyed male in a culture of wild red eyed Drosophila. A single unexpected fly in a bottle of thousands is the kind of accident most people would have discarded; Morgan kept it and bred from it.
This white-eyed male was crossed with a red eyed female. The flies of the F₁ generation, both male and female, were all red eyed, indicating that the white-eyed mutation (w) is recessive to red eye colour (W).
When the F₁ flies were allowed to mate freely, the red and white eyed flies appeared in the ratio of 3:1 in the F₂ generation. So far this looks like an ordinary monohybrid result. But the F₂ held a surprise that no ordinary Mendelian cross can explain.
All the white eyed flies were male. The red-eyed males were equally numerous. The females, on the other hand, were all red eyed. The white eyed female did not appear at all.
Think about what that means. In a plain autosomal cross, the recessive phenotype should turn up in both sexes in roughly equal numbers. Here the character was distributed according to sex. The only way a character can be tied to sex in this fashion is if the gene controlling it is carried on a sex chromosome.
Morgan concluded that the gene for eye colour is located on the X chromosome (Fig. 6.17).
Fig. 6.17 – Sex linkage in Drosophila.
Follow the alleles through Fig. 6.17 and the whole pattern falls out. A female needs the w allele on both of her X chromosomes to be white eyed, which cannot happen in this cross because one X always comes from a red eyed father carrying X^W. A male needs the w allele on his single X, and one quarter of the male-producing combinations supply exactly that. The recessive character therefore surfaces in males while remaining hidden in females.
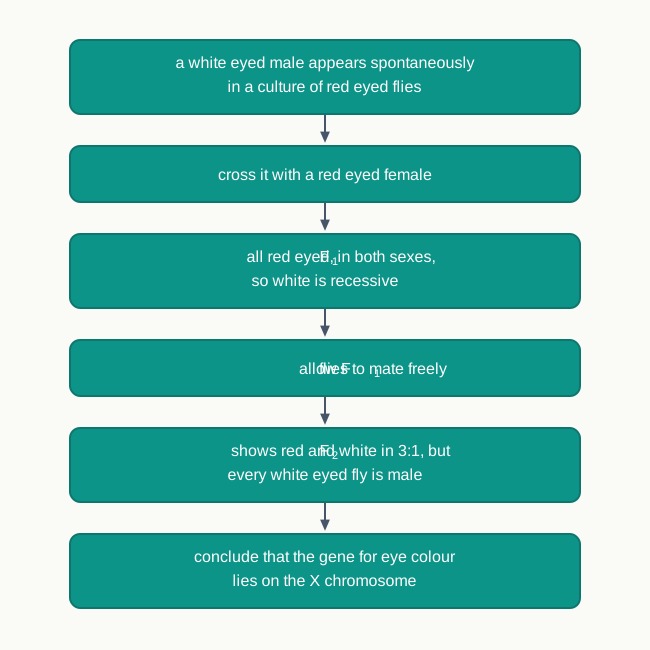
Fig. 6.18 – Morgan’s sex linkage experiment.
Sex-linked Genes and Sex-linked Inheritance
Genes governing body characters that are located on the sex chromosomes rather than on the autosomes are called sex-linked genes, and the inheritance of these sex-linked genes is called sex-linked inheritance.
Colour blindness and haemophilia are common examples of sex-linked inheritance in humans. Both are caused by recessive alleles on the X chromosome, and both show the same signature: affected males are far more common than affected females, and the allele passes from an affected or carrier mother to her sons.
A woman carrying one normal and one defective allele is called a carrier. She is unaffected herself, because her second X chromosome supplies a working copy, but half her sons may inherit the defective allele and, having no second X, will express the condition.
How This Section Is Tested
Sex linkage is a favourite of case-based and pedigree questions. You may be given a family tree and asked to decide whether a condition is autosomal or X-linked; the giveaway is a condition appearing mainly in males and passing through unaffected mothers. Another common form gives you a couple’s genotypes and asks for the probability of an affected child, in which case always write the male genotype with the Y included, as X^w Y, so that you do not accidentally give him two alleles.
6.5 Extrachromosomal Inheritance
As discussed earlier, in addition to the nucleus, DNA is also present in the mitochondria and the plastids. These two organelles carry small, circular genomes of their own, quite separate from the chromosomes of the nucleus.
Gametes carry a copy of the nuclear DNA from the respective parents, and these combine to form a new individual after fertilisation. That much is the ordinary Mendelian picture, and it is symmetrical — the father contributes as much nuclear DNA as the mother.
An interesting feature of the fertilisation process breaks that symmetry. The sperm cell loses most of its cytoplasm and cytoplasmic organelles before fertilisation, and only the sperm nucleus enters the egg. The egg, by contrast, is a large cell packed with cytoplasm and with thousands of organelles.
Therefore, the zygote receives the genome of the plastids and mitochondria only from the maternal parent. This phenomenon is also called extrachromosomal or cytoplasmic inheritance.
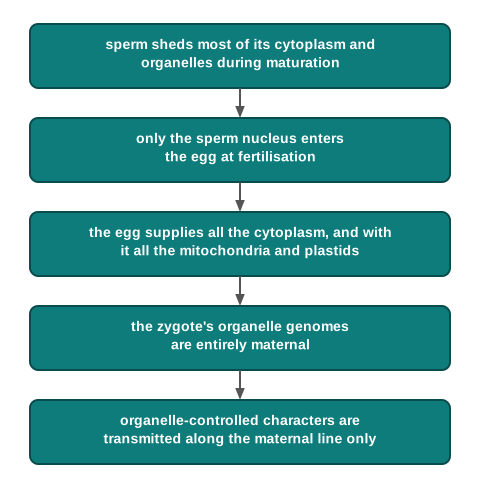
Fig. 6.19 – Why organelle genes come from the mother.
Why These Traits Break Mendel’s Rules
Several traits are controlled by the genes present in plastid or mitochondrial genomes. These traits do not follow the Mendelian principles of inheritance, and most of the cytoplasmic traits that have been recorded follow the maternal line. Therefore, this phenomenon is also known as maternal or uniparental inheritance.
It is worth being clear about why Mendel’s rules fail here rather than simply memorising that they do. Mendel’s laws rest on two facts: that alleles occur in pairs, and that the pair separates at meiosis so that each parent contributes one member. Organelle genes satisfy neither condition. A cell carries many mitochondria and many plastids, not two; and the male parent contributes none of them to the zygote. With no pairing and no paternal contribution, there can be no segregation, no dominance and no 3:1 ratio.
For example, some of the enzymes required for cellular respiration are coded by DNA present in the mitochondria, and DNA that codes for chlorophyll or other pigments is present in the plastids. Both of these are functions the cell cannot do without, which is why defects in organelle genes show up as disorders of energy supply in animals and as defects of pigmentation in plants.
In human medicine this has a direct consequence. Certain disorders caused by faults in mitochondrial DNA — conditions that damage tissues with high energy demands, such as the optic nerve, the brain and skeletal muscle — are passed on by an affected mother to all of her children, sons and daughters alike, while an affected father transmits them to none. A pedigree that shows this pattern is a strong clue that the fault lies in the mitochondrial genome and not on any chromosome. The same principle is used in a very different field: because mitochondrial DNA is inherited unchanged along the female line, it is widely used to trace maternal ancestry and to identify human remains when nuclear DNA is too degraded to analyse.
Evidence from the Four O’clock Plant
In the Four O’clock plant (Mirabilis jalapa) — the same species that gave us the example of incomplete dominance — the leaves can be white, green or variegated, that is, a mixture of white and green, because of genes in the DNA of the plastids (Fig. 6.20).
A variegated plant is one whose shoot carries both normal green plastids and defective colourless plastids. Whichever type of plastid happens to be included in a particular cell decides whether that patch of leaf is green or white.
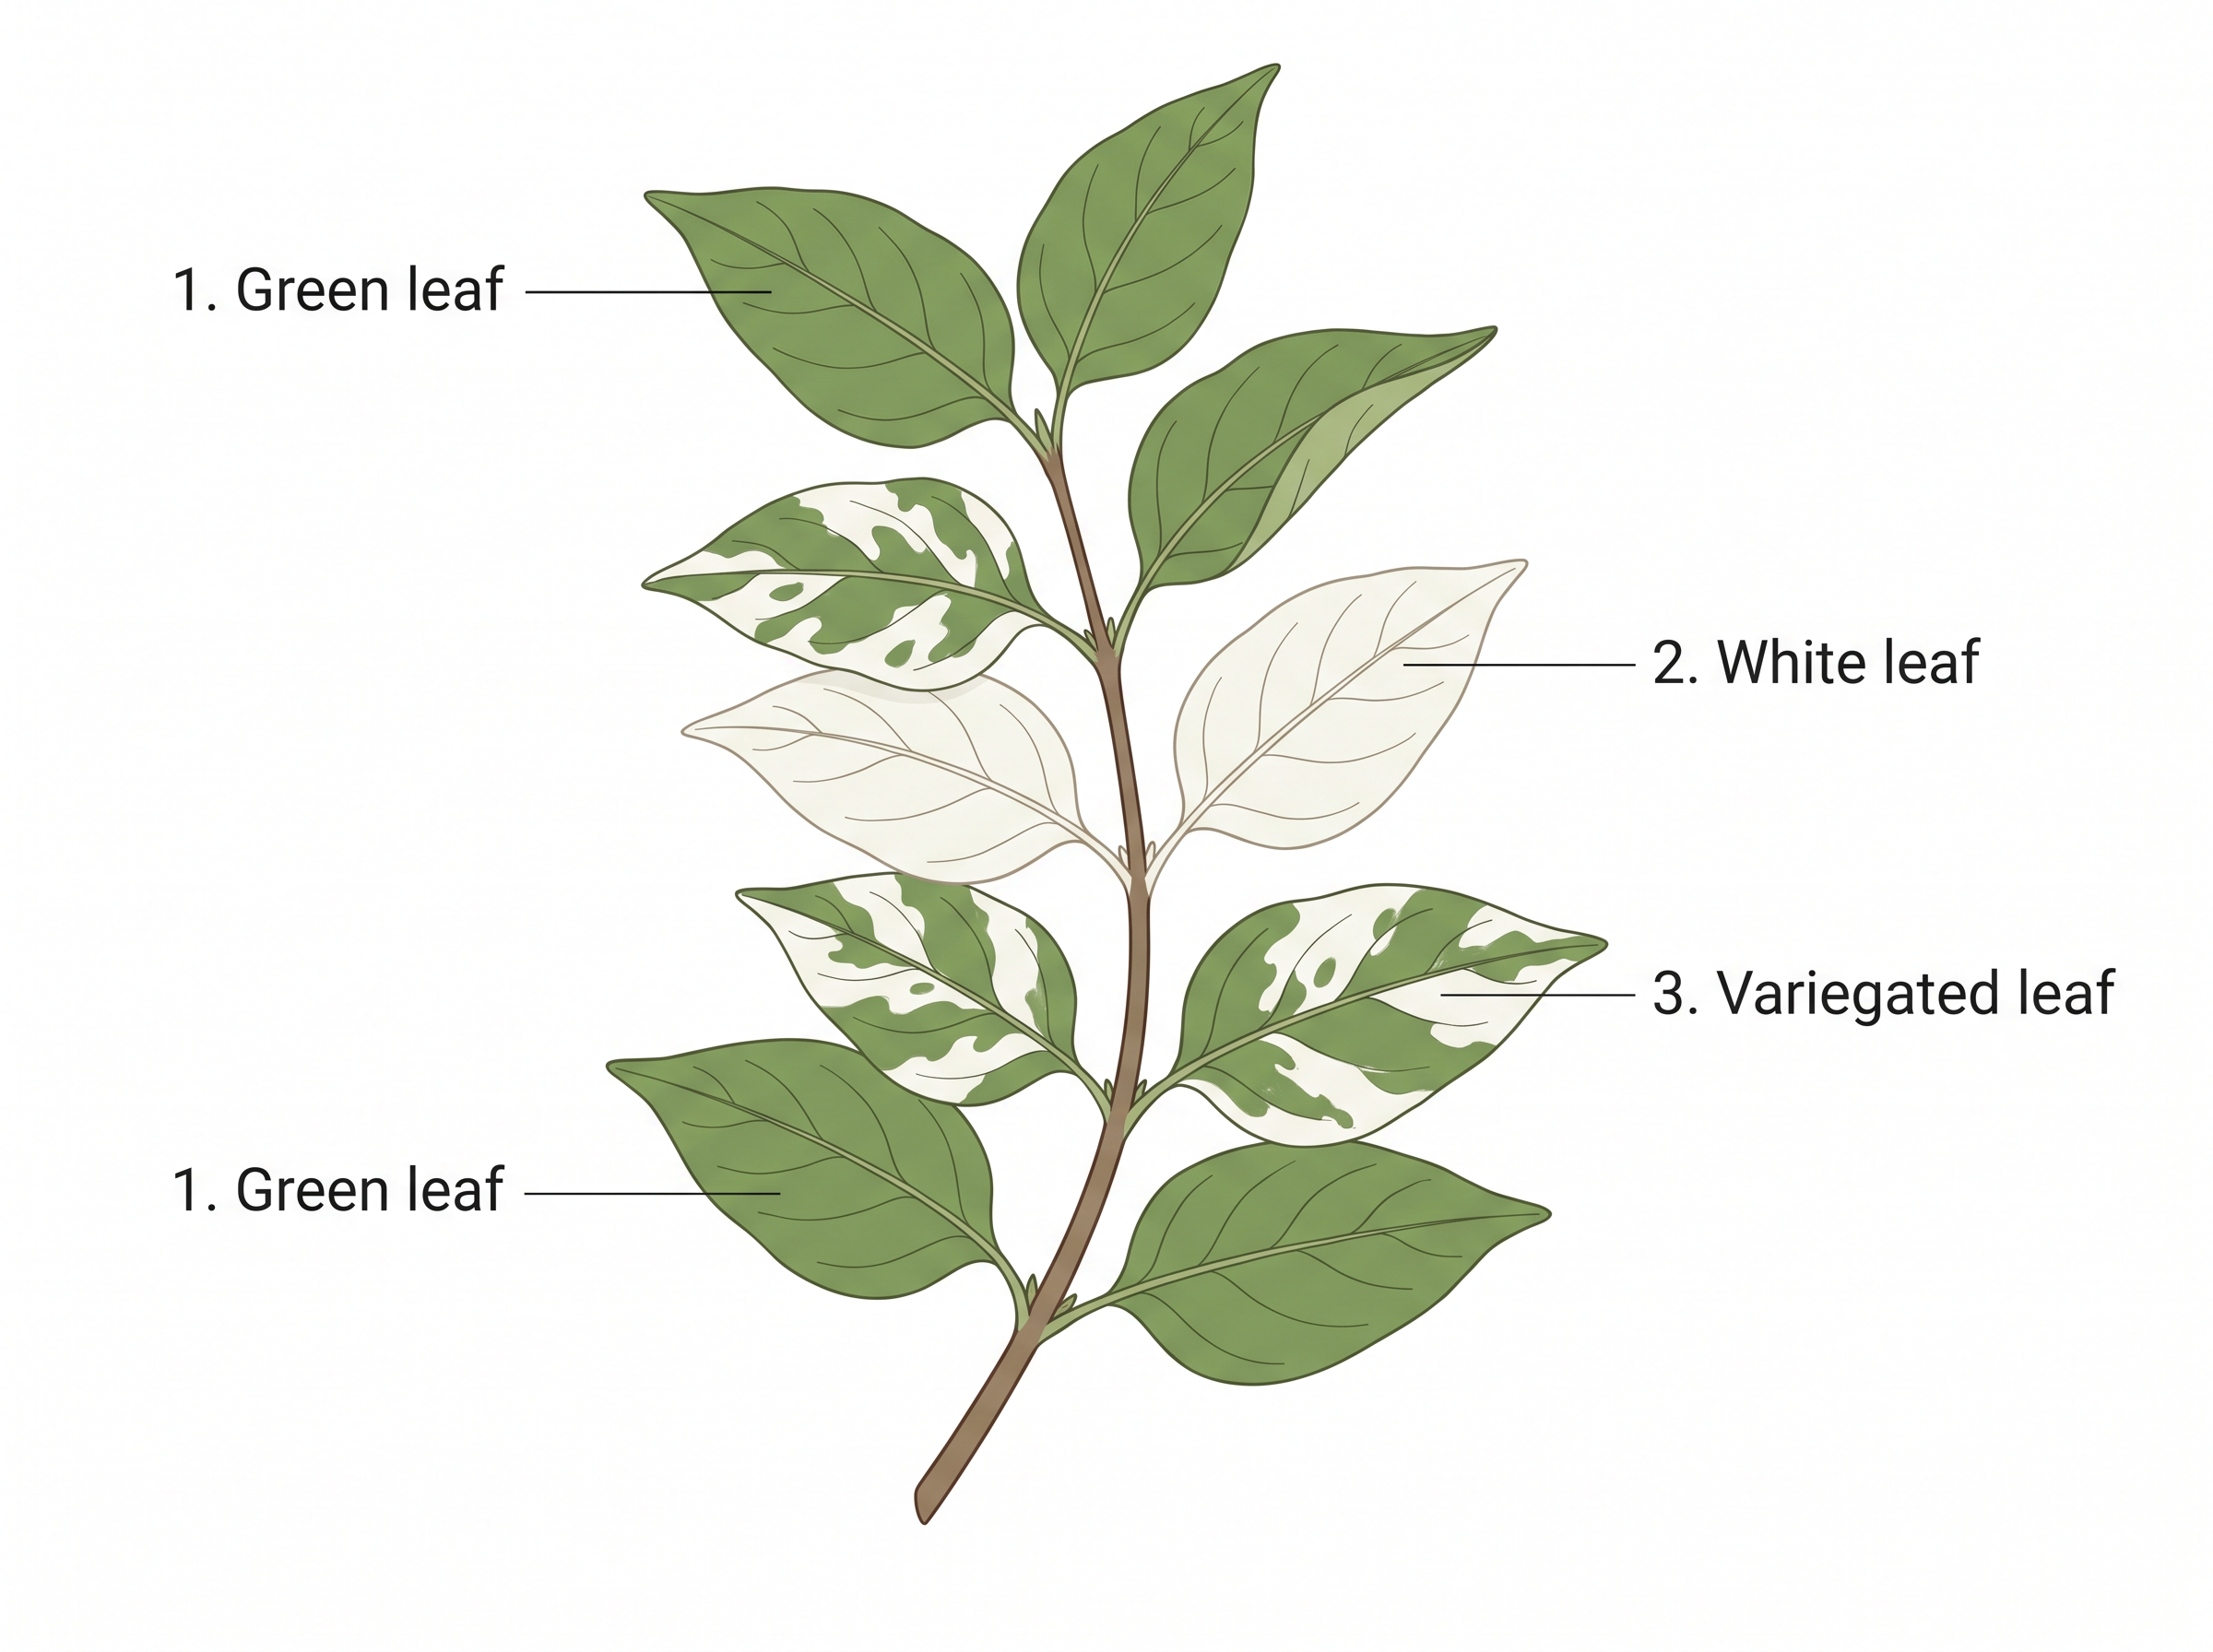
Fig. 6.20 – Variegated leaves in the four-o’clock plant.
The evidence of maternal or extrachromosomal inheritance came conclusively from the crosses conducted in the Four O’clock plant. The cross of a female green, white or variegated plant with either of those male phenotypes yields offspring with the female phenotype only.
This is the decisive observation, so read it slowly. The pollen parent may be green, white or variegated — it makes no difference. The seedlings resemble the plant that bore the seed. Nuclear genes cannot behave in this way, because the pollen parent contributes nuclear genes equally.
How This Section Is Tested
Expect a reciprocal-cross question: you are given the results of a cross and its reverse and asked to explain why they differ. The expected reasoning is that the difference rules out nuclear genes and points to organelle DNA supplied by the egg. Assertion–reason items often pair a statement about maternal inheritance with a reason about the sperm losing its cytoplasm, so be sure you can state that link in one clean sentence.
6.6 Polyploidy
As discussed earlier, the number of complete sets of chromosomes in an organism represents the ploidy number. One complete set is written as \(n\), so an organism with two sets is \(2n\), one with three sets is \(3n\), and so on.
The organisms having one or two complete sets of chromosomes are known as haploids or diploids respectively. Other organisms having more than two sets of chromosomes in each cell are known as polyploids.
Depending upon the number of chromosome sets, polyploids are known as triploid (3 sets), tetraploid (4 sets), hexaploid (6 sets), octoploid (8 sets) and so on (Fig. 6.21).
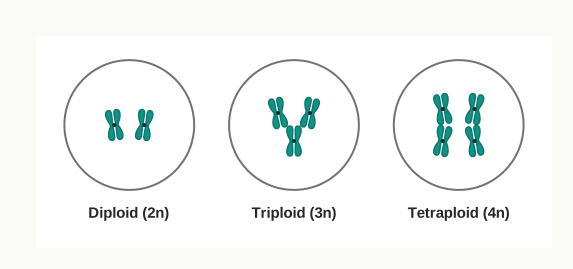
Fig. 6.21 – Chromosomes in polyploid genomes.
How Common Is Each Level?
Most of the species that we see around us are diploid. Natural occurrence of monoploidy or haploidy is rare in nature. In some species of bees and ants, however, males are haploid and females are diploid — the male develops from an unfertilised egg and therefore carries only the maternal set.
Though polyploidy is rare in the animal kingdom, it is very common in the plant kingdom (Table 6.1). In fact, more than 30% of plants are polyploid.
Why should plants tolerate extra chromosome sets so much better than animals? Two reasons help. Plants can reproduce vegetatively, so a polyploid individual that arises by accident can multiply itself without needing a partner of the same ploidy. Animals, in addition, mostly depend on a delicately balanced ratio of sex chromosomes to autosomes for sex determination, and adding whole extra sets disturbs that balance.
Polyploidy also brings visible changes. The size of various parts such as leaves, and the cell size in polyploid plants, is typically larger as compared to diploid plants. Further, polyploid plants seem to be more tolerant to harsh environmental conditions.
This combination — bigger organs and greater hardiness — is exactly what a plant breeder wants, and it explains why so many of our staple and garden crops are polyploid. Bread wheat is hexaploid, and its large grain owes much to that fact. Cultivated strawberry is octoploid, with fruit far larger than that of its wild diploid relatives. Triploid varieties are exploited in a different way: a plant with three sets cannot divide them evenly at meiosis, so it forms very few viable gametes and sets no proper seed. This is the basis of seedless bananas and seedless watermelons, which are propagated vegetatively or from specially produced seed rather than from their own.
Table 6.1 List of plants representing various ploidy levels
| Name of Plant | Total No. of Chromosomes | No. chromosomes in one Set (X) | Ploidy Level |
|---|---|---|---|
| Rice | 24 | 12 | Diploid |
| Sorghum | 20 | 10 | Diploid |
| Banana | 22 or 33 | 11 | Diploid or Triploid |
| Apple | 34 or 51 | 17 | Diploid or Triploid |
| Peanuts | 40 | 10 | Tetraploid |
| Cotton | 52 | 13 | Tetraploid |
| Potato | 48 | 12 | Tetraploid |
| Wheat | 42 | 7 | Hexaploid |
| Strawberry | 56 | 7 | Octoploid |
| Sugarcane | 80 | 10 | Octoploid |
Read Table 6.1 as an arithmetic exercise rather than a list to be memorised. Divide the total number of chromosomes by the number in one set, and the answer is the ploidy level itself. Wheat has 42 chromosomes and 7 in one set, so \(42 \div 7 = 6\) sets, which is hexaploid. Banana appears twice because both a 22-chromosome diploid form and a 33-chromosome triploid form exist — and it is the triploid form, unable to complete meiosis evenly, that gives us the seedless fruit we eat.
Aneuploidy
Change in the number of chromosomes does not occur as a complete set always. In some organisms, some chromosomes may be over- or under-represented — that is, they have an incomplete set of chromosomes.
These organisms, in which either one or more chromosomes of a chromosome set are either missing or have more copies, are known as aneuploids.
Aneuploidy usually results from irregular meiotic division that leads to unequal distribution of chromosomes to opposite poles. If a pair of homologous chromosomes fails to separate and both move to the same pole, one gamete receives an extra chromosome while the other receives none. Fertilisation of such a gamete by a normal one produces a zygote with one chromosome too many or one too few.
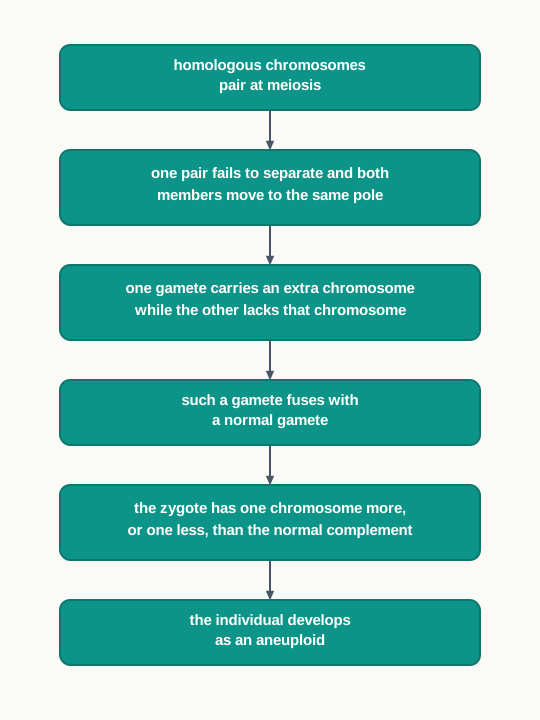
Fig. 6.22 – Origin of aneuploidy.
Because whole sets are added in polyploidy, the balance between the chromosomes is maintained and the organism is often healthy and even improved. In aneuploidy, that balance is destroyed, since one chromosome is present in a different dose from the rest. This is why aneuploidy is usually harmful. In human beings, the presence of an extra copy of chromosome 21 produces Down syndrome, a condition you will meet again when you study genetic disorders.
How This Section Is Tested
Questions here are usually of two kinds. The first asks you to classify: you are given a chromosome number and a basic set number and asked for the ploidy level, so practise the division until it is automatic. The second asks you to distinguish polyploidy from aneuploidy and explain why one is often beneficial while the other is usually harmful — the answer must turn on whether the balance between the chromosomes is preserved, not simply on the numbers involved.
6.7 Reverse Genetics
In the above sections, we have learnt how we study genetic principles based upon phenotypic variations. In every case — Mendel’s tall and dwarf peas, Morgan’s white eyed fly, the variegated four o’clock plant — we began with something visible and worked inwards towards the gene responsible for it.
These variations can be measured in two ways. They may be macro variations, that is, visible morphological variations such as the size, shape and number of body organs. Or they may be micro-variations, that is, variation in DNA sequences, protein profiles, or metabolites, which cannot be seen with the eye but can be measured in the laboratory.
This process of analysing phenotypic variations in the population and determining the genetic constituents — the DNA sequences or genes — regulating these variations is called forward genetics (Fig. 6.23).
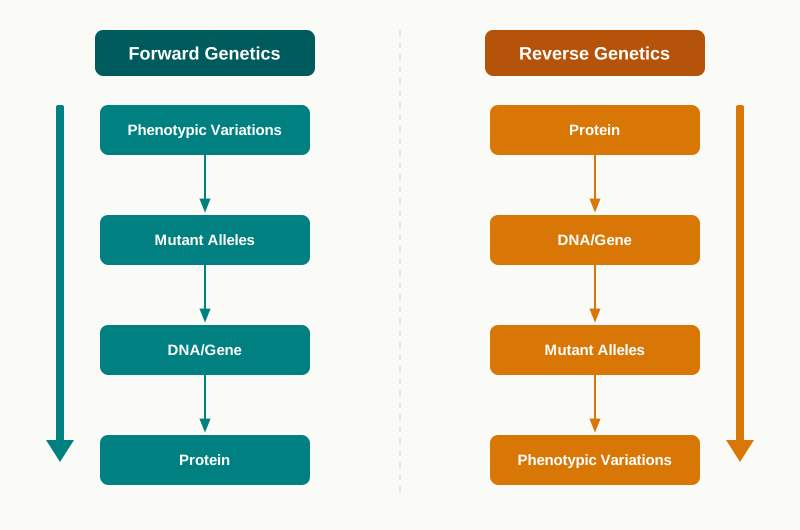
Fig. 6.23 – Forward and reverse genetics approaches.
Fig. 6.23 is worth studying carefully, because the whole section is contained in it. The two chains use exactly the same four items — phenotype, mutant allele, gene and protein — but they are traversed in opposite directions. Forward genetics enters from the phenotype end; reverse genetics enters from the molecular end.
Why a Second Approach Became Necessary
In the last few decades, DNA sequencing technologies have evolved exponentially and have made it possible to read the complete genome of organisms, thereby identifying all the genes in them.
This created a new and rather unexpected problem. Whole genome sequencing has led to the identification of a large number of genes, whereas the functions of only a few genes are known. Biologists suddenly had far more genes than they had phenotypes to attach them to.
Further, each gene in an organism does not result in visible variations. A gene may act only in one tissue, only at one stage of development, or only under stress; another gene may be backed up by a second gene that covers for it. Classical forward genetics can never find such genes, because there is no visible variation to start from.
Therefore, the reverse genetics approach can be used to characterise genes having unknown functions.
In a reverse genetic approach, the investigation starts with the analysis of a DNA or protein sequence rather than with phenotypic variations. In the forward genetic approach it is possible to identify regulatory genes that produce visible phenotypes, whereas reverse genetics can be used to investigate the function of any gene or protein in an organism.
How the Reverse Approach Is Carried Out
The reverse genetics approach starts with a DNA sequence (gene) or a protein sequence with an unknown function (Fig. 6.23). First, a candidate gene is selected whose function is not known and whose function we want to determine.
Various experimental procedures are then used to disrupt the candidate gene, and its effect on the development of the organism is analysed. The logic is that of subtraction: if switching a gene off produces a particular defect, that gene must normally be responsible for the process that has now failed.
If the candidate whose function is to be determined is a protein, it is first traced backwards to ascertain its DNA sequence. This is possible because the amino acid sequence of a protein is a translation of the base sequence of its gene, so the protein can be used to search a sequenced genome for the gene that encodes it.
The candidate gene is cloned and is reinserted back into the genome of the same organism. Its expression is silenced to determine the phenotypic outcome.
In summary, the goal of the reverse genetic approach is to induce variations in a particular gene and to investigate their impact on an organism. The complete sequence is set out in Fig. 6.24.
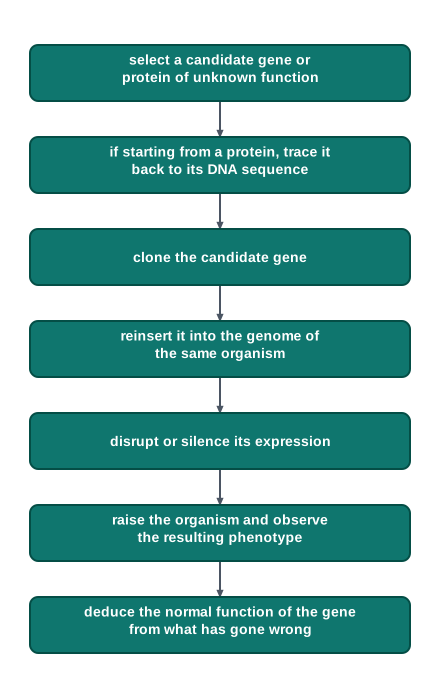
Fig. 6.24 – Reverse genetics workflow.
Techniques Used to Disrupt the Target
Several technical procedures are used for causing variation — that is, disruption or alteration — in the target. These techniques can be very specific, like gene silencing through RNA interference (RNAi), or targeted gene disruption by homologous recombination.
RNAi is a regulatory biological process which uses small double stranded RNA molecules to inhibit gene expression or translation.
Notice an important difference between the two methods. RNA interference does not touch the gene itself; it silences the message the gene sends out, so the gene is still present but its product is not made. Targeted gene disruption by homologous recombination works at the level of the DNA: a designed piece of DNA carrying sequences matching the target is introduced, the cell’s own recombination machinery exchanges it into place, and the gene is physically broken.
How This Section Is Tested
The commonest question is a straight comparison of the two approaches, so be able to state the starting point and the direction of each in one sentence. Sequence-ordering questions are also frequent: you are given the steps of a reverse genetics experiment in jumbled order and asked to arrange them, which is why Fig. 6.24 is worth learning as a sequence rather than as a paragraph. Assertion–reason items often pair a statement about RNAi with a reason about DNA disruption, and the distinction to hold on to is that RNAi silences the message while homologous recombination alters the gene itself.
6.8 Summary
Characteristics that run in families have a genetic basis. They depend on the genetic information a person inherits from his or her parents, and the same is true for all plants and animals.
The transmission of characters from one generation to the next — the phenomenon of offspring inheriting the parental traits — is known as heredity.
The differences that exist between offspring and their parents are known as variation.
The study of the scientific facts of heredity and variation is referred to as genetics.
Our modern understanding of the inheritance of traits through generations comes from the studies made by Gregor Mendel, an Austrian monk, who worked with pure lines of pea plants and counted large numbers of offspring over several generations.
When a cross is made between parents with one pair of contrasting characters, it is called a monohybrid cross.
Each gene exists in two alternate forms called alleles. When two similar alleles for a trait are present in an individual, they are referred to as homozygous alleles; when two different alleles for a trait are present, they are referred to as heterozygous alleles.
The phenotypic ratio of a monohybrid cross is 3:1 and the genotypic ratio is 1:2:1. The two ratios differ because two different genotypes share the same dominant appearance.
A test cross helps determine whether an individual showing a dominant phenotype is homozygous or heterozygous for a specific allele, because it is crossed with a homozygous recessive individual that can contribute only recessive alleles.
Mendel’s law of dominance states that out of the two contrasting characters, one is dominant and the other is recessive.
According to the law of segregation, the alleles of traits segregate from each other in the process of inheritance, so that each gamete carries only one allele of a pair.
In incomplete dominance, the two alleles of a trait are not related as dominant and recessive. The dominant gene in the heterozygous condition shows reduced expression, so that each allele expresses itself partially and the heterozygote is intermediate.
When both the alleles of the parental generation get equally expressed in the F₁ heterozygote, it is known as codominance.
When a cross is made between parents with two pairs of contrasting characters, it is called a dihybrid cross, and its F₂ phenotypic ratio is 9:3:3:1.
According to the principle of independent assortment of alleles, the factors or genes controlling a specific trait are inherited independent of each other.
The phenomenon of the inheritance of genes together, retaining their parental combination even in the offspring, is known as linkage. Genes located on the same chromosome and inherited together are known as linked genes, the characters they control are known as linked characters, and all the genes of one chromosome form a linkage group.
The phenomenon in which non-parental combinations appear due to the interchange of alleles is called crossing over. It takes place between non-sister chromatids of a homologous pair during meiosis.
Recombination is a process during which exchange of part of homologous chromosomes takes place. The percentage of recombinants is used as a measure of the distance between two genes, 1% recombination being taken as 1 map unit or 1 centimorgan.
There are different types of inheritance. Sex-linked inheritance results from a recessive gene present in a sex chromosome, which is why such conditions appear far more often in males. Extrachromosomal or cytoplasmic inheritance is the inheritance of characters controlled by genes present in the cytoplasm. Maternal or uniparental inheritance is the transmission of genetic characters only from maternal extranuclear elements such as mitochondrial DNA.
Organisms having more than two sets of chromosomes in each cell are known as polyploids. Polyploidy is rare in animals but common in plants, where polyploid individuals often have larger organs and greater tolerance of harsh conditions.
Organisms in which either one or more chromosomes of a chromosome set are missing or have more copies are known as aneuploids. Aneuploidy usually arises from irregular meiotic division and, because it disturbs the balance between chromosomes, it is generally harmful.
The process of analysing phenotypic variations in a population and determining the genetic constituents — DNA sequences or genes — regulating these variations is called forward genetics. The reverse genetics approach starts instead with a DNA sequence or a protein sequence of unknown function, and deliberately disrupts or silences it to find out what it controls. RNA interference and targeted gene disruption by homologous recombination are two techniques used for this purpose.
Characters are controlled by small DNA segments called genes.
The collection of all the DNA material in one complete set of chromosomes, including all the genes and other parts of the DNA in a cell, is referred to as the genome. A eukaryotic cell has two types of genome: the nuclear genome and the organellar genome, such as the chloroplast genome and the mitochondrial genome.
One complete set of chromosomes in an individual makes the genome of that individual and is represented by the letter n. Most organisms carry two sets of chromosomes (2n) and are known as diploid organisms.
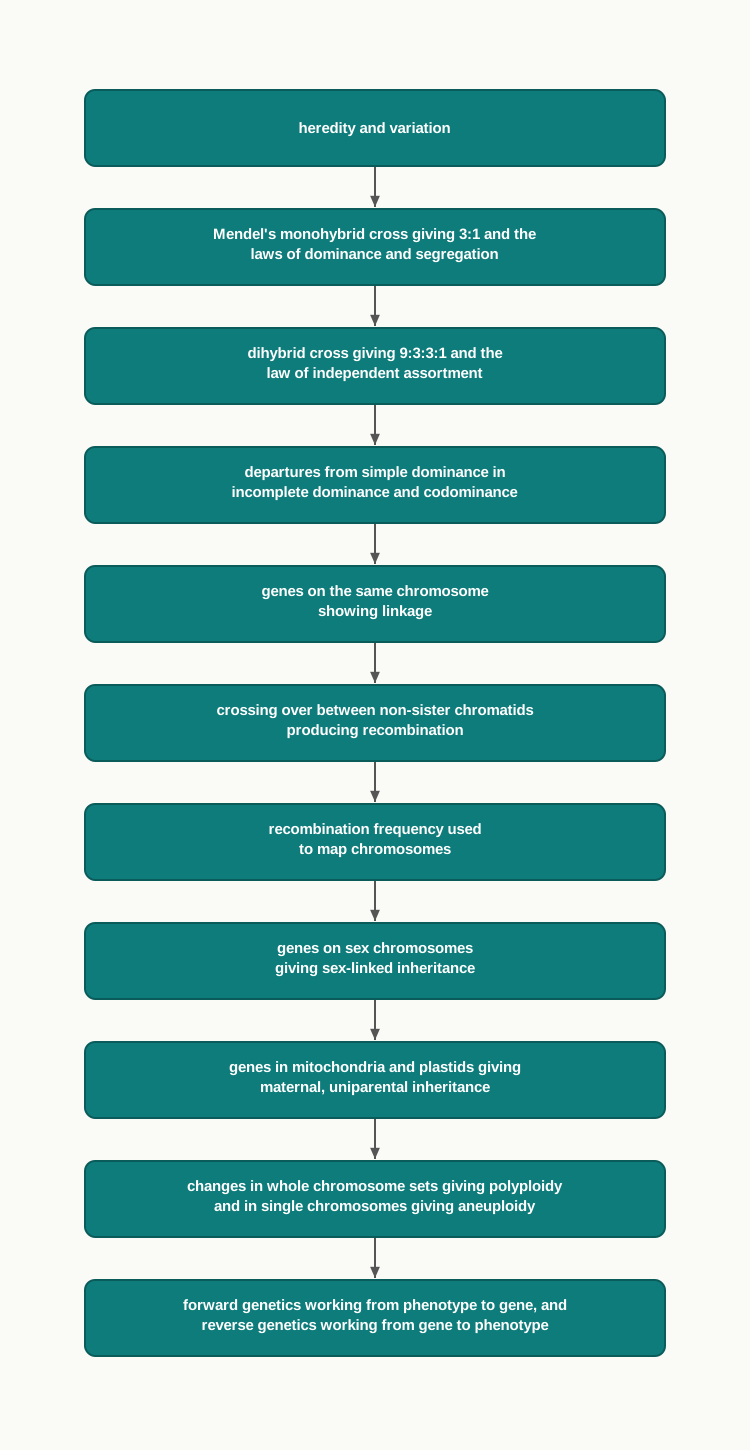
Fig. 6.25 – The chapter at a glance.
6.9 Key Terms
Heredity — The transmission of characters from one generation to the next, so that offspring inherit the traits of their parents.
Variation — The differences that exist between offspring and their parents.
Genetics — The study of the scientific facts of heredity and variation.
Gene — A small segment of DNA on a chromosome that controls a particular character.
Pure line — A stock obtained by repeated self-pollination, in which a character breeds true and no alternative form appears.
F₁ generation — The first filial generation, raised from the seeds produced by a cross between two selected parents.
Monohybrid cross — A cross made between parents differing in one pair of contrasting characters.
Allele — One of the two alternate forms in which a gene exists.
Dominant — Describes the allele that expresses itself in the heterozygote and masks the effect of its partner.
Recessive — Describes the allele whose effect remains unexpressed in the heterozygote and appears only when both alleles are of this type.
Homozygous — Having two similar alleles of a gene in an individual.
Heterozygous — Having two different alleles of a gene in an individual.
Genotype — The genetic make-up of an individual for a given character.
Phenotype — The morphological or observable trait shown by an individual.
Punnett square — A grid, devised by Reginald C. Punnett, in which the gametes of the two parents are combined to calculate the probability of every possible genotype in the offspring.
Test cross — A cross of an individual showing the dominant phenotype with a homozygous recessive individual, performed to find out whether the dominant individual is homozygous or heterozygous.
Law of dominance — The principle that out of two contrasting characters, one is dominant and the other recessive.
Law of segregation — The principle that the two alleles of a trait separate during gamete formation, so that each gamete receives only one of them.
Incomplete dominance — The condition in which the dominant allele shows reduced expression in the heterozygote, so that each allele expresses itself partially and the heterozygote is intermediate.
Codominance — The condition in which both alleles of a heterozygote are fully and equally expressed, so that both parental characters appear together.
Dihybrid cross — A cross made between parents differing in two pairs of contrasting characters.
Law of independent assortment — The principle that the factors of one pair of characters are inherited independently of the factors of another pair.
Locus — The fixed position occupied by a particular gene on a chromosome.
Linkage — The phenomenon in which genes located on the same chromosome are inherited together and retain their parental combination in the offspring.
Linked genes — Genes situated on the same chromosome that tend to be transmitted together.
Linked characters — The characters controlled by linked genes.
Linkage group — All the genes located on a single chromosome, taken together.
Crossing over — The interchange of segments between non-sister chromatids of homologous chromosomes during gametogenesis.
Non-sister chromatids — The chromatids belonging to the two different members of a homologous pair, between which a cross over takes place.
Recombination — The process during which exchange of parts of homologous chromosomes takes place, producing offspring with combinations of characters not present in either parent.
Recombinant — An offspring showing a combination of characters that neither parent possessed.
Recombination frequency — The percentage of recombinant offspring among the total offspring of a cross, used as a measure of the distance between two linked genes.
Map unit (centimorgan, cM) — The unit of distance on a genetic map, one map unit corresponding to 1% recombination between two genes.
Chiasma — The X-shaped point of contact seen between chromatids of a paired homologous set during the first meiotic prophase, marking the site of exchange.
Sex-linked genes — Genes controlling body characters that are situated on the sex chromosomes.
Sex-linked inheritance — The transmission of characters controlled by genes present on the sex chromosomes.
Carrier — An individual, usually a female, who possesses one normal and one recessive defective allele and is unaffected but can transmit the defective allele to her offspring.
Extrachromosomal (cytoplasmic) inheritance — The transmission of characters controlled by genes present in the mitochondria and plastids rather than on the nuclear chromosomes.
Maternal (uniparental) inheritance — The transmission of genetic characters only from the maternal extranuclear elements, so that the offspring resembles the female parent.
Reciprocal cross — A pair of crosses in which the roles of the male and female parent are interchanged, used to detect cytoplasmic inheritance.
Ploidy number — The number of complete sets of chromosomes present in an organism.
Haploid — An organism or cell having a single complete set of chromosomes.
Diploid — An organism or cell having two complete sets of chromosomes.
Polyploid — An organism having more than two complete sets of chromosomes in each cell, described as triploid, tetraploid, hexaploid or octoploid according to the number of sets.
Aneuploid — An organism in which one or more individual chromosomes of a set are missing or present in extra copies, so that the chromosome number is not an exact multiple of the basic set.
Forward genetics — The approach in which study begins with an observed phenotypic variation and proceeds towards identifying the gene responsible for it.
Reverse genetics — The approach in which study begins with a DNA or protein sequence of unknown function and proceeds by disrupting it to find out what phenotype it controls.
Candidate gene — A gene of unknown function that is selected for deliberate disruption in a reverse genetics experiment.
RNA interference (RNAi) — A regulatory biological process in which small double stranded RNA molecules inhibit gene expression or translation.
Targeted gene disruption by homologous recombination — A method in which an introduced piece of DNA is exchanged into a chosen position in the genome so that the gene at that position is interrupted and can no longer function.
Genome — The collection of all the DNA material in one complete set of chromosomes of a cell, a eukaryotic cell having both a nuclear genome and an organellar genome.
6.10 Points to Ponder
Mendel worked without a microscope powerful enough to show him chromosomes, and without any idea that DNA existed. Think about how far careful counting alone can carry a scientist, and what it was about his design — pure lines, one character at a time, very large numbers — that made invisible things visible.
Mendel studied seven pairs of contrasting characters in an organism that has only seven pairs of chromosomes, and all seven behaved as though they assorted independently. Reflect on what his ratios would have looked like if two of those characters had lain close together on the same chromosome, and on the part that good fortune plays in scientific discovery.
Dominance is often described loosely as one character being “stronger” than another. Consider whether that description survives what you have learnt about incomplete dominance and codominance, and what a more accurate way of stating dominance would be.
A pink four o’clock flower looks like a blend of red and white, yet red and white plants reappear unchanged in the next generation. Think about what this tells you regarding the difference between the blending of an appearance and the blending of the hereditary material itself.
Bateson and Punnett obtained the data that revealed linkage but could not explain it, while Morgan, working later on a different organism, could. Reflect on what an explanation needs beyond good data, and why the same results can wait years for the right idea to arrive.
Recombination frequency is treated as a measure of physical distance along a chromosome. Consider what assumption this rests on, and what would happen to the accuracy of a genetic map if crossing over were more likely in some regions of a chromosome than in others.
A condition such as haemophilia appears mainly in males but is transmitted through unaffected females. Think about how a family that had observed this pattern for generations might have explained it before chromosomes were known, and what it takes to move from a pattern to a mechanism.
Reciprocal crosses give identical results for nuclear genes but different results for organelle genes. Reflect on why a simple change in experimental design — merely swapping which parent supplies the pollen — can be as informative as an elaborate laboratory technique.
Polyploidy is usually harmful in animals but has given us bread wheat, cultivated strawberry and seedless banana. Consider why the addition of whole chromosome sets should be tolerated so differently in the two kingdoms, and what this suggests about the relationship between chromosome number and the working of an organism.
Triploid plants are prized commercially precisely because they are nearly sterile. Think about what it means for agriculture when the crops we depend on cannot reproduce by themselves, and who then controls their propagation.
Whole genome sequencing has given us far more genes than we have functions to attach to them. Reflect on how this reversal — data arriving ahead of understanding — has changed the way biological questions are now framed.
Reverse genetics deliberately damages a gene in order to learn what it normally does. Consider the strengths and the limits of learning about a system by breaking one part of it, and whether the absence of any visible change after silencing a gene should be read as an answer or as a new question.
6.11 NCERT Questions
Differentiate between the following:
- Genotype and Phenotype
- Dominant and Recessive characters
- Hybrid and Pure individuals
- Heterozygous and Homozygous progeny
- Monohybrid and Dihybrid cross
- Gene and allele
- Incomplete dominance and codominance
Mention the genotypic and phenotypic ratio of progeny when there is a cross between:
- F₁ progeny with pure dominant parent
- F₁ progeny with pure recessive parent
- F₁ progeny with F₁ progeny
Explain test cross through diagrammatic representation.
Explain the following using monohybrid and dihybrid cross:
- Law of dominance
- Law of segregation
- Law of independent assortment
What will be the genotypic and phenotypic ratio when a red and tall homozygous tomato plant is crossed to a red and tall heterozygous plant?
When one male and one female Drosophila, heterozygous for the two pairs of alleles AaBb, were mated, the offspring’s phenotypic ratio 2:1:1:2 was obtained.
- Explain how these ratios help in detecting linkages?
- How degree of linkage can be determined?
Make a close observation with the nature. Do you think that the phenomenon of linkage is absolute?
6.12 Objective Questions
The study of the scientific facts of heredity and variation is called
- taxonomy
- genetics
- cytology
- embryology
Mendel selected the garden pea for his breeding experiments mainly because it
- is a perennial plant with unisexual flowers
- is an annual plant with perfect bisexual flowers and many contrasting pairs of characters
- has the smallest genome among flowering plants
- cannot be self-pollinated under any condition
The number of pairs of contrasting characters selected by Mendel for his breeding experiments in pea was
- three
- five
- seven
- nine
The genotypic ratio obtained in the F₂ generation of a monohybrid cross is
- 3:1
- 1:2:1
- 9:3:3:1
- 1:1
A test cross is performed by crossing an individual showing the dominant phenotype with
- a homozygous dominant individual
- another individual of the same unknown genotype
- a homozygous recessive individual
- a heterozygous individual
If a test cross gives offspring in the ratio of 1 dominant : 1 recessive, the genotype of the parent being tested was
- homozygous dominant
- heterozygous
- homozygous recessive
- impossible to determine
Pink flowers in Mirabilis jalapa are produced because of
- codominance
- incomplete dominance
- linkage
- cytoplasmic inheritance
A roan coat in cattle, in which white hairs and pigmented hairs occur together and the colour does not fade with age, is an example of
- incomplete dominance
- codominance
- crossing over
- aneuploidy
The antigens present on the red blood cells of a person of genotype L^M L^N are
- M only
- N only
- both M and N
- neither M nor N
All the genes located on a single chromosome together constitute
- a genome
- a linkage group
- an allele pair
- a linkage map
Bateson and Punnett obtained their evidence in favour of linkage from experiments on
- garden pea
- maize
- sweet pea
- Drosophila melanogaster
In Morgan’s test cross involving grey vestigial and black long Drosophila, the percentage of non-parental combinations obtained was
- 8.5
- 17
- 41.5
- 83
Crossing over takes place between
- sister chromatids of the same chromosome
- non-sister chromatids of homologous chromosomes
- two non-homologous chromosomes
- the X and the Y chromosome only
A recombination frequency of 1% between two genes is taken to correspond to a distance of
- 1 nanometre
- 1 map unit or 1 centimorgan
- 1 base pair
- 1 chiasma
The two markers used by Creighton and McClintock on chromosome 9 of maize were the genes for
- plant height and flower colour
- kernel colour and kernel texture
- seed shape and seed colour
- eye colour and wing shape
In Morgan’s experiment on Drosophila, all the white eyed flies obtained in the F₂ generation were
- females
- males
- equally divided between the sexes
- sterile
A zygote receives the genomes of plastids and mitochondria only from the maternal parent because
- organelle DNA cannot survive in the male gamete
- the sperm loses most of its cytoplasm and organelles, and only its nucleus enters the egg
- organelle genes are dominant in the female
- the egg destroys the paternal organelles after fertilisation
Wheat, with 42 chromosomes and 7 chromosomes in one set, is
- tetraploid
- hexaploid
- octoploid
- aneuploid
Organisms in which one or more individual chromosomes of a set are missing or present in extra copies are called
- polyploids
- haploids
- aneuploids
- diploids
An approach that begins with a DNA or protein sequence of unknown function and then disrupts it to observe the resulting phenotype is called
- forward genetics
- reverse genetics
- classical genetics
- cytogenetics
RNA interference brings about gene silencing by using
- single stranded DNA molecules
- small double stranded RNA molecules
- restriction enzymes
- transfer RNA molecules
Assertion: The dwarf character disappears in the F₁ generation of a cross between a pure tall and a pure dwarf pea plant. Reason: The dwarf allele is destroyed during the formation of the F₁ hybrid.
Assertion: The phenotypic ratio and the genotypic ratio are identical in the F₂ generation of a cross showing incomplete dominance. Reason: In incomplete dominance each genotype produces its own distinct phenotype, so no genotype is hidden behind another.
Assertion: A homozygous recessive individual is used as the tester in a test cross. Reason: A homozygous recessive individual contributes only recessive alleles, so the phenotype of the offspring reveals the alleles supplied by the other parent.
Assertion: Linked genes do not show independent assortment. Reason: Genes situated on the same chromosome tend to move together during meiosis and retain their parental combination.
Assertion: Recombinant offspring are always fewer in number than parental offspring in a cross involving two linked genes. Reason: A cross over must occur between the two loci concerned for a recombinant gamete to be formed, and this does not happen in every meiosis.
Assertion: The Creighton and McClintock experiment on maize is regarded as decisive evidence for crossing over. Reason: It showed that the exchange of genetic markers is accompanied by the exchange of visibly distinguishable parts of the chromosome.
Assertion: Haemophilia and colour blindness appear far more often in males than in females. Reason: A male has only one X chromosome, so a single recessive allele on it is expressed as there is no second allele to mask it.
Assertion: Characters controlled by plastid genes do not follow Mendelian ratios. Reason: Organelle genes do not occur in allelic pairs that segregate at meiosis, and are contributed by only one parent.
Assertion: Reciprocal crosses give different results when a character is controlled by mitochondrial genes. Reason: Mitochondria reach the zygote through the egg alone.
Assertion: Triploid varieties of banana and watermelon are seedless. Reason: Three sets of chromosomes cannot be distributed equally at meiosis, so very few viable gametes are formed.
Assertion: Polyploidy is often beneficial to plants whereas aneuploidy is usually harmful. Reason: Polyploidy adds complete chromosome sets and preserves the balance between chromosomes, while aneuploidy alters the dose of individual chromosomes and disturbs that balance.
Assertion: Reverse genetics can be used to study genes that never produce a visible variant in nature. Reason: In reverse genetics the variation is created deliberately in a chosen gene instead of being waited for.
6.13 Check Your Concepts
Mendel spent several generations self-pollinating his pea plants before he made a single cross. Explain why this step was essential, and describe what his F₂ results would have looked like if he had skipped it.
Why did Mendel grow a large number of plants for every cross instead of a few? Relate your answer to the nature of the ratios he was trying to detect.
A pea plant is tall. Explain why its appearance alone cannot tell you its genotype, and describe the cross you would perform to settle the question.
In a test cross, why must the tester be homozygous recessive rather than homozygous dominant? State what the result would be if a homozygous dominant tester were used by mistake.
The F₂ generation of a monohybrid cross gives a phenotypic ratio of 3:1 but a genotypic ratio of 1:2:1. Explain why the two ratios differ, and state which of them carries more information about the progeny.
A pink-flowered Mirabilis jalapa plant is often described as a blend of its red and white parents. Using the F₂ results of selfing such a plant, argue against the idea that the hereditary material itself has blended.
Both incomplete dominance and codominance give a 1:2:1 ratio in F₂. Explain how you would tell the two conditions apart if you were shown only the heterozygous individuals.
Compare and contrast incomplete dominance and codominance under the headings: expression of the alleles, appearance of the heterozygote, and an example of each.
In a dihybrid cross between RRYY and rryy pea plants, round green and wrinkled yellow seeds appear in the F₂ generation although neither parent had these combinations. Explain how these new combinations arise, and state which law of inheritance they demonstrate.
Draw and label a Punnett square for the cross Tt × Tt. Mark clearly which cells give the dominant phenotype and which gives the recessive phenotype, and write both ratios below the square.
Arrange the following steps of Mendel’s experimental method in the correct order: self-pollinate the F₁ plants; obtain pure lines by repeated self-pollination; count the plants of each type in the progeny; transfer pollen from the chosen male parent with a brush; prevent the female parent from self-pollinating.
Humans have 20,000 to 25,000 protein coding genes distributed over 23 pairs of chromosomes. Explain what this fact implies about whether all genes can assort independently of one another.
Bateson and Punnett obtained an F₂ ratio in sweet pea that departed from the expected 9:3:3:1. State what feature of their data indicated linkage, and explain why they were unable to give the correct explanation at the time.
In Morgan’s cross, the offspring were grey vestigial 41.5 per cent, grey long 8.5 per cent, black vestigial 8.5 per cent and black long 41.5 per cent. Identify which classes are the parental combinations and justify your identification by referring to the original parents rather than to the size of the numbers.
Explain why crossing over between sister chromatids would produce no recombinants, whereas crossing over between non-sister chromatids does.
A single cross over occurs between two homologous chromosomes, each of which consists of two chromatids. Explain why only two of the four resulting chromatids are recombinant.
Draw a pair of homologous chromosomes at the first meiotic prophase and label the following: sister chromatids, non-sister chromatids, chiasma, and the region that will be exchanged.
Explain the reasoning that allows recombination frequency to be used as a measure of the distance between two genes on a chromosome.
Two linked genes show a recombination frequency of 3 per cent, while another two on the same chromosome show 19 per cent. What can you conclude about their relative positions, and which pair is more likely to be inherited together?
Chiasmata had been seen under the microscope well before 1931. Explain why the Creighton and McClintock experiment was still regarded as necessary, and what it added that the sight of a chiasma could not.
In the Creighton and McClintock experiment, the abnormal chromosome 9 carried a heterochromatic knob at one end and a piece of another chromosome at the other. Explain why markers at the two ends, rather than at one end alone, were essential to the design.
A student writes that the phenomenon of linkage is absolute, since genes on the same chromosome must always be inherited together. Identify the error in this statement and correct it using evidence from this chapter.
In Morgan’s Drosophila experiment, the F₂ generation showed a 3:1 ratio of red to white eyes, yet every white eyed fly was male. Explain why the ordinary 3:1 ratio was not by itself sufficient to reveal sex linkage.
A woman who is a carrier for an X-linked recessive condition marries an unaffected man. Using a Punnett square, work out the expected condition of their sons and daughters, and explain why the daughters cannot be affected in this particular cross.
A rare condition appears in a family only in males, and always passes through unaffected mothers. Explain how you would decide whether the condition is autosomal recessive or X-linked recessive, stating the evidence you would look for in the pedigree.
Explain why Mendel’s laws cannot account for the inheritance of leaf variegation in Mirabilis jalapa, referring specifically to the two assumptions on which those laws rest.
A breeder crosses a variegated four o’clock plant used as the female parent with a green plant used as the pollen parent, and then repeats the cross with the roles reversed. Predict the two results and explain what the difference between them establishes.
A student wants to test whether a newly observed character in a plant is controlled by nuclear or by cytoplasmic genes. Outline the crosses the student should perform, the controls that should be kept, and the result that would point to each conclusion.
Explain why polyploidy is very common in the plant kingdom but rare in the animal kingdom.
Match the plants in Column I with the ploidy levels in Column II.
| Column I | Column II |
|---|---|
| a. Rice | i. Tetraploid |
| b. Cotton | ii. Hexaploid |
| c. Wheat | iii. Diploid |
| d. Sugarcane | iv. Octoploid |
| e. Sorghum | v. |
Explain why the addition of complete chromosome sets is often beneficial to a plant, while the gain or loss of a single chromosome is usually harmful.
Seedless bananas and seedless watermelons are commercially valuable because of a defect in meiosis. Explain the defect, and state how such varieties are multiplied for cultivation.
Arrange the following steps in the correct order to describe the origin of an aneuploid individual: fusion with a normal gamete; failure of a homologous pair to separate at meiosis; development of an individual with an abnormal chromosome number; formation of a gamete with an extra chromosome.
Compare forward genetics and reverse genetics under the headings: starting point, direction of investigation, and the type of gene each approach is able to identify.
Whole genome sequencing has identified far more genes than we have functions for. Explain why this outcome made the reverse genetics approach necessary.
Arrange the following steps of a reverse genetics experiment in the correct order: observe the resulting phenotype; select a candidate gene of unknown function; silence the expression of the gene; clone the candidate gene; reinsert the gene into the genome of the same organism.
Distinguish between gene silencing by RNA interference and targeted gene disruption by homologous recombination, with reference to the level at which each acts and what happens to the gene itself.
A researcher silences a candidate gene in a plant and finds no change in the plant’s appearance. State three possible explanations for this result, and describe the first check the researcher should carry out before drawing any conclusion.
Study the two chains shown in Fig. 6.23. Redraw them and label each arrow to show what the investigator does at that step in forward genetics and in reverse genetics respectively.
6.14 Case-Based Questions
- A small seed company in Rajasthan sells tomato seed advertised as “pure tall”. A farmer who bought the seed complains that about a quarter of his plants turned out dwarf. The company’s agronomist visits the farm, confirms the complaint, and discovers that the parent plant from which the seed lot was multiplied had simply been selected on the basis of its appearance in the field.
- Explain what went wrong in the company’s selection procedure.
- Name and describe the cross the agronomist should have carried out on the parent plant before multiplying the seed.
- State the two possible results of that cross and what each would have indicated about the parent’s genotype.
- If the parent plant had been of genotype Tt and was allowed to self-pollinate, what proportion of dwarf plants would be expected in the seed lot?
- A student repeats the classical sweet pea experiment for a school project. She crosses a pure line with red flowers and long pollen grains to a pure line with white flowers and short pollen grains. All the F₁ plants have red flowers and long pollen. On selfing the F₁ plants she obtains an F₂ generation in which red-long and white-short plants together make up far more than half the progeny, while red-short and white-long plants are scarce. Her teacher tells her the result is correct, not a mistake in counting.
- State the ratio she would have expected in F₂ if the two genes had been on different chromosomes.
- Explain what her actual result indicates about the position of the two genes.
- Name the process responsible for the small number of red-short and white-long plants that did appear.
- Suggest why these two classes are described as recombinants.
- A research student is mapping two linked genes in Drosophila. She crosses a doubly heterozygous female with a double recessive male and scores 3,000 offspring. She finds 1,290 and 1,275 individuals in the two parental classes, and 220 and 215 individuals in the two non-parental classes.
- Explain why a double recessive male was chosen as the second parent in this cross.
- Calculate the recombination frequency for this pair of genes.
- Express the distance between the two genes in centimorgans.
- Another pair of genes on the same chromosome gives a recombination frequency of 24 per cent. Which pair lies closer together, and why?
- A genetic counsellor is consulted by a young couple. The woman’s brother has haemophilia; the woman herself, her parents and her husband are all unaffected. The couple want to understand the risk to their future children before deciding on a pregnancy.
- Explain why the woman’s brother is affected while she and her parents are not.
- State what the woman’s possible genotypes are, and what is meant by calling her a carrier.
- If the woman is a carrier, work out the expected condition of the couple’s sons and daughters.
- Explain why the counsellor cannot reduce the risk by advising the couple about the husband’s genotype.
- A horticulturist maintains a bed of four o’clock plants that includes green, white and variegated individuals. She pollinates a variegated plant using pollen from a green plant, and separately pollinates a green plant using pollen from the same variegated plant. She raises both sets of seedlings side by side in identical conditions. The seedlings from the first cross are a mixture of green, white and variegated; those from the second cross are all green.
- Name the type of cross she has performed by carrying out the pollination in both directions.
- Explain why the two results differ although the same two plants were involved.
- State which parent determines the leaf colour of the offspring, and give the reason at the level of the gamete.
- Explain why these results cannot be accounted for by Mendel’s law of segregation.
- A plant breeder is working on a garden ornamental with a basic chromosome number of \(X = 7\). She treats germinating seedlings with a dilute colchicine solution, washes the chemical away, and grows the survivors. Some of the regenerated plants have noticeably thicker leaves and larger flowers than the untreated controls. A root-tip squash of one of these plants shows 28 chromosomes.
- Explain the principle by which colchicine changes the chromosome number of a treated cell.
- Determine the ploidy level of the plant that showed 28 chromosomes.
- Account for the thicker leaves and larger flowers observed in the treated plants.
- Another treated plant shows 29 chromosomes. State what this plant would be called and why it is likely to be less vigorous.
- A laboratory has sequenced the genome of a crop plant and identified a gene whose function is unknown. The team clones the gene, reinserts it into the same plant, and silences its expression using small double stranded RNA molecules. The silenced plants grow normally under greenhouse conditions but wilt rapidly when water is withheld, while control plants survive the same treatment.
- Name the overall approach the team has used and state its starting point.
- Name the technique used to switch off the gene and explain the principle on which it works.
- State what conclusion the team can draw about the normal function of this gene, and explain the reasoning behind it.
- Explain why the greenhouse observation alone, before the water was withheld, would have been misleading.
- A state agriculture department is considering permission for field trials of a crop variety in which a gene has been silenced so that the plant resists a common virus. At the public hearing, farmers’ groups welcome the reduced need for pesticide sprays. An environmental organisation objects that the effects of the introduced RNA on other organisms in the field have not been adequately studied. A seed company representative argues that the plant contains no foreign protein-coding gene, only a silenced version of one of its own.
- Explain, in terms of the technique involved, what the company representative means by saying that no foreign protein-coding gene has been added.
- State one argument in favour of and one argument against permitting the trial, as presented at the hearing.
- Name the body that regulates the release of genetically modified plants in India, and state what it is expected to examine before permission is given.
- Suggest one piece of scientific evidence that the department could reasonably ask for before taking a decision.
6.15 Practice With Data
In a monohybrid cross between two heterozygous tall pea plants, 1,240 F₂ plants were raised. Using the expected Mendelian ratio, calculate the expected number of tall plants and dwarf plants, and state how many of the tall plants would be expected to be homozygous.
A dihybrid cross between round yellow and wrinkled green seeded pea plants produced an F₂ generation of 1,600 seeds. Calculate the expected number of seeds in each of the four phenotypic classes, and state how many of them show a combination of characters that was absent in both parents.
A test cross of a heterozygous tall pea plant with a dwarf plant produced 348 offspring. Calculate the expected number of tall and dwarf plants in this progeny, and state what the result would have been had the tested plant been homozygous tall.
In Mirabilis jalapa, a pink flowered plant was self-pollinated and 424 F₂ plants were obtained. Calculate the expected number of red, pink and white flowered plants. Then state, with a reason, whether the phenotypic and genotypic ratios of this progeny are the same or different.
A herd of cattle contains 96 calves born from crosses between roan animals. Assuming that roan coat colour is due to codominance of the red and white alleles, calculate the expected number of red, roan and white calves in this group.
Morgan’s test cross gave the following progeny: grey vestigial 41.5 per cent, grey long 8.5 per cent, black vestigial 8.5 per cent and black long 41.5 per cent. Calculate the total percentage of parental combinations and of non-parental combinations, and determine the map distance in centimorgans between the two genes concerned.
In a test cross involving two linked genes, 5,000 offspring were scored. The four classes contained 2,110, 2,090, 405 and 395 individuals, the first two being the parental classes. Calculate the recombination frequency and express the distance between the two genes in map units.
Three genes P, Q and R lie on the same chromosome. The recombination frequency between P and Q is 6 per cent, between Q and R is 11 per cent, and between P and R is 17 per cent. Using these values, work out the order of the three genes along the chromosome and draw a linear map showing the distances in centimorgans.
A double heterozygote is test crossed and 800 offspring are obtained. If the two genes had been located on different chromosomes, calculate the number expected in each of the four phenotypic classes. Then state how the observed numbers would differ if the two genes were in fact 10 cM apart on the same chromosome.
A red eyed heterozygous female Drosophila (X^W X^w) is crossed with a red eyed male (X^W Y), and 360 offspring are obtained. Calculate the expected number of red eyed females, red eyed males, white eyed females and white eyed males, and comment on which class is absent and why.
In a survey of 4,000 school children, colour blindness was recorded in 76 boys and 3 girls, the numbers of boys and girls in the survey being equal. Calculate the percentage of affected individuals in each sex, and explain the difference in terms of the inheritance pattern of the character.
The table below gives the chromosome number and the basic set number for four plants. Copy the table, complete the last column, and state which of these plants would be expected to produce very little viable seed.
| Plant | Total number of chromosomes | Number in one set (X) | Ploidy level |
|---|---|---|---|
| A | 36 | 12 | |
| B | 48 | 12 | |
| C | 33 | 11 | |
| D | 56 | 7 |
A species has a basic chromosome number of \(X = 8\). Calculate the total number of chromosomes present in a somatic cell of a diploid, a triploid, a tetraploid and a hexaploid individual of this species, and state which of these numbers could not arise by the addition of complete sets alone if a cell were found with 41 chromosomes.
Using the data of Table 6.1 of this chapter, calculate the ploidy level of wheat, cotton and sugarcane from the figures given, and arrange the ten plants of that table in increasing order of the number of chromosome sets they carry.
In a gene silencing experiment, 240 treated plants and 240 untreated control plants were subjected to a period of drought. After ten days, 36 treated plants and 204 control plants were still alive. Calculate the percentage survival in each group, and state what quantitative comparison the researcher should report to justify the conclusion that the silenced gene is involved in drought tolerance.