Chapter 3: Basic Problems of an Economy
Every year the Union Budget divides a limited pool of government revenue between defence, schools, hospitals, roads and subsidies. More for one head must mean less for another, because the revenue available is fixed. The same difficulty runs through every level of economic life. Human wants are unlimited and keep multiplying, while the land, labour, capital and enterprise available to satisfy them are limited and can be put to alternative uses. Out of this gap between wants and means arises the economic problem — the problem of choice. Because it must choose, every economy has to answer a set of questions. What goods shall be produced, and in what quantity? By which technique? Who shall receive the output that is produced? Are the available resources being fully and efficiently used, and is the capacity to produce growing over time? These are the central problems, and they face a rich economy as squarely as a poor one. This chapter explains the economic problem and the central problems that follow from it, and then uses the production possibility curve to represent scarcity, choice, efficiency and growth.
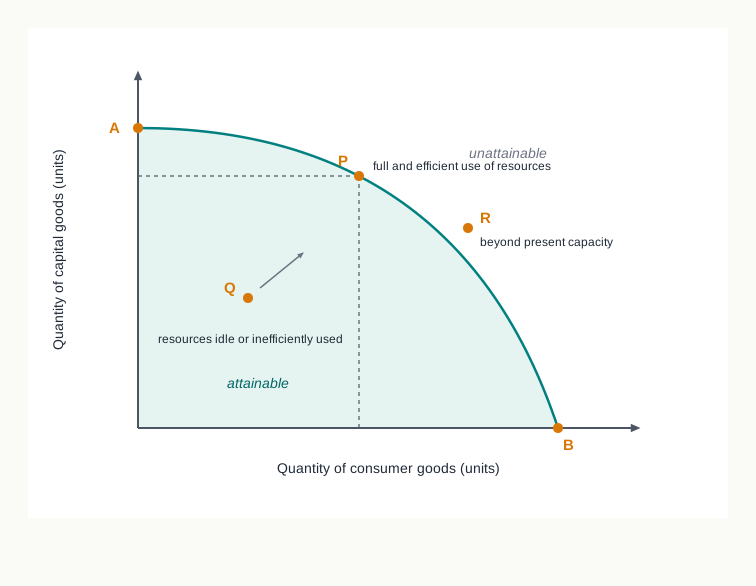
Fig. 3.0 – The choice facing every economy.
3.1 The Economic Problem
Economic questions look very different from one another on the surface. A farmer decides whether to sow wheat or mustard; a family decides whether to spend on a scooter or on a daughter’s coaching classes; a government decides whether to build a highway or a hospital. Beneath these differences lies a single difficulty. In every case there is more that could be done than there are means to do it with, so something must be given up.
That difficulty is the economic problem. It is not the problem of any one person, industry or country. It is the condition out of which the whole subject of economics grows, and every tool the subject builds — the demand curve, the cost schedule, the index number — is finally a way of handling it or of measuring what it costs.
Wants, Means And Scarcity
Human wants are unlimited. The means of satisfying them — the land, labour, capital and enterprise an economy has at its disposal — are limited. The total quantity of goods and services that can be produced by using all the productive resources available is therefore smaller than the quantity people would like to have. This shortfall of means against wants is called scarcity.
Scarcity is a relative idea, and reading it correctly matters. Resources are not scarce in some absolute sense; they are scarce in relation to the demands made upon them. India has a very large labour force and a very large stock of land, and both are nevertheless scarce, because the uses waiting for them exceed what they can do.
This is sometimes stated as the law of scarcity — goods are scarce because there are not enough resources to produce everything that people wish to consume. Scarcity applies to the poorest household and to the richest nation alike, because in neither case is there enough of everything that is wanted.
Since not everything can be had, something must be chosen and something left aside. Scarcity and choice go together: the moment means fall short of ends, a decision has to be taken about which ends the means will serve. The economic problem is, at bottom, this problem of choice.
The problem of choice does not arise from any single fact but from three facts of economic life acting together. They are taken up in turn in the three subsections that follow.
3.1.1 Unlimited Wants
The first fact is that human wants are without limit. They are unlimited in two distinct senses, and both matter.
They are unlimited in number, because satisfying one want commonly gives rise to another. A household that acquires a motorcycle begins to want a helmet, a garage and fuel; a village that gets a road begins to want a bus service. Wants also grow with income, with education and with what others are seen to possess, so a rising standard of living does not close the gap between wants and means but tends to widen it.
They are unlimited in time, because many wants recur. Hunger is satisfied by a meal and returns a few hours later. Clothing wears out and must be replaced. A want that is met today therefore reappears tomorrow, and the demands on resources never come to an end.
Wants are unlimited, but they are not all equally pressing. Some are urgent, some can wait, and some can be given up altogether without much loss. This inequality of urgency is what makes choice possible rather than arbitrary. A person can arrange wants in order of their importance, and this ordering is called a scale of preference. Faced with limited means, the household satisfies the wants standing higher on the scale and postpones those standing lower.
An economy behaves in the same way. Public spending on food security, schooling and public health is placed ahead of spending on stadiums and monuments, not because the second group is worthless, but because the first group stands higher on the community’s scale of preference.
3.1.2 Limited Resources
The second fact is that the resources available to satisfy these wants are limited. The resources of a society consist of land, labour, capital and entrepreneurship. Because they are used to produce goods and services, they are called the factors of production.
Each of them is limited by something concrete. Land is limited by the geographical area of the country and by the fertility of the soil. Labour is limited by the size and skill of the population. Capital — the stock of machines, tools, buildings and equipment — is limited by how much an economy has been able to save and invest in the past. Entrepreneurship is limited by the supply of people willing and able to organise production and bear its risk.
These limits do move outward over time. A country accumulates capital, its workforce grows and becomes better trained, and its technical knowledge improves. But the supply of resources has never overtaken the demands placed on it, because wants expand at least as fast. Growth in resources therefore relieves scarcity; it does not abolish it.
3.1.3 Alternative Uses of Resources
The third fact is that resources can be put to more than one use. A hectare of land near a growing town can grow wheat, grow vegetables, hold a factory shed or carry houses. An hour of a student’s evening can be spent studying or playing. A quantity of steel can become a railway coach or a bridge girder.
This fact is what turns scarcity into a decision. If every resource had only one possible use, the economy would still be short of means, but there would be nothing to decide: each resource would simply do the one thing it could do. Because resources have alternative uses, using them for one purpose necessarily means withdrawing them from another, and the economy has to judge which purpose is worth more.
Scarcity and alternative uses together therefore produce the problem of choice. Scarcity says that not everything can be produced. Alternative uses say that what is produced comes at the cost of something else that could have been produced instead. This cost of the foregone alternative is the idea developed later in the chapter through the production possibility curve.
3.1.4 Scarcity, Choice and Economising of Resources
The economic problem is the outcome of these three facts acting together, and it is worth seeing that no one of them would be enough on its own.
Suppose wants were limited. An economy could then produce enough with the resources it has, every want would be met, and nothing would need to be given up. Suppose instead that resources were unlimited. Wants could all be satisfied however many they were, and again no choice would arise. It is the combination of unlimited wants with limited resources having alternative uses that makes choice unavoidable. The way the three facts converge is set out in Fig. 3.1.
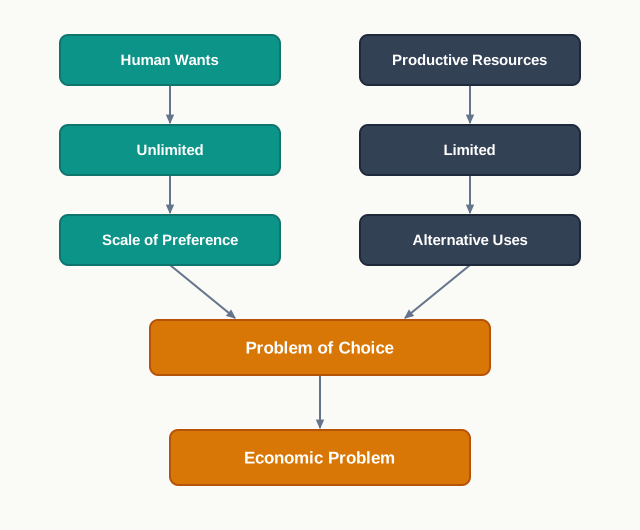
Fig. 3.1 – How the economic problem arises.
Because resources are scarce and can be used in more than one way, they must not be wasted. This gives rise to the need for economising of resources.
Economising is not the same as spending less. It means directing each resource to the use in which it yields the most, so that nothing is left idle and nothing is employed where it contributes less than it could elsewhere.
The Problem Is Universal
The economic problem is faced by everyone. A wage earner with a fixed monthly income must decide how much goes to food, rent, medicines and school fees, and which of these will have to wait. A state government with a given budget must decide between more classrooms and more primary health centres.
It is faced by every economy as well, whatever its level of income and whatever system it follows. In a low-income economy the choice may be a hard one between more food and more cloth; in a high-income economy it may be a comfortable one between a better car and a larger house. The hardness of the choice differs; the necessity of choosing does not. Since resources have alternative uses everywhere, the economic problem is universal in character.
3.2 The Central Problems of an Economy
The economic problem is a single difficulty, but an economy does not meet it in a single form. It meets it as a set of practical decisions that have to be taken before any production can happen at all: what shall be made, by what method, for whose benefit, and whether the resources being used are being used to the full and to the best effect. These decisions are the central problems of an economy.
They are called central, or basic, because no economy can avoid them. A modern industrial economy, a poor agricultural economy and a single stranded person on an island all face them, since all three have limited means and more than one use for those means. What differs from one economy to another is not the set of problems but the machinery used to settle them.
Every economy has to answer the following:
- What to produce, and in what quantity?
- How to produce?
- For whom to produce?
- Are resources being fully utilised?
- Are resources being efficiently utilised?
- Is the capacity to produce growing?
The first three concern the allocation of resources among competing uses, the next two concern the utilisation of the resources an economy already has, and the last concerns the growth of those resources over time. Each is taken up below.
3.2.1 What to Produce
The first problem is deciding which goods and services shall be produced and in what quantities. The two halves of the question cannot be separated. Deciding that cloth shall be produced settles nothing until it is also settled how much cloth, because the resources drawn into cloth are resources withdrawn from everything else.
The problem arises directly from scarcity. Since all goods cannot be produced, an economy must choose among them — food or cloth, consumer goods such as clothing, furniture and cars or capital goods such as machinery, tools and plants, civilian goods or defence equipment. Every such decision commits resources, and committing them to one good means they are not available for another. This is why the problem of what to produce is described as the problem of allocation of resources.
Two considerations settle the answer in practice. The first is the pattern of demand — the kinds of goods people actually want, which differ with climate, income, custom and the size and age structure of the population. Cotton clothing is demanded where the climate is hot and woollens where it is cold. The second is the availability of resources, since an economy can only produce in quantity what its land, labour, capital and skills allow it to produce.
The choice between consumer goods and capital goods deserves particular notice, because it is a choice across time. Consumer goods satisfy wants now. Capital goods do not satisfy wants directly at all; they add to the economy’s power to produce in future. An economy that puts more of its resources into capital goods gives up some present consumption in exchange for a larger output later.
3.2.2 How to Produce
The second problem is the choice of the method or technique of production. The same good can usually be produced in more than one way, using different combinations of factors, and the economy must decide which combination to use.
Techniques are broadly of two kinds. A labour-intensive technique uses more labour and less capital to produce a given output; a capital-intensive technique uses more capital and less labour for the same output. Cotton cloth can be woven on handlooms or on powerlooms; earth can be moved by workers with spades or by an excavator; electricity can be generated from coal or from falling water. The main points of difference between the two techniques are set out below.
Two things determine which technique an economy adopts. The first is the level of technical knowledge available to it, since a technique that has not been developed or acquired cannot be used. The second is the relative availability of factors. An economy with a large labour force and little capital finds labour cheap and capital dear, and leans towards labour-intensive methods; an economy with abundant capital and scarce labour leans the other way. This is why the same good is produced by different methods in different countries.
The problem of technique is again a problem forced by scarcity. If resources were unlimited, any method would do, however wasteful. Because they are limited, the economy must select the method that produces the required output using the smallest sacrifice of resources.
3.2.3 For Whom to Produce
The third problem concerns the distribution of what has been produced. Output does not distribute itself. Once goods and services exist, an economy must settle who shall get them, and in what shares.
Goods go to those who can pay for them, so the question of who receives the output resolves into the question of how income is distributed among the people. That distribution is settled in the first place by the market for factors. Land, labour, capital and enterprise cooperate in production, and each receives a payment for its services — rent, wages, interest and profit. These factor incomes together make up the national income, and how they are shared decides how the national product is shared.
Two aspects of the problem are worth separating. One is the division of income among the factors of production, which depends on how much of each factor a person owns and what that factor earns. The other is the division among persons and households, which is what determines whether the output of the economy reaches the many or the few. An economy may produce a great deal and still leave a large part of its population poorly supplied, if incomes are very unequally distributed.
3.2.4 Fuller Utilisation of Resources
The three problems so far assume that whatever resources exist are being used. That assumption often fails, and the failure is itself a central problem.
Resources may lie idle. Workers willing to work may not find work, machinery may stand unused, and land may be left uncultivated. Unemployment of resources is a dead loss: goods that could have been produced are not produced, and nothing is gained in exchange. A worker who is idle for six months does not store up six months of extra output for later; that output is simply lost.
Since resources are scarce to begin with, leaving any of them unused makes the shortage worse than it needs to be. Every economy therefore faces the problem of employing its resources as fully as possible — of ensuring that labour, capital and land are actually at work rather than waiting.
3.2.5 Efficient Use of Resources
Using all the resources is not by itself enough; they must also be used well. Resources are efficiently used when they are allocated in the way that yields the greatest possible output from them.
Economics gives efficiency a precise meaning. An economy is producing efficiently when it cannot produce more of one good without producing less of some other good. If output of one good can be raised without any reduction elsewhere, some resource must have been misdirected, and the position was not efficient to begin with.
Inefficiency can exist even with no resource idle. If masons are set to do the work of carpenters and carpenters the work of masons, everyone is employed and yet output is below what the same people could produce if the two jobs were exchanged. Simply reallocating them raises output, which is precisely the test of inefficiency.
3.2.6 The Problem of Economic Growth
The problems considered so far take the economy’s productive capacity as given. Over time that capacity itself can change, and enlarging it is the sixth central problem.
The capacity to produce depends on the quantity of resources an economy commands and on the efficiency with which they can be used. It grows when the stock of capital is added to, when the workforce grows or becomes better educated and healthier, and when better techniques become available. Growth in capacity means that a larger output of goods and services can be produced in future years than can be produced now, which is the only durable way of raising the standard of living.
Every economy therefore devotes part of its present resources to enlarging its future capacity rather than to satisfying present wants — and this too is a choice forced by scarcity, since resources put to that purpose are resources not consumed today. Growth in productive capacity is traditionally judged by the rise in national income and in per capita income.
The Six Problems Together
The six central problems fall into three groups. What to produce, how to produce and for whom to produce are problems of the allocation of resources. Fuller utilisation and efficient utilisation are problems of the utilisation of resources. The sixth is the problem of the growth of resources. The grouping is set out in Fig. 3.2.
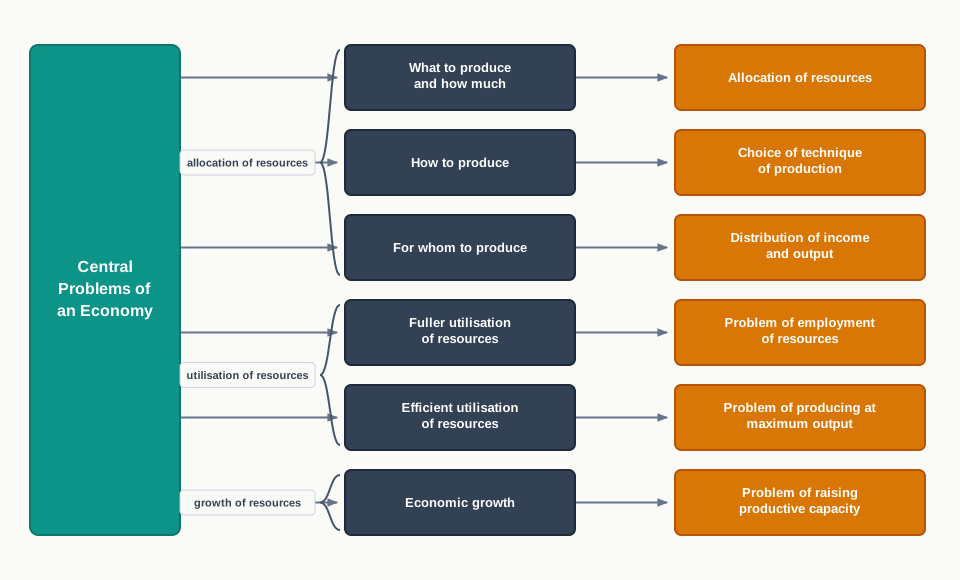
Fig. 3.2 – The central problems of an economy.
These problems are common to all economies, but the machinery for solving them is not. In traditional societies they were settled by custom; in a capitalist economy they are settled largely through the price mechanism; in a socialist economy they are settled by a planning authority. How each system goes about it is taken up in the chapter on types of economies. The tool used in the rest of this chapter to represent the problems themselves is the production possibility curve.
3.3 The Production Possibility Curve
The central problems have so far been described in words. Economics prefers to represent them in a form that can be drawn, so that the limit on what an economy can do, and the cost of moving in one direction rather than another, can both be seen at once. The tool that does this is the production possibility curve.
The device works by simplification. A real economy produces thousands of goods, which cannot be drawn on a sheet of paper, so the analysis is conducted for an economy producing only two. Nothing essential is lost by this. Whatever is true of the choice between two goods is true of the choice among many, because the difficulty in both cases is that resources given to one use are withdrawn from another.
3.3.1 Meaning of the Production Possibility Curve
Consider an economy that produces only two goods, butter and guns. The pair is a convenient one because it stands for the choice between civilian goods and defence goods, which every country has to make. Suppose the economy’s resources and its technology are given, and that all its resources are fully employed and efficiently used.
If every resource were put into guns, the economy could produce 15 thousand guns and no butter at all. If every resource were put into butter, it could produce 5 million kg of butter and no guns. Between these two extremes lie the combinations in which resources are divided between the two goods. The complete list of combinations open to the economy is called a production possibility schedule, and one such schedule is given in Table 3.1.
Combination A is one extreme, with all resources in guns; F is the other, with all resources in butter. B, C, D and E are intermediate combinations in which both goods are produced. As the economy moves down the schedule from A to F, guns are not physically turned into butter; resources are simply withdrawn from making guns and put to making butter.
Plotting these combinations on a graph and joining them gives the curve shown in Fig. 3.3.
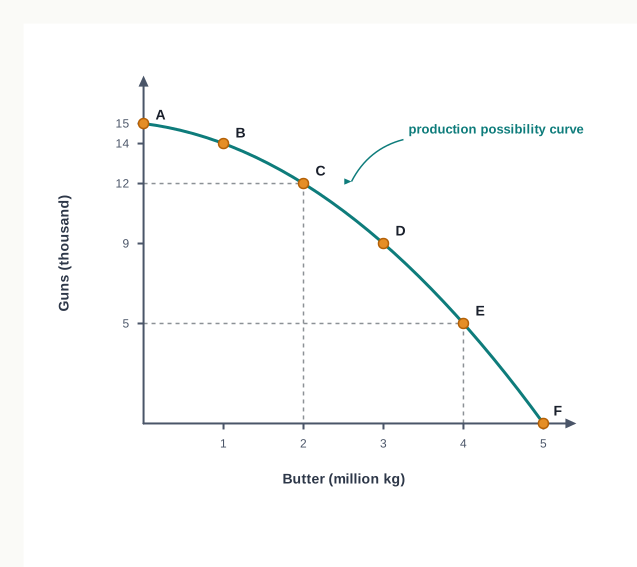
Fig. 3.3 – Production possibility curve for butter and guns.
The curve depicts a society’s menu of choices. Every point on it is a position the economy could occupy, and the economy must settle on one of them. It also carries a plain warning: to have more of one good the economy must transfer resources away from the other, and so accept less of it. Because it shows how one good can be transformed into the other by shifting resources, the curve is also called the transformation curve.
3.3.2 Assumptions of the Production Possibility Curve
The curve is drawn under four assumptions. Each is needed for a particular reason, and knowing the reason makes the shape of the curve intelligible.
- The amount of productive resources is fixed — if the quantity of resources could change while the curve was being drawn, the maximum output of each good would change too, and no single boundary could be marked.
- Technology is given and does not change — a better technique would allow more of both goods to be produced from the same resources, and would place the boundary elsewhere.
- All resources are fully employed and efficiently used — the curve shows the maximum the economy is capable of, which it reaches only when nothing is idle and nothing is misdirected.
- Resources are not equally efficient in the production of both goods — a resource well suited to making guns is not equally well suited to making butter, so transferring resources from one good to the other lowers their productivity and raises the cost of production.
The first three assumptions fix the position of the curve. The fourth fixes its shape, as the next subsection shows.
3.3.3 Features of the Production Possibility Curve
The production possibility curve has two characteristics: it slopes downwards to the right, and it is concave to the origin.
3.3.3.1 The Curve Slopes Downwards to the Right
The curve falls as it moves rightward, which means that more of the good on the X-axis can be had only with less of the good on the Y-axis. This follows from the assumptions. Resources are fixed and already fully employed, so there is no spare capacity anywhere; the only way to produce more butter is to take resources out of guns.
The quantity of guns given up is the real cost of the additional butter. Economics calls this the opportunity cost of a decision — the value of the next best alternative that had to be forgone.
Opportunity cost is the reason a downward slope is not merely a feature of the drawing. It records the fact that in an economy of scarce resources nothing is free: every gain is paid for in something forgone.
3.3.3.2 The Curve Is Concave to the Origin
The curve does not fall as a straight line; it bows outward from the origin, becoming steeper as it moves to the right. Concavity means that the opportunity cost of the good measured on the X-axis rises as more of it is produced.
The rise can be read directly from Table 3.1. Moving from A to B, the economy gives up 1 thousand guns to gain the first million kg of butter. Moving from B to C it gives up 2 thousand, from C to D it gives up 3 thousand, and so on to 5 thousand for the last million kg. The quantity of guns sacrificed for each additional unit of butter is the marginal opportunity cost, and here it is increasing.
The reason lies in the fourth assumption. Resources are not equally efficient in producing both goods. When the economy first moves resources out of guns, it transfers those that are least suited to gun-making and best suited to butter-making, and little is lost in guns for the butter gained. As the shift continues, it is forced to draw on resources that are progressively better at making guns and worse at making butter, so each further million kg of butter costs more guns than the one before.
Had resources been equally efficient in both uses, the sacrifice would have been the same at every step and the curve would have been a straight line, as shown in Fig. 3.4. The concave shape is therefore a statement about the resources of a real economy, not a drawing convention.
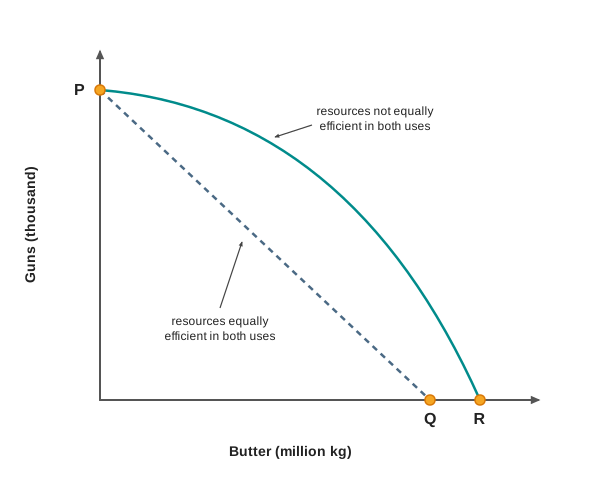
Fig. 3.4 – Constant and increasing opportunity cost.
3.4 Central Problems on the Production Possibility Curve
The curve drawn in the last section is more than a picture of what an economy can make. Once the boundary is drawn, the plane divides into three regions — the points beyond the curve, the points on it and the points within it — and each region says something about the central problems. This section reads the curve for scarcity, for choice and for the utilisation of resources. Growth, which moves the boundary itself, is taken up in section 3.5.
3.4.1 Scarcity and the Unattainable Region
Scarcity appears on the diagram as everything the economy cannot reach. Any combination lying beyond the curve requires more resources than the economy possesses, and so cannot be produced however the resources on hand are arranged. Such a combination is shown by point K in Fig. 3.5.

Fig. 3.5 – Scarcity and choice on the production possibility curve.
The economy is confined to the shaded region, and it is confined there by the quantity of resources it has, not by any decision it takes. The unattainable region is scarcity made visible: the wants that lie beyond it cannot be met at present whatever the economy chooses to do.
3.4.2 Choice and the Problem of What to Produce
Scarcity confines the economy to the attainable region; choice decides where within it the economy settles. If resources are fully and efficiently used, that position must lie on the curve itself, and the economy has to pick one of its points.
The picking is the problem of what to produce. At C in Fig. 3.5 the economy produces 12 thousand guns and 2 million kg of butter; at E it produces 5 thousand guns and 4 million kg of butter. Both are open to it and it cannot have both. Whether it moves towards C or towards E depends on the wants of the community and on the urgency it attaches to them — on the scale of preference discussed in section 3.1.
Because every point on the curve involves full use of resources, movement along the curve is always a trade. Going from E to C gains guns and loses butter; going from C to E does the reverse. The curve thus shows the problem of choice and the cost of choosing in a single line: the slope between any two points measures exactly what the move costs.
It is worth noticing what the curve does not show. It represents what to produce, and through its slope the cost of producing it, but it says nothing about the technique used or about who receives the output. How to produce and for whom to produce are central problems that this particular tool leaves aside.
3.4.3 Full and Efficient Utilisation of Resources
The region inside the curve carries its own meaning. A combination lying within the boundary is attainable — the economy has resources enough to produce it — and yet it falls short of what those resources could achieve. Such a position is shown by point H in Fig. 3.6.
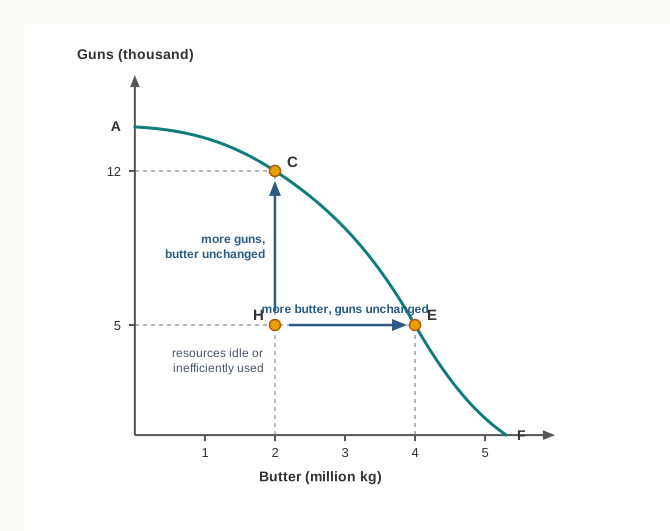
Fig. 3.6 – Underutilisation of resources.
A position inside the curve arises for either of two reasons. Some resources may be lying idle, so that the economy is not producing as much as it could simply because part of its capacity is not at work. Or all resources may be employed but wrongly allocated, so that they yield less than they would in better uses. The first is a failure of full utilisation, the second a failure of efficiency, and the diagram does not distinguish between them: both put the economy at the same kind of point.
What the diagram does show clearly is the size of the loss. From H the economy can move up to C and gain 7 thousand guns without giving up any butter at all, or move right to E and gain 2 million kg of butter without giving up any guns. Such gains are available only because the starting position was wasteful. Once the economy reaches the curve, no such free gain remains, and every increase in one good must be paid for in the other.
This is the practical importance of the boundary. On the curve, the economy is up against genuine scarcity and faces real opportunity costs. Inside it, what looks like scarcity is partly its own waste.
3.5 Shift and Rotation of the Production Possibility Curve
Everything said so far has treated the boundary as fixed. That was a consequence of the first two assumptions: the quantity of resources was taken as given and technology was taken as unchanging. Over time neither assumption holds. Resources accumulate, populations grow, skills improve and new methods of production come into use, and when they do the boundary itself moves.
The movement takes two forms, and the syllabus requires both. If the change affects the economy’s capacity to produce both goods, the whole curve shifts. If it affects the capacity to produce one good only, the curve rotates about the intercept of the other. The distinction matters, because a shift and a rotation say different things about what has changed.
3.5.1 Growth of Resources and the Outward Shift
Suppose the economy’s stock of resources grows. It saves and invests, so its stock of machinery and equipment rises; its labour force grows and becomes better educated and healthier; new land is brought under use. The economy can now produce more guns than before and more butter than before, so both extreme points move outward and the whole curve shifts to the right, as shown in Fig. 3.7.
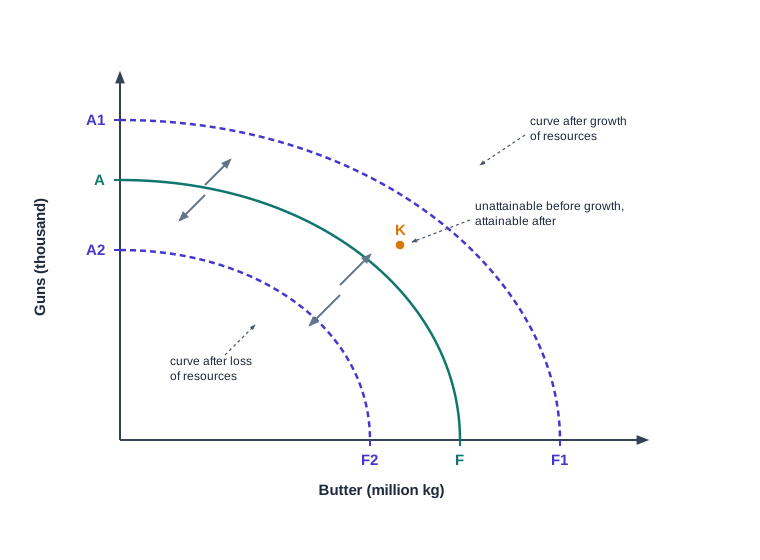
Fig. 3.7 – Shift of the production possibility curve.
The gain is a real one, and Fig. 3.7 shows its nature exactly. Combinations that were unattainable become attainable: point K lay beyond the old curve and lies within the new one. The economy is not merely choosing differently; it is capable of more than it was.
This is the problem of economic growth set out in section 3.2.6, seen as a movement of the boundary. It is also worth noting that the boundary can move the other way. A war, a severe natural disaster or a lasting decline in the working population destroys resources, and the curve shifts inward to A2F2, so that combinations once open to the economy are closed to it.
What growth does not do is abolish scarcity. The new curve is still a boundary, still has an unattainable region beyond it, and still forces the economy to give up one good to have more of the other. Growth relaxes the constraint; it does not remove it.
3.5.2 The Role of Technology
Technological progress works on the boundary in the same way as a growth of resources, but by a different route. It leaves the quantity of resources unchanged and raises what those resources can produce.
An improvement in technology that raises output in both lines of production — better sources of power, faster transport, improved organisation of work — allows more guns and more butter to be produced from the same land, labour and capital. The maximum of each good rises, and the curve shifts outward exactly as in Fig. 3.7. This is why the assumption of given technology matters so much to the analysis: relax it, and the boundary will not stay still.
Technological change of this kind is the most important single source of long-run growth, because resources are limited by nature and by population while knowledge is not. A country that improves its techniques gets more out of the endowment it already has.
3.5.3 Rotation of the Production Possibility Curve
Technological progress is usually uneven. A new method may raise output in one industry and leave the other exactly as it was. When that happens the curve does not shift bodily; it turns, or rotates, about the intercept of the good that is unaffected.
Take an improvement in the technique of producing butter, with no change in gun-making. If all resources were put into butter, the economy could now produce more butter than before, so the intercept on the butter axis moves outward. If all resources were put into guns, it could produce exactly what it produced before, so the intercept on the gun axis stays where it is. The curve pivots about the fixed point, as in Fig. 3.8.
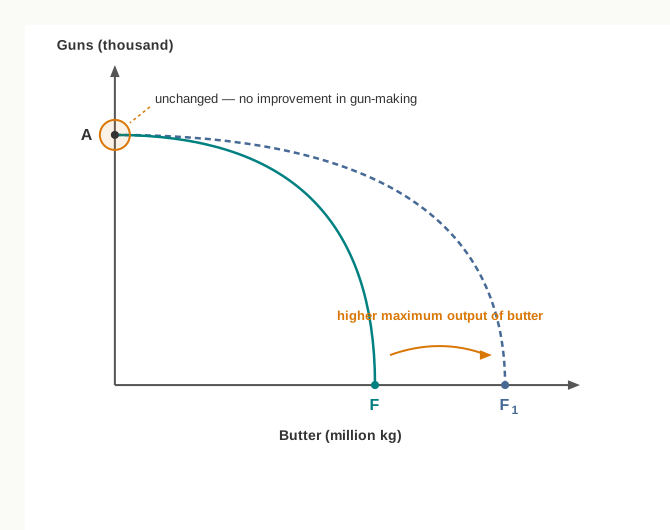
Fig. 3.8 – Rotation when technology improves in butter only.
The reverse case works in the same way. An improvement confined to gun-making raises the maximum quantity of guns and leaves the maximum quantity of butter untouched, so the curve pivots about the butter intercept instead, as in Fig. 3.9.
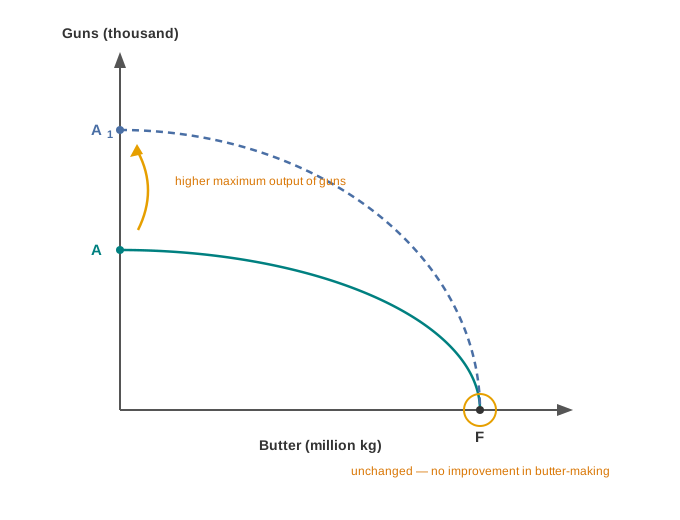
Fig. 3.9 – Rotation when technology improves in guns only.
A rotation is not confined to changes in technique. Any change in resources that helps one good and not the other has the same effect: land reclaimed for cultivation raises the maximum output of farm goods while doing nothing for the output of steel, and the curve turns rather than shifts.
Two features of a rotation are worth stating plainly. First, the economy’s capacity is enlarged in one direction only, so the gain in what it can produce is uneven. Second, the opportunity cost of the two goods changes, since the slope of the curve is no longer what it was; the good whose production has improved has become cheaper in terms of the other. A shift and a rotation both loosen the constraint, but a rotation also alters the terms on which the two goods can be exchanged for each other.
3.6 Summary
- Human wants are unlimited while the resources available to satisfy them are limited. This gap is called scarcity, and it is relative — resources are scarce in relation to the demands made on them, not in relation to any fixed quantity.
- The economic problem is the problem of allocating limited resources, which have alternative uses, among unlimited wants. Since all wants cannot be satisfied, it is essentially the problem of choice.
- The economic problem arises from three interrelated facts of economic life:
- Wants are unlimited in number and recur over time, though they differ in urgency and can be arranged on a scale of preference.
- Resources are limited, each factor of production being restricted by population, area, past saving or available knowledge.
- Resources have alternative uses, so devoting them to one purpose withdraws them from another.
- Because resources are scarce and have alternative uses, they must be economised — allocated among their different uses so that they are put to their best possible use and yield the maximum output.
- The economic problem is universal. It faces individuals, households and governments, rich economies and poor ones, whatever economic system they follow. What differs is the hardness of the choice, not the need to choose.
- Every economy must answer six central problems:
- What to produce and in what quantity — the problem of allocation of resources, settled by the pattern of demand and the resources available.
- How to produce — the problem of choosing between labour-intensive and capital-intensive techniques, settled by the level of technical knowledge and the relative availability of factors.
- For whom to produce — the problem of distribution of income and output among the factors of production and among households.
- Fuller utilisation of resources — the problem of ensuring that resources are not left idle, since unemployed resources are a dead loss.
- Efficient use of resources — an economy is efficient when it cannot produce more of one good without producing less of another.
- Economic growth — the problem of enlarging the economy’s capacity to produce over time.
- The first three central problems concern the allocation of resources, the next two their utilisation, and the sixth their growth. All economies face them; they differ only in the machinery — custom, the price mechanism or planning — used to solve them.
- The production possibility curve shows the various combinations of two goods an economy can produce with its given resources and given technology, when all resources are fully employed and efficiently used. It is also called the transformation curve.
- The curve rests on four assumptions: resources are fixed in quantity, technology is unchanged, resources are fully and efficiently employed, and resources are not equally efficient in producing both goods.
- The curve slopes downwards to the right, because with resources fixed and fully used, more of one good can be obtained only by giving up some of the other. The quantity given up is the opportunity cost of the gain.
- The curve is concave to the origin, because marginal opportunity cost rises as more of a good is produced. The reason is the fourth assumption: resources transferred later are progressively less suited to their new use. Were resources equally efficient in both uses, the curve would be a straight line.
- The central problems can be read directly from the curve:
- Points beyond the curve are unattainable, which is scarcity made visible.
- Points on the curve represent full and efficient use of resources, and choosing among them is the problem of what to produce.
- Points inside the curve are attainable but wasteful, showing either idle resources or inefficient allocation.
- A growth of resources, or a technological improvement affecting both goods, shifts the whole curve outward and makes previously unattainable combinations attainable. A loss of resources shifts it inward. Growth relaxes scarcity but does not abolish it.
- A change that raises the capacity to produce one good only rotates the curve about the intercept of the other good. A rotation enlarges capacity unevenly and also alters opportunity cost, since the slope of the curve changes.
The two ways in which the curve can move are set out below.
3.7 Points to Ponder
- An economy that puts more resources into capital goods gives up consumption today in return for a larger output later. Who bears that sacrifice, and who receives the later gain? Is a generation entitled to ask the one before it to consume less on its behalf?
- The production possibility curve assumes that resources are fully and efficiently employed. If real economies almost never satisfy that assumption, is the curve describing what an economy does, or only what it could do? What is the use of a boundary an economy rarely reaches?
- Clean air, a quiet street and unspoilt forest are wanted, but they appear on no production possibility curve of the kind drawn in this chapter. If some of what an economy gives up is never measured, is opportunity cost as calculated here too low?
- A labour-intensive technique employs more people; a capital-intensive technique produces more cheaply. For an economy with a large workforce and scarce capital, which consideration should weigh more, and should the answer be the same in every industry?
- Growth shifts the boundary outward, yet scarcity persists because wants expand alongside means. Does that make growth a way of solving the economic problem, or only a way of changing the terms on which it is faced?
- The chapter treats ‘what to produce’ and ‘for whom to produce’ as separate problems. But the goods an economy chooses to produce depend on who holds the purchasing power to demand them. Can the two questions really be answered independently of each other?
3.8 Objective Questions
- A combination of two goods lying inside an economy’s production possibility curve indicates that: [1]
- the combination cannot be produced with the available resources
- resources are fully employed and efficiently used
- some resources are idle or are being used inefficiently
- the economy’s stock of resources has grown
- Read the following statements and choose the correct option. [1] Assertion (A): The production possibility curve is concave to the origin. Reason (R): Resources are equally efficient in the production of both goods.
- Both A and R are true and R is the correct explanation of A.
- Both A and R are true but R is not the correct explanation of A.
- A is true and R is false.
- A is false and R is true.
- Fill in the blank: The quantity of one good that has to be given up in order to obtain an additional unit of another good is called the ________ of that unit. [1]
- State whether the following statement is true or false: An outward shift of the production possibility curve removes the problem of scarcity from an economy. [1]
- Match the items in Column A with those in Column B. [1]
| Column A | Column B |
|---|---|
| a. A point lying beyond the production possibility curve | i. For whom to produce |
| b. Choice between handlooms and powerlooms | ii. How to produce |
| c. Division of national income among households | iii. Scarcity of resources |
3.9 Check Your Concepts
- State any two assumptions on which a production possibility curve is drawn. [2]
- Distinguish between a labour-intensive and a capital-intensive technique of production, giving one example of each. [3]
- The technique of producing rice improves, while the technique of producing cloth remains exactly as it was. Show with the help of a diagram what happens to the economy’s production possibility curve, and explain how this differs from an outward shift of the curve. [4]
- Explain the central problems that every economy has to face, and illustrate scarcity, choice and underutilisation of resources on a single production possibility curve. [6]
3.10 Case-Based Question
- Meghna Handlooms is a small firm in Bhilwara with a fixed number of weavers and a fixed number of looms. With these resources it can weave either bedsheets or curtains, and its owner finds that every additional bundle of curtains woven in a week means fewer bedsheets that week. During the last quarter, orders fell, and four of the firm’s looms stood unused for several weeks together while the weavers attached to them waited for work.
- Which central problem is the owner facing when she decides how many bedsheets and how many curtains to weave in a week? Give a reason for your answer. [2]
- Where would the firm’s output during the last quarter lie in relation to its production possibility curve, and what would the firm gain by bringing the idle looms back into use? [2]