Chapter 7: Parameters of Development
Every economy needs to know whether it is developing, and that means finding something to measure. Output can be counted; development cannot be counted so easily, because it takes in not only how much an economy produces but how long its people live, how much schooling they receive and how evenly the income is shared. A country can raise its output sharply and still leave most of its people short of the basics. India’s real per capita income has risen many times over since independence, yet how long an Indian lives and how many years of schooling a child can expect have had to be tracked separately, because the income figure says nothing about them. That is the difficulty every parameter of development has to face: a single number is being asked to describe a many-sided process. Economics answers it in two ways. It measures income per head, and it measures the quality of life directly. This chapter studies per capita income as a parameter of development and the limitations that keep it from being a complete one, the shift towards quality of life measures, and the construction, merits and limitations of the Human Development Index, together with India’s position on it.
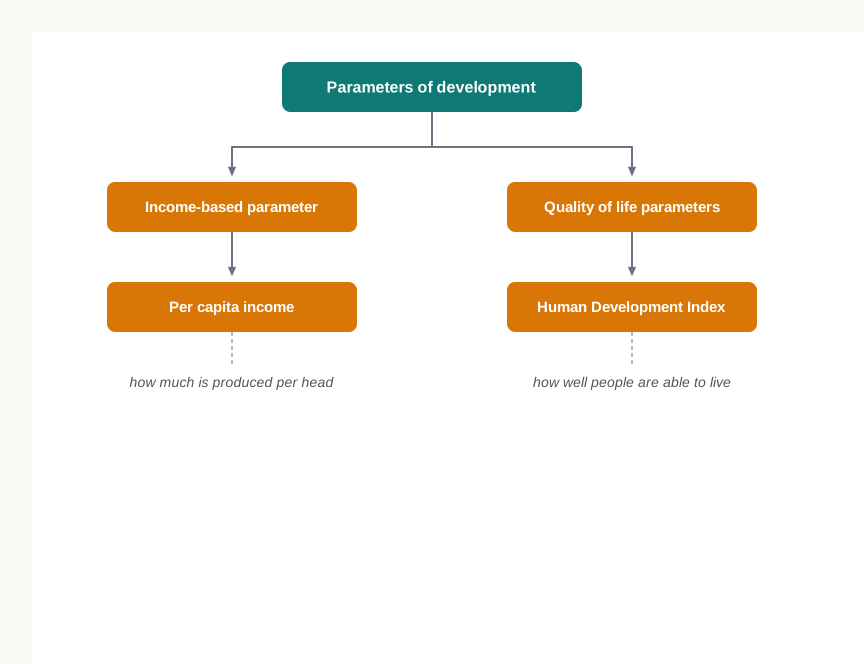
Fig. 7.0 – The two families of development parameters.
7.1 The Problem of Measuring Development
Economic development was defined in the previous chapter as a rise in output accompanied by an improvement in the conditions of life. Defining it is one task; measuring it is another and a harder one. An economy that wishes to know whether it is developing must find some quantity it can observe, record and compare over time, and no single quantity captures everything the definition contains.
7.1.1 Why Development Has to Be Measured
Development is not merely something an economy hopes for; it is the objective its policies are built around. Plans are drawn up, funds allocated and programmes run in its name, and none of that can be assessed unless the outcome can be measured.
Measurement serves three purposes. It shows whether the condition of an economy is improving or worsening over a period of years. It allows one economy to be compared with another, and one region within a country with the rest. It tells policy-makers which aspect of development is lagging, so that resources can be directed to it.
The quantity chosen for this purpose is called a parameter, or indicator, of development.
7.1.2 Development as a Multidimensional Process
The difficulty of measurement arises from the nature of what is being measured. Economic development is a multidimensional process: it involves a rise in the level of income, a change in the way that income is distributed, a change in the composition of output, and changes in social structure, attitudes and institutions, together with the removal of illiteracy and poverty.
These dimensions do not move together. Output can grow while illiteracy persists, and income can rise while its distribution grows more unequal. A measure that follows one dimension closely will therefore be silent about the others.
It follows that no single measurement can completely describe economic development. Every parameter in use is a partial one, useful for what it captures and to be read alongside what it leaves out.
7.1.3 Income-Based and Quality of Life Parameters
The parameters in use fall into two families.
- Income-based measures — these treat the income earned per head of population as the indicator of development. Per capita income is the measure of this kind in general use.
- Quality of life measures — these look directly at the conditions in which people live, such as health, schooling and the availability of the basic necessities. The Physical Quality of Life Index, the Basic Needs Index and the Human Development Index are measures of this kind.
The first family rests on the view that a larger income per head puts more goods and services within reach, and so stands for a better life. The second rests on the view that the life people actually lead should be observed directly rather than inferred from their income.
The main points of difference between the two families are set out below.
Of the quality of life measures, the Physical Quality of Life Index and the Basic Needs Index were early attempts and are now little used. The two parameters studied in the rest of this chapter are therefore per capita income and the Human Development Index.
7.2 Per Capita Income as a Parameter of Development
The oldest and most widely used parameter of development is income per head. It rests on a simple line of reasoning: an economy develops when it produces more, and what matters to the people living in it is not the size of that output but the share of it available to each of them.
7.2.1 Meaning of Per Capita Income
The national income of an economy measures the total value of goods and services it produces in a year. Taken by itself, that total tells us the economic size of the country, not the position of the people in it. A country with a large population may produce a large output and still leave very little for each person. To arrive at the amount available per person, national income is divided by the number of people.
\[\text{Per capita income} = \dfrac{\text{National income}}{\text{Population}}\]
Here national income is the value of the goods and services produced in the year, measured in rupees, and population is the total number of people in the country at the middle of that year. The result is an amount of money per person per year, and it is read as the income that would be available to each person if the national income were shared equally among them.
7.2.2 Nominal and Real Per Capita Income
Because per capita income is a money figure, it moves for two quite different reasons: because output per head has changed, and because prices have changed. The two must be separated before the figure can be used as a parameter of development.
Nominal per capita income is worked out from national income measured at the prices ruling in the current year. If prices rise while output stays exactly where it was, this figure still rises, and the rise means nothing in terms of goods.
Real per capita income is worked out from national income measured at the prices of a fixed base year. Since the prices are held constant, a rise in this figure can only come from a rise in output per head. It is the real figure, and the real figure alone, that is used as a parameter of development.
7.2.3 Why Per Capita Income Is Used
Four reasons account for the long standing of this parameter.
- It corrects for population — a rise in real per capita income shows that an economy has been able to expand its output faster than its population is growing, which a figure for national income alone cannot show.
- It stands for command over goods — a higher income per head means more food, clothing, housing, health care and schooling can be bought, and these are the things development is meant to deliver.
- It is a single quantified figure — being one number in money terms, it can be compared across years and across countries in a way that descriptive accounts of living conditions cannot.
- It is readily available — national income and population are estimated regularly by official agencies, so the figure can be computed year after year on a consistent basis.
For these reasons an increase in real per capita income over a long period was conventionally regarded as the best single index of economic development. Whether it deserves that standing is the question taken up next.
7.3 Limitations of Per Capita Income
Per capita income has one great advantage: it reduces the condition of a whole economy to a single number that can be compared across years and across countries. Every one of its limitations follows from that same fact. A single average, computed from marketed output alone, cannot report what is produced, who receives it, what its production cost, or what it buys. The limitations below set out what the figure leaves out.
7.3.1 Composition of Output Is Ignored
Per capita income counts the value of output, not its nature. Two economies with the same income per head may be producing entirely different things.
If a rise in national income has come from a larger production of armaments and other non-civilian goods, the figure rises, but the goods produced do not enter the daily life of the ordinary person. An economy in which the increase has come from food, housing, medicines and schooling has developed in a sense that the first has not, though the two look alike in the accounts. What is important for development is not only more output per head but the composition of output.
7.3.2 Distribution of Income Is Ignored
An average carries no information about the spread of the values from which it is computed. Per capita income can rise because the incomes of a small number of rich people have risen sharply, while the incomes of the majority are unchanged or lower.
It is therefore possible for the average to improve at the same time as the rich grow richer and the poor grow poorer. From the point of view of development, what matters is not only the size of the cake but how the cake is divided. Unless the rise in average income is accompanied by a reduction in inequality in the distribution of income, it cannot be said with any confidence that the economic welfare of the people has increased.
7.3.3 Poverty Behind the Average
The same reasoning applies with particular force to the poor. Since the average is silent about the spread, it is entirely possible for per capita income to rise while the number of people living below the poverty line increases.
This has in fact happened in a number of developing countries. An economy that reports a higher income per head and a larger population in poverty has not solved the problem that development is meant to solve, and the parameter gives no warning of it.
7.3.4 Cost Elements Are Not Allowed For
Output is not obtained for nothing. Raising income may require people to work longer hours, may exhaust forests, minerals and groundwater, and may leave the air and water polluted. None of these costs is deducted when national income is divided by population.
An economy that has raised its output by working its labour force harder in unhealthy conditions and by using up resources that cannot be replaced has bought its higher figure at a price that the figure itself does not record. From the point of view of development, what has to be known is not only how much output there is and what it consists of, but how it was obtained.
7.3.5 Non-Marketed Goods and Services Are Left Out
National income includes only those goods and services for which a payment is made in money. A great many useful services are performed without payment and are therefore missing from the estimate.
The clearest instance is unpaid work within the household — cooking, cleaning, caring for children and the elderly, repairs, kitchen gardening and the teaching of one’s own children. These services are performed out of affection and obligation, no price is attached to them, and their value cannot easily be computed. Yet the well-being of a household depends on them exactly as it depends on services that are bought. A parameter that excludes them understates what people actually have.
7.3.6 Problems in International Comparison
A further set of difficulties arises when per capita income is used to compare the standard of living, the level of economic welfare and the rate of growth of different countries. Three problems stand out.
7.3.6.1 Conversion into a Common Currency
Each country measures its national income in its own currency — India in rupees, the United Kingdom in pounds. Before two countries can be compared, both figures must be expressed in a common currency, and this is usually done by converting them into US dollars at the exchange rate ruling at the time.
The exchange rate, however, keeps changing, and it is determined largely by the currencies traded across borders. A country’s income per head can appear to fall in dollars simply because its currency has depreciated, though nothing has changed inside the country.
7.3.6.2 Different Concepts of National Income
Countries have not always defined national income in the same way. The economies of the former socialist bloc worked with a material product concept, under which only material goods were counted and most services were excluded, while the rest of the world included both goods and services.
Where the underlying concept differs, the two figures measure different things, and comparing them means comparing dissimilar quantities. International agencies now issue common accounting standards to reduce this difficulty, but differences in coverage and in the quality of the estimates remain.
7.3.6.3 Differences in Price Levels
Even after conversion into a common currency, an identical income does not represent an identical standard of living, because prices differ between countries. Food, housing, transport and services generally cost less in a developing country than in a rich one.
A given number of dollars therefore buys appreciably more in India than in the United States, and comparing the two incomes without allowing for this understates what the Indian income commands. The correction for this difference is discussed in section 7.5, where the construction of the Human Development Index is taken up.
7.4 Quality of Life as a Parameter
Once the limitations of per capita income were widely accepted, the search began for a parameter that would measure development by looking at people’s lives directly. The measures that came out of that search are grouped together as quality of life measures.
7.4.1 From Income to Quality of Life
The limitations set out in section 7.3 led some economists and policy-makers to argue that the income-based parameter should be discarded altogether. Most did not go that far. What they sought instead was a set of measures that would report the outcomes of development rather than the income that is supposed to produce them.
The reasoning is straightforward. Income is a means; the end is a life of a certain quality. Whether that end has been reached can be observed, because the things a decent life requires are themselves measurable — enough food, clothing and shelter, the ability to read and write, health care within reach, clean air and water, a reasonable spread of income and wealth across the population, and civil and political rights.
The difficulty is that these are many separate quantities, measured in different units. To arrive at a parameter, several of them are combined into a single figure. A measure built in this way is called a composite index, and one built from indicators of living conditions is called a quality of life index.
7.4.2 Early Quality of Life Measures
Two composite measures built in the 1970s prepared the ground for the index in use today. Both are met with as names in the literature, and it is enough to know what each attempted.
- Physical Quality of Life Index — a measure that combines indicators of health and literacy, chiefly life expectancy, infant mortality and the ability to read and write, into one figure. It deliberately leaves income out, on the view that living conditions should be judged on their own evidence.
- Basic Needs Index — a measure that asks whether the minimum requirements of a decent life are being met for the population, among them food, clothing, shelter, safe drinking water, sanitation, schooling and health care. It judges development by the coverage of these necessities rather than by average income.
Neither index is in wide use now. Their importance is that they established the approach: choose a small number of indicators that stand for the conditions of life, and combine them into a single comparable figure.
The measure that carried the approach furthest, and the one the syllabus requires in full, is the Human Development Index. It is taken up in the next section.
7.5 The Human Development Index
The most ambitious of the quality of life measures is the Human Development Index, prepared by the United Nations Development Programme, an agency of the United Nations. The UNDP computed it for the first time in 1990, in the first of its Human Development Reports, and has published it every year since. The index is the centrepiece of those reports, and it has been enlarged and refined over the years.
7.5.1 Meaning of Human Development
Before the index can be constructed, the idea it is meant to measure has to be settled. The proposition the Human Development Reports rest on is that the progress of a nation should be judged not only by its national income, as had long been the practice, but by what its people are actually able to do and to be.
Income remains crucial, but it is one choice among many. Education, health, a clean physical environment, freedom of movement and speech, equality between men and women, and a share in political and economic decisions are choices of the same importance. Human development is the process by which the range of these choices is widened.
The concept rests on five propositions.
- People are the centre of development — they are not merely instruments for producing commodities, and progress must be equitable and broad-based enough for them to take an active part in it.
- Human development is the end and economic growth only the means — growth is valued for what it enables people to do, not for itself.
- The purpose of development is to widen all choices — not the single choice that income represents.
- It covers every aspect of life — economic, social, cultural and political — and so embraces the whole of society and not the economy alone.
- It is universal in nature — it applies as much to a highly developed country as to a less developed one, since choices can be widened everywhere.
7.5.2 The Three Dimensions of Human Development
An index cannot cover every choice that matters. To keep it simple enough to compute for every country and to compare year after year, the UNDP settled on three basic dimensions of human development.
- A long and healthy life.
- The ability to acquire knowledge.
- A decent standard of living.
These three are chosen because they are the choices without which the others cannot be exercised at all. A person who dies young, who cannot read, or who lacks the means to live decently has few real choices whatever else is available.
7.5.3 The Indicators Chosen for Each Dimension
A dimension is an idea; an index needs a quantity. Each dimension is therefore represented by an indicator for which figures are collected on a comparable basis in every country.
- A long and healthy life is measured by life expectancy at birth — the number of years a newborn infant may be expected to live, given the death rates prevailing at the time.
- The ability to acquire knowledge is measured by two indicators taken together.
- Mean years of schooling — the average number of years of school education received by people aged 25 and above. This records the education a country has already accumulated.
- Expected years of schooling — the number of years of schooling a child entering school today may expect to receive. This records the education the country is currently providing.
- A decent standard of living is measured by gross national income per capita, adjusted for purchasing power parity and expressed in PPP US dollars.
The adjustment in the third indicator answers the difficulty raised in section 7.3.6. Converting a country’s income into dollars at the market exchange rate can mislead, because prices differ between countries and a dollar buys more in a low-income country than in a rich one. Purchasing power parity is a rate of conversion adjusted for the cost of buying the same basket of goods in different currencies, so that incomes converted at this rate stand for comparable quantities of goods. Dividing the adjusted gross national income by the population gives GNI per capita at PPP.
The dimensions and their indicators are brought together in Table 7.1.
7.5.4 Construction of the Human Development Index
The three indicators are measured in units that have nothing in common — years of life, years of schooling and PPP dollars. They cannot be added or averaged as they stand. The construction of the index therefore proceeds in three steps.
Step One: Normalising Each Indicator
For every indicator the UNDP fixes a minimum and a maximum value, called goalposts. Progress is then measured as the distance a country has travelled from the minimum towards the maximum.
\[\text{Index} = \dfrac{\text{Actual value} - \text{Minimum value}}{\text{Maximum value} - \text{Minimum value}}\]
Here the actual value is the country’s own figure for that indicator, and the minimum and maximum are the fixed goalposts for it — life expectancy, for instance, is measured against a minimum of 20 years and a maximum of 85. The result is a pure number with no unit, lying between 0 and 1, where 0 means the country is at the minimum and 1 that it has reached the maximum. For income the values are taken in logarithms before the formula is applied, because each additional rupee of income adds less to human development than the one before it.
Step Two: Forming the Three Dimension Indices
Applying that formula gives one index for each dimension.
- Life Expectancy Index — from life expectancy at birth.
- Education Index — from the two schooling indicators, each normalised separately and then averaged.
- Income Index — from GNI per capita at PPP.
Older accounts call these the Life Expectancy Index, the Education Attainment Index and the Adjusted GNI Index; the three quantities are the same.
Step Three: Combining the Indices
The three dimension indices are combined by taking their geometric mean.
\[HDI = \sqrt[3]{LEI \times EI \times II}\]
Here \(LEI\) is the Life Expectancy Index, \(EI\) the Education Index and \(II\) the Income Index, each a pure number between 0 and 1. The result is also a pure number between 0 and 1, read as the average achievement of the country across the three dimensions: the closer to 1, the higher the level of human development. Equal importance is given to all three dimensions.
The whole construction is set out in Fig. 7.1.
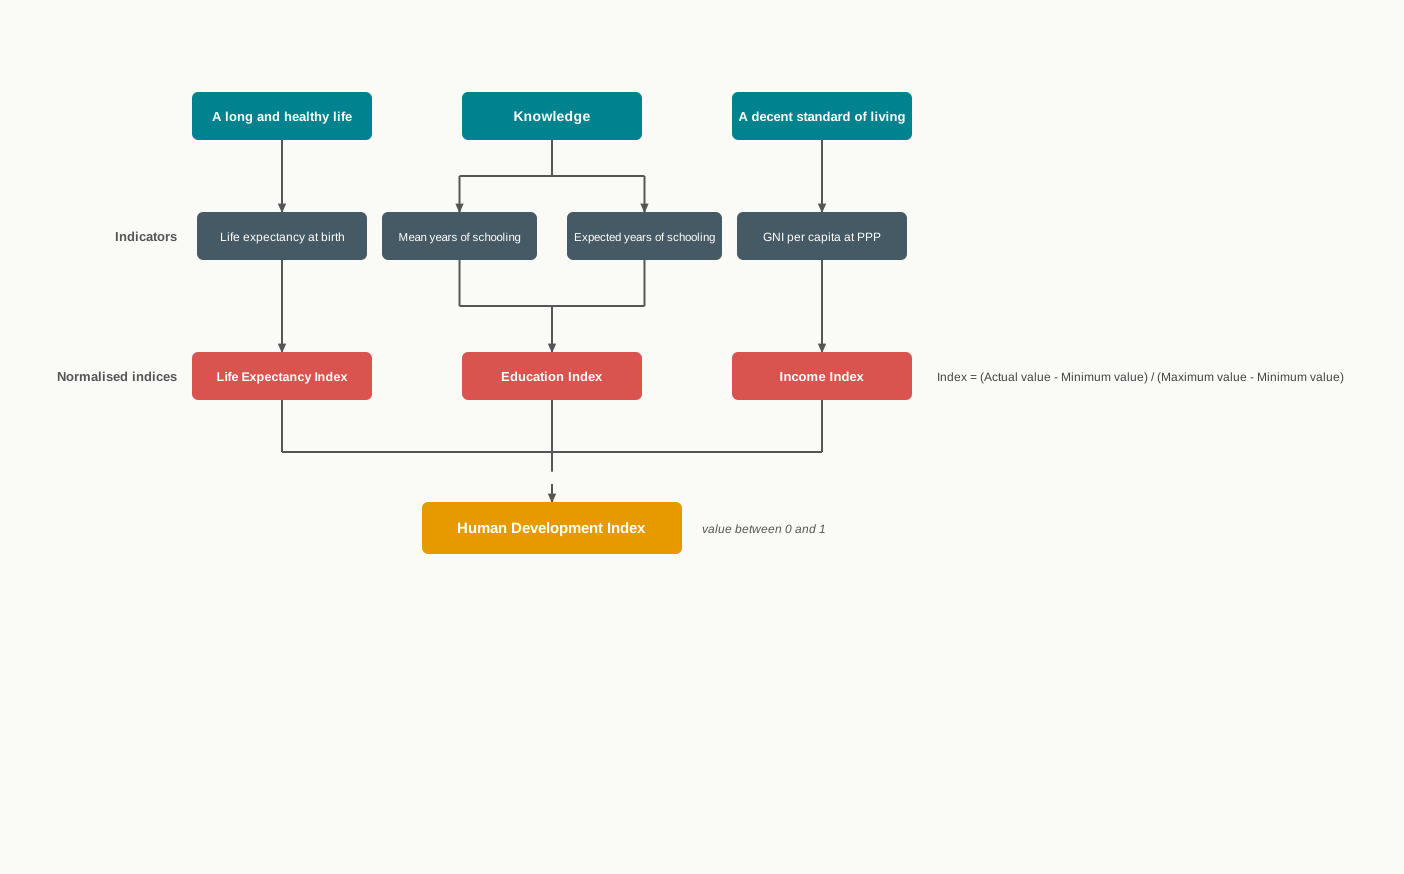
Fig. 7.1 – Construction of the Human Development Index.
7.5.5 Classification of Countries by Human Development
Because every country’s index lies on the same scale from 0 to 1, countries can be ranked by it and grouped. The UNDP places them in four groups, shown in Table 7.2.
Each annual report assigns every country for which the necessary data can be gathered to one of these four groups, and also gives it a rank. The countries in each group change from one report to the next as values are revised and as economies move up the scale. India’s own position among them is taken up in section 7.7.
7.6 Evaluation of the Human Development Index
The Human Development Index has changed the way development is discussed. It has also been criticised, and for reasons that follow directly from the way it is built. A parameter is best judged by both together.
7.6.1 Merits of the Human Development Index
Four merits are commonly claimed for the index.
- It combines economic and social indicators — income, health and education are brought into one figure, so the index is multidimensional where per capita income is not.
- It is a more comprehensive measure of development — it reports the performance of an economy across three dimensions rather than one, and so is a broader indicator of what an economy has achieved for its people.
- It has improved the understanding of development — by publishing values year after year on the same basis, it has made it possible to see which countries are really developing, as shown by a rise in their index over time, and which are only producing more.
- It directs policy to the ultimate objective — because the index breaks into three components, a government can see which component is holding its value down and direct its policies to health, to schooling or to incomes accordingly.
To these may be added its influence. The human development approach has been carried into more than 600 national and regional human development reports, and public officials, economists and social scientists now discuss development in terms of overall societal advancement rather than national income alone.
The advance the index represents over the income parameter is set out below.
7.6.2 Limitations of the Human Development Index
The index simplifies, and every limitation is the price of that simplification.
- It rests on three variables only — human development covers far more than health, schooling and income, and choices such as political freedom, human security and a clean environment are left out of the index altogether.
- It reports an average, not a distribution — two countries with the same value may differ greatly in how health, education and income are shared among their people, and the index does not show inequality or poverty.
- It was long confined to the national figure — in its early years the index was computed for the country as a whole and not broken up by region, gender, social class or ethnic group, so wide differences within a country went unrecorded.
- Its weighting is a judgement — the three dimensions are given equal importance, which is a reasonable choice but not one that can be demonstrated to be correct.
- It depends on the data available — the index can only be computed for countries able to supply the required estimates, and its accuracy is limited by the accuracy of those estimates.
7.6.3 Other Indices Published by the UNDP
Several of these limitations have been answered by constructing further indices alongside the main one. It is enough to know what each attempts.
- Inequality-adjusted Human Development Index — the index discounted for the inequality in each of the three dimensions, so that it falls below the ordinary value wherever achievement is unequally shared.
- Gender Development Index — the Human Development Index computed separately for women and for men, and expressed as the ratio between the two.
- Gender Inequality Index — a measure of the loss of achievement caused by inequality between men and women in health, empowerment and the labour market.
- Multidimensional Poverty Index — a measure of the proportion of people suffering deprivation in health, education and living standards at the same time, and of how severe those deprivations are. It replaced the earlier Human Poverty Index in 2010.
The UNDP has also begun disaggregating the national index by region, by social group and by gender, and taking additional dimensions of human development into account. The index in use today is therefore not the index of 1990; it has been refined steadily in response to the criticisms made of it.
7.7 India and the Human Development Index
The syllabus requires India’s position on the Human Development Index as given by the UNDP report. The figures used here are from the Human Development Report 2025, which is the latest edition and which reports values for the year 2023. Every figure below belongs to that edition and to that reference year.
7.7.1 India’s Human Development Index Over Time
India’s index has risen over the whole period for which it has been computed. Its value has increased by more than 53 per cent since 1990, a rate of improvement faster than both the world average and the South Asian average over the same years. The rise has come from economic growth together with sustained spending on health, schooling and social protection.
The rise has not been uninterrupted. The index fell during the years affected by the Covid-19 pandemic, in line with a global fall, because life expectancy dropped and schooling was disrupted. It recovered thereafter, and by 2023 India’s life expectancy stood at the highest level recorded since the index began.
Two features of the recent record deserve notice. India has remained in the medium human development group throughout, and its value in 2023 stood a little below the threshold of 0.700 that marks the high human development group. At the same time, the pace of improvement in human development has slowed worldwide since 2020, and India shares in that slowdown.
7.7.2 India’s Position Among Countries
In the Human Development Report 2025, India’s index value for 2023 was 0.685, placing it 130th among the 193 countries and territories covered. Within the same edition, its rank for 2022 was 133rd with a value of 0.676, so India rose three places between the two years.
India therefore stands in the medium human development group, ahead of some developing countries and behind others. Table 7.3 sets its position beside a selection of countries from the same report.
Three inferences follow. India’s value is far below that of the countries at the top of the table, which lie above 0.900. It is above that of Nepal and Pakistan, and level with Bangladesh. And it is below that of China and Sri Lanka, and of Bhutan, which was ranked 125th in the same report — countries whose economies are much smaller than India’s, which shows that a large national income does not by itself carry a country up the index.
7.7.3 Movement of the Component Indicators
Because the index breaks into components, the source of the improvement can be located. Table 7.4 gives India’s figures for the two most recent years covered by the Human Development Report 2025.
The gain between the two years came chiefly from mean years of schooling and from income per head, with a small improvement in life expectancy and expected years of schooling unchanged.
Over the longer period the movement is larger. Life expectancy at birth rose from 58.6 years in 1990 to 72.0 years in 2023, and gross national income per capita rose from about 2,167 to about 9,047 in 2021 PPP dollars over the same period. Expected years of schooling, which stood at a little over eight years in 1990, had reached about thirteen by 2023. All three dimensions have therefore improved, and the index has improved with them.
7.7.4 The Task Ahead for India
Improvement is not the same as sufficiency, and three gaps remain.
- The distance from the developed countries — India’s value of 0.685 for 2023 stands well below the values above 0.900 recorded by the countries at the top of the table, and the gap lies mainly in health and education rather than in income.
- Inequality — the Human Development Report 2025 estimates that adjusting India’s index for the inequality in its three dimensions reduces it by about 30.7 per cent, one of the largest such losses in the region. The average conceals wide differences between groups and between states.
- The position of women — female participation in the labour force and in political representation remains low, and both weigh on the index through the education and income dimensions and on the gender indices directly.
What these point to is the same conclusion the chapter began with. India’s national income has grown rapidly, but income is a means. Faster and wider spread of basic health care and schooling, and a more even sharing of what is already produced, are what will carry the index towards the high human development group.
7.8 Summary
- Development has to be measured because it is the objective around which policy is built. The measurable quantity used to indicate the level of development attained by an economy is called a parameter, or indicator, of development.
- Economic development is a multidimensional process, covering the level and distribution of income, the composition of output, and changes in social structure, attitudes and institutions. No single measurement can describe it completely, so every parameter in use is a partial one.
- Parameters fall into two families.
- Income-based measures, which treat income per head as the indicator. Per capita income is the measure of this kind in general use.
- Quality of life measures, which observe living conditions directly. The Physical Quality of Life Index, the Basic Needs Index and the Human Development Index are measures of this kind.
- Per capita income is the national income of a country divided by its population in a given year, and is read as the average income available per person per year.
\[\text{Per capita income} = \dfrac{\text{National income}}{\text{Population}}\]
- Nominal per capita income is computed at current prices and rises when prices rise even if output is unchanged. Real per capita income is computed at the prices of a fixed base year, and only the real figure is used as a parameter of development.
- Per capita income is used because it corrects for population growth, stands for command over goods and services, is a single quantified figure that can be compared across years and countries, and is estimated regularly by official agencies.
- The limitations of per capita income are seven.
- It ignores the composition of output.
- It ignores the distribution of income.
- It can rise while the number of people below the poverty line increases.
- It makes no allowance for cost elements such as longer working hours, depletion of natural resources and pollution.
- It excludes goods and services that do not pass through the market, chiefly unpaid work within the household.
- It creates problems in international comparison — conversion into a common currency at a changing exchange rate, differences in the concept of national income used, and differences in price levels between countries.
- It excludes the social, human and institutional dimensions of development.
- A quality of life index is a composite index combining several indicators of living conditions into one figure. The Physical Quality of Life Index, built from health and literacy indicators, and the Basic Needs Index, built from the coverage of minimum necessities, were the early measures of this kind.
- Human development is the process of widening people’s choices and raising the level of well-being they achieve. It treats people as the centre of development, makes economic growth a means and not an end, covers economic, social, cultural and political choices, and applies to developed and developing countries alike.
- The Human Development Index, prepared by the UNDP since 1990, measures the average achievement of a country in three basic dimensions.
- A long and healthy life, measured by life expectancy at birth.
- Knowledge, measured by mean years of schooling and expected years of schooling.
- A decent standard of living, measured by GNI per capita adjusted for purchasing power parity.
- Each indicator is normalised against fixed minimum and maximum values, so that every dimension is reduced to a pure number between 0 and 1.
\[\text{Index} = \dfrac{\text{Actual value} - \text{Minimum value}}{\text{Maximum value} - \text{Minimum value}}\]
- The three dimension indices so obtained are combined by taking their geometric mean.
\[HDI = \sqrt[3]{LEI \times EI \times II}\]
Here \(LEI\) is the Life Expectancy Index, \(EI\) the Education Index and \(II\) the Income Index, each a pure number between 0 and 1. The Human Development Index is also a pure number between 0 and 1, and the closer it is to 1 the higher the level of human development.
- The UNDP places countries in four groups by their index value — very high human development at 0.800 and above, high from 0.700 to 0.799, medium from 0.550 to 0.699, and low below 0.550.
- The merits of the index are that it combines economic and social indicators, that it is a more comprehensive measure of development than per capita income, that it has improved the understanding of what development consists of, and that it directs policy to the component that is lagging.
- Its limitations are that it rests on three variables only, that it reports an average and not a distribution, that it was long confined to the national figure, that its equal weighting of the three dimensions is a judgement, and that it depends on the data countries are able to supply.
- The UNDP now publishes further indices to cover these gaps, among them the Inequality-adjusted Human Development Index, the Gender Development Index, the Gender Inequality Index and the Multidimensional Poverty Index.
- In the Human Development Report 2025, India’s index value for 2023 was 0.685, ranking it 130th of 193 countries and placing it in the medium human development group, a little below the threshold of 0.700.
- India’s value has risen by more than 53 per cent since 1990, with life expectancy at birth rising from 58.6 years in 1990 to 72.0 years in 2023, and gross national income per capita rising over the same period. Adjusting the index for inequality reduces it by about 30.7 per cent, which is where the task ahead chiefly lies.
7.9 Points to Ponder
- If the unpaid work done within households were valued and added to national income, per capita income would rise sharply without a single extra meal being cooked or a single extra child being cared for. Would the larger figure be a better parameter of development, or only a larger one?
- The Human Development Index gives equal importance to health, knowledge and the standard of living. Would a very poor country be right to weight income more heavily, on the ground that income is what buys the other two? And who should decide the weights — the country itself, or the agency that publishes the index for all countries?
- An economy can raise its output by exhausting its groundwater, its forests and its minerals. If the value of what was used up were deducted from national income, some of the fastest-growing economies would show much smaller gains. Should a parameter of development be required to subtract what development consumes?
- India and Bangladesh stood at the same rank in the Human Development Report 2025 although India’s economy is many times the larger. What does this tell you about the relation between the size of an economy and the lives of the people living in it?
- Adjusting India’s index for inequality reduces it by roughly three-tenths. Suppose the inequality-adjusted figure were reported as the headline value instead of the ordinary one. Which policies would a government be pushed towards, and which would it be pushed away from?
- Every edition of the Human Development Report recalculates the whole series, so a country’s value for a past year is restated each time. Does a parameter whose history keeps changing still allow us to say with confidence that development has taken place?
7.10 Objective Questions
- The Human Development Index is arrived at by taking the: [1]
- simple average of the three dimension indices
- geometric mean of the three dimension indices
- sum of the three dimension indices
- highest of the three dimension indices
- Assertion (A): A rise in per capita income does not by itself prove that economic welfare has improved. Reason (R): Per capita income is an average and carries no information about how income is distributed. Choose the correct option. [1]
- Both A and R are true, and R is the correct explanation of A.
- Both A and R are true, but R is not the correct explanation of A.
- A is true but R is false.
- A is false but R is true.
- Fill in the blank: Per capita income is obtained by dividing the national income of a country by its ______. [1]
- Match the indicator in Column A with the dimension of human development it represents in Column B. [1]
| Column A | Column B |
|---|---|
| a. Life expectancy at birth | i. Knowledge |
| b. Expected years of schooling | ii. A decent standard of living |
| c. GNI per capita at PPP | iii. A long and healthy life |
- State whether the following statement is true or false, with a reason: A rise in nominal per capita income always shows that more goods and services are available per person. [1]
7.11 Check Your Concepts
- Define per capita income and state why the real figure, and not the nominal figure, is used as a parameter of development. [2]
- Distinguish between income-based measures and quality of life measures of development on any three bases. [3]
- Explain, with an example of each, any four limitations of per capita income as a parameter of economic development. [4]
- Explain the construction of the Human Development Index, naming its three dimensions and the indicators used for each, and state two merits and two limitations of the index. [6]
7.12 Case-Based Question
- The district of Meghpur has a large cement works and a mine, and its income per head is the highest in its state. Its neighbour Ratanwadi has neither, and its income per head is barely half as much. A survey finds, however, that children in Ratanwadi stay in school about three years longer on average, that its people live some six years longer than those in Meghpur, and that the air and water around the Meghpur works have deteriorated over the past decade.
- Which of the limitations of per capita income does the comparison between the two districts illustrate? Name two and explain each in a sentence. [2]
- If the Human Development Index were computed for the two districts, which would you expect to score higher, and why? [2]
7.3.7 Social and Institutional Dimensions Are Excluded
The last limitation is the broadest. Development, as defined at the start of the chapter, includes changes in social structure, in institutions and in the opportunities open to people. Per capita income measures none of them.
Literacy, the state of public health, the position of women, access to justice and the freedom to take part in decisions are all dimensions of development, and an economy may be doing badly on every one of them while its income per head rises steadily. On this evidence the figure ignores the human, social and institutional side of development altogether.
For a question on the limitations of per capita income, name the limitation first and then explain it in one sentence. A bare list of headings earns half the marks at most.
Taken together, these limitations show that real per capita income cannot be treated as a perfect parameter of economic development. It remains a useful one — conventionally the main one — but it has since the 1970s been supplemented by additional indicators, such as measures of inequality and of poverty, intended to cover what it leaves out. The search for those additional indicators is the subject of the next section.