Chapter 12: The Problem of Poverty in India
A family of five in a village spends about ₹4,000 a month on everything it needs — food, fuel, clothing, medicines, travel. Divided among five people, that is ₹800 for each person for the month. Whether such a household counts as poor is not a matter of opinion. It depends on where a line has been drawn, on what that line is meant to buy, and on who drew it.
That is where the economics of poverty begins. Scarcity is the condition of every economy, but poverty is scarcity that has settled on particular households and refuses to move. It has to be defined before it can be measured, measured before it can be traced over time, and understood in its causes before it can be attacked. Each of those steps has been contested in India for seventy years.
This chapter explains what poverty means in its absolute and relative senses, how the poverty line is fixed and the poor counted, how large and how uneven poverty in India has been, why it persists, and how effective the government’s measures against it have proved.
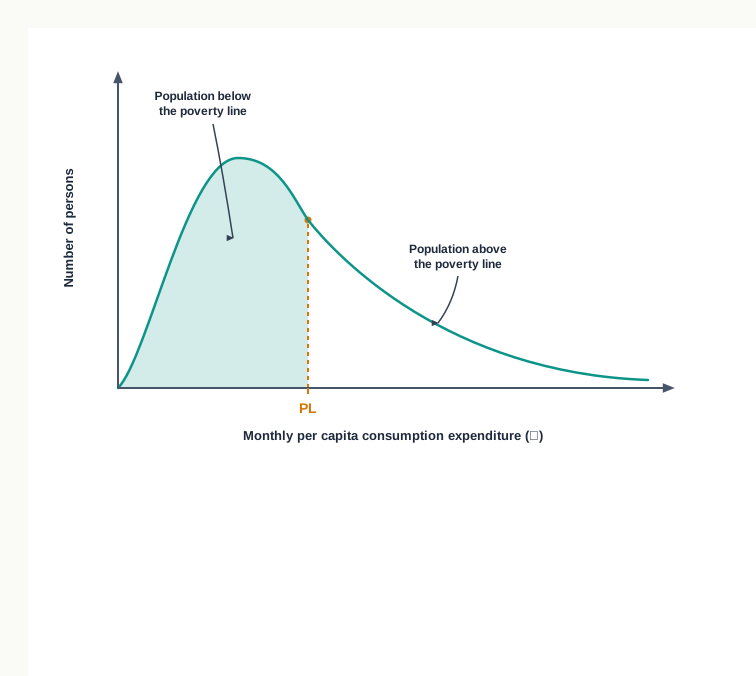
Fig. 12.0 – The poverty line and the population below it.
12.1 Poverty as an Economic Problem
Scarcity is the condition of every economy: wants exceed the means of satisfying them, and choices have to be made. Poverty is something narrower and harsher. It is the condition of households whose means fall short not of everything they might want, but of the little they must have in order to live tolerably.
An economy that wishes to act against poverty must first answer a question of measurement. Who is to count as poor? Unless that question is settled, the size of the problem cannot be stated, progress cannot be traced from one decade to the next, and no scheme can be judged to have worked or failed. The whole of this chapter rests on the definitions set out in this section.
12.1.1 What Poverty Means
Poverty is commonly understood as the inability to obtain the basic necessities of life. A poor household cannot command enough food to keep its members properly nourished, enough clothing and shelter to keep them protected, or enough medicine and schooling to keep them healthy and literate.
But deprivation of goods is only part of it. Poverty is multidimensional in the sense that it also denies opportunities — the opportunity to lead a long and healthy life, to be educated, to enjoy dignity, freedom and self-respect, and to take part in the ordinary life of the community. A person may be fed and still be shut out of everything else the society offers.
Economics deals with this wider condition by separating the part of it that money can measure from the part that it cannot.
12.1.2 Income Poverty and Human Poverty
The United Nations Development Programme distinguishes two senses of the term. The first, income poverty, is the lack of the basic necessities of material well-being — food, clothing, housing and the other goods a household must be able to buy.
The second, human poverty, is the denial of the opportunity to live a tolerable life. It is measured not by what a household spends but by how its members fare in education, nutrition, health, sanitation and living conditions. A malnourished and illiterate person living without electricity or clean water is poor in this sense whatever the household’s income may be.
The two overlap heavily but are not the same, and each requires its own instruments of measurement. Income poverty is measured by comparing consumption expenditure against a fixed line, the method taken up in §12.2. Human poverty is measured by composite indices built from several indicators at once, which §12.3 examines. In India the official measure has been an income measure, and it is in the sense of income poverty that this chapter mainly proceeds.
12.1.3 Absolute Poverty
Income poverty itself can be understood in two senses, and the difference between them decides who gets counted.
Absolute poverty takes a fixed minimum standard of living and asks whether a household reaches it. That minimum is defined in physical terms — the food, clothing, housing, healthcare and education a person must have — and is then expressed as the income or consumption expenditure needed to buy them. Anyone falling short is poor, however rich or poor the rest of the society happens to be.
The standard is absolute because it does not move when incomes elsewhere in the economy move. If every household’s income doubled and the minimum needs stayed as they are, absolute poverty would fall sharply. This is what makes the measure useful for tracking progress: it can, in principle, reach zero.
12.1.4 Relative Poverty
Relative poverty asks a different question. It compares a household not against a fixed minimum but against the rest of the society. A household is relatively poor when the income available for its consumption expenditure lies distinctly below the average income of the society it belongs to.
Measured this way, poverty is a statement about the distribution of income rather than about physical want. A household is often said to be relatively poor if it falls in a bottom income group — the poorest ten per cent, for instance. Because some group must always occupy the bottom, relative poverty in this form cannot be eliminated; it can only be reduced by narrowing the gaps between groups.
Both senses matter, but they answer to different policies. Absolute poverty calls for raising the incomes and entitlements of those at the bottom. Relative poverty calls for changing how income is distributed across the whole society.
12.1.5 Difference Between Absolute and Relative Poverty
A person is absolutely poor if income falls below the minimum level fixed for subsistence, and relatively poor if income places the household near the bottom of the distribution. The two ideas are compared below.
India has always taken poverty in the absolute sense. The official measure asks whether a household can meet a fixed minimum of consumption, not where it stands relative to its neighbours, and every estimate discussed in this chapter rests on that choice.
12.2 The Poverty Line in India
Once poverty is taken in the absolute sense, a minimum has to be fixed. The economy needs a figure below which a household is declared poor and above which it is not, and that figure has to be defensible, measurable and capable of being brought up to date as prices change.
The instrument India uses for this is the poverty line. It is not a statement about what a decent life costs. It is a statement about the least a person must be able to spend to stay alive and working, and the whole official count of the poor turns on it.
12.2.1 Poverty Defined in Terms of Food Security
Before 2005, the official measure of poverty in India rested primarily on food security. A person was regarded as poor if he failed to earn an income sufficient to buy the bare means of subsistence — the minimum physical quantities of cereals, pulses, milk and similar items needed to keep the body nourished.
This is why the Indian poverty line has been described as a line drawn largely in terms of food poverty. The reasoning is straightforward: in a poor economy, the overwhelming share of a poor household’s spending goes on food, so the cost of a minimum food basket comes close to the cost of survival itself.
12.2.2 Determination of the Poverty Line
The line is arrived at in a definite sequence of steps, each of which converts a physical requirement into a money figure.
- Fixing the nutritional norm — the minimum level of food energy needed for subsistence is expressed as a daily intake of calories. The Planning Commission fixed this at 2,400 calories per person per day for rural areas and 2,100 calories for urban areas, the rural figure being higher because rural work involves more physical exertion.
- Pricing the consumption basket — the cost of purchasing the quantity of foodgrains and other items that would supply this calorie intake is estimated, using price indices worked out separately for rural areas and urban areas. This gives the per capita consumption expenditure needed to secure the minimum calorie intake.
- Setting the line — the poverty line is set at that level of consumption expenditure per person. It covers the food requirement and a few selected non-food items such as clothing, but it does not provide for healthcare, shelter or education on any adequate scale.
- Updating for prices — because the money cost of the same physical basket rises as prices rise, the line is revised over time with the help of a price deflator such as the consumer price index. Without this adjustment, comparisons of poverty across years would confuse a rise in prices with a rise in deprivation.
Two sets of official lines have been used. Those recommended by Prof. D.T. Lakdawala rested directly on the calorie anchor. Since 2005 the government has followed the methodology of the Expert Group under Prof. Suresh D. Tendulkar, which measures poverty against a wider basket of goods rather than calories alone. The Tendulkar lines for two years are given in Table 12.1.
The urban line is the higher of the two in both years because the same basket of goods costs more in towns and cities than in villages. A household is therefore judged against the line drawn for the area in which it lives, not against a single all-India figure.
12.2.3 The Headcount Ratio
Having fixed the line, the extent of poverty is measured by counting. All persons whose per capita consumption expenditure falls below the poverty line are said to be below the poverty line, commonly abbreviated as BPL, and are identified as poor.
The figure so obtained is also called the poverty ratio, and it is the number quoted whenever the incidence of poverty in India is reported. It tells us how widespread poverty is at a given moment and, when compared across years, whether the proportion of the poor is rising or falling.
12.2.4 Limitations of the Poverty Line Approach
The line is a workable instrument, but it buys its simplicity at a price, and the limitations are worth stating plainly.
- It ignores depth — the headcount ratio counts how many people are below the line but says nothing about how far below they are. A household just short of the line and a household in destitution are recorded identically.
- It ignores severity — because it registers nothing beyond the count, it does not reveal a worsening in the condition of those who are already poor. Their circumstances may deteriorate without the poverty ratio moving at all.
- It is anchored in food — the minimum is built around calorie requirements and a few select items. It makes no adequate provision for clothing, healthcare, shelter or education, so a person judged to be above the line may still be unable to meet those needs.
- It measures one dimension only — income and consumption capture material want but not the denial of opportunity. Poverty in real life is multidimensional, and a single money line cannot register that.
- It depends on the price deflator chosen — the line is carried forward from year to year by adjusting for price change, so the estimate of poverty is only as reliable as the price index used to update it.
The last official estimate of income poverty in India was made for the year 2011–12. No official income poverty estimate has been released since, which is one reason later assessments of poverty in India have leaned increasingly on multidimensional measures.
12.3 The Magnitude of Poverty in India
With a line fixed and a method of counting settled, the size of the problem can be stated. Several economists and official bodies have estimated poverty in India, and their figures differ — not because the poor were counted carelessly, but because the methodology used to draw the line differed from one estimate to the next.
Two things have to be read from any estimate: the proportion of the population that is poor, and the absolute number of poor persons. The two need not move together, because a falling proportion of a growing population can leave the number of poor almost unchanged.
12.3.1 Estimates of Income Poverty
Early estimates, covering the period from 1951 to the mid-1970s, dealt largely with rural poverty and gave contradictory results. Since the mid-1970s the estimates have been more comprehensive and more reliable, the Planning Commission having estimated the incidence of poverty for rural and urban areas and for the states since the Sixth Five-Year Plan, using the sample surveys of household consumer expenditure conducted by the National Sample Survey Organisation.
The estimates prepared on the methodology recommended by Prof. D.T. Lakdawala are given in Table 12.2.
Two things stand out. The poverty ratio fell steadily over three decades, roughly halving between 1973–74 and 2004–05, and the decline coincided with the period of rapid economic growth. Yet the absolute number of poor stayed at around 320 million until 1993–94, because population growth added new people at nearly the rate at which poverty was being reduced.
The methodology was then reviewed. The Expert Group under the chairmanship of Prof. Suresh D. Tendulkar gave a new method, adopted by the government from 2005, which measures poverty against a basket of goods rather than against the calorie norm alone. The estimates for 1993–94 and 2004–05 were recomputed on this basis and came out higher than the original official figures. The Tendulkar estimates are given in Table 12.3.
Between 2004–05 and 2011–12 the all-India poverty ratio fell by about 15 percentage points, an average of a little over two percentage points a year, and the number of poor fell by about 138 million. The rural ratio fell by some 16 percentage points and the urban ratio by about 12. The fall in these years is attributed to higher GDP growth, a high growth rate in agriculture, large employment generation in construction, and a rise in real wages and incomes in rural areas.
Two features of the position in 2011–12 deserve notice. The rural poverty ratio remained well above the urban one, a gap explained by lower farm incomes and by higher underemployment and unemployment in the countryside. And with 269 million persons below the line, roughly a fifth of the population, poverty remained quantitatively a very large problem however sharply the ratio had fallen. The movement of the ratio over these two years is shown in Fig. 12.1.
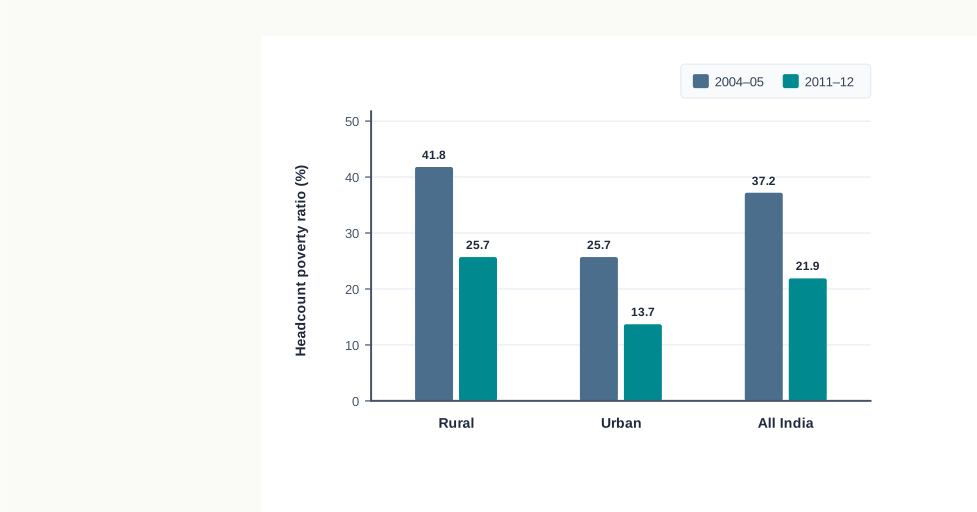
Fig. 12.1 – Headcount income poverty on the Tendulkar methodology.
The last official estimate of income poverty was made for 2011–12, and no official estimate of income poverty has been released since. Assessments of poverty in India after that year therefore rest mainly on multidimensional measures.
12.3.2 Multidimensional Poverty in India
Poverty is not only a matter of low income. A household may cross the expenditure line and still live without sanitation, clean drinking water, electricity or schooling, and a measure confined to money will not see any of this.
Multidimensional poverty looks beyond income. It counts a household as poor when it is deprived on enough indicators drawn from several dimensions of living at once — health, education and standard of living. The United Nations Development Programme publishes a global multidimensional poverty index built on ten such indicators across these three dimensions.
NITI Aayog has constructed a national multidimensional poverty index for India on twelve indicators grouped under the same three dimensions, including nutrition, child and adolescent mortality, years of schooling, school attendance, cooking fuel, sanitation, drinking water, electricity, housing and assets. It follows the global index in method while adding indicators suited to Indian conditions.
The national index estimated multidimensional poverty at about 25 per cent of the population in 2015–16, with a sharp rural-urban gap: about 33 per cent in rural areas against about 9 per cent in urban areas. By 2019–21 the national figure had fallen to about 15 per cent. NITI Aayog has estimated a further fall to about 11 per cent by 2022–23, with rural deprivation still running at roughly three times the urban level.
Multidimensional poverty has therefore declined in both rural and urban areas, and has declined faster than income poverty over the same period. But the disparity between the two sectors persists, and it persists in much the same direction as the income estimates showed: the countryside remains the harder problem.
12.4 Nature and Extent of Poverty in India
The estimates tell us how many the poor are. They do not tell us who the poor are, where they live, or what keeps them poor. A national ratio is an average, and averages conceal exactly the differences that policy has to act on.
Read together, the various estimates support four observations about poverty in India: it has declined substantially, it remains very large, it is distributed most unevenly across the states, and it takes a different form in the countryside from the form it takes in the cities.
12.4.1 The Downward Trend
The first observation is that the proportion of the population living in poverty has fallen significantly and over a long period. On the Lakdawala series the poverty ratio fell from about 55 per cent in 1973–74 to about 28 per cent in 2004–05. On the Tendulkar series it fell from about 37 per cent in 2004–05 to about 22 per cent in 2011–12.
Multidimensional poverty has followed the same downward path, falling from about a quarter of the population in 2015–16 to a substantially lower figure by the early 2020s. Both measures, drawn on different principles, point the same way.
For a country that began its planning with a majority of its people in poverty, this is a substantial achievement. It is also the reason poverty in India is now discussed as a shrinking problem rather than a permanent condition.
12.4.2 A Lingering Problem
The second observation cuts against the first. A falling ratio applied to a large and growing population still leaves an enormous number of people below the line. In 2011–12 some 269 million persons, about a fifth of the population, were in the BPL category.
Poverty in India is therefore quantitatively a very big problem even where it is proportionately a receding one. A share that would count as modest in a small country describes, in India, a poor population larger than that of most nations.
12.4.3 Interstate Variations
The third observation is that poverty is not spread evenly across the country. The poverty ratio has been high in states such as Bihar, Chhattisgarh, Jharkhand, Madhya Pradesh, Odisha, Uttar Pradesh, Assam and Arunachal Pradesh, and a large share of the country’s poor is concentrated in this group.
Against this, the ratio has been low in Kerala, Goa, Punjab, Haryana, Himachal Pradesh, Tamil Nadu, Gujarat, Maharashtra and Andhra Pradesh. On the 2011–12 estimates the highest state poverty ratio was recorded in Chhattisgarh and the lowest in Goa and Kerala. The multidimensional estimates for 2019–21 show a similar pattern, with the deepest deprivation in Bihar, Jharkhand, Uttar Pradesh and Meghalaya.
States that reduced poverty rapidly in the course of their economic development have pulled steadily away from those that did not. Because reduction has proceeded at very different speeds, interstate inequality has widened even as national poverty has fallen — a national success containing a regional failure.
12.4.4 The Rural Poor
The fourth observation concerns the composition of the poor, which differs sharply between the two sectors.
In rural areas the poor consist mainly of landless agricultural labourers, small and marginal farmers, rural artisans, and households belonging to the scheduled castes and scheduled tribes. Poverty here overlaps heavily with social position: those who are poor in income terms belong largely to the weaker sections, hold a lower social status and are subject to social exploitation.
The characteristic economic problem of the rural poor is not open unemployment. Work is usually available, but it is work of very low productivity — seasonal, poorly equipped and thinly paid — so that a household may be fully occupied through the year and still earn too little to cross the line.
12.4.5 The Urban Poor
In urban areas the poor are mainly the unemployed and the underemployed, together with those engaged in low-productivity occupations such as street peddling and rickshaw pulling, or in low-paid jobs in the unorganised manufacturing and service sectors. Many are self-employed in a small way. They live largely in slums and on pavements in the bigger cities.
Urban poverty is in an important sense an extension of rural poverty. People without work in the villages migrate to the towns and metropolitan cities in search of jobs, and on arrival swell the ranks of low-paid workers already there. The poverty is not created in the city; it is relocated to it.
The differences between the two sectors are set out below.
12.5 The Vicious Circle of Poverty
The estimates describe poverty; they do not explain why it persists. Development economists studying the poorer countries noticed something more troubling than mere low income: the conditions that produce poverty are themselves produced by poverty. Low productivity, low incomes and low levels of living reinforce one another and hold the economy where it is.
This idea was set out by Gunnar Myrdal in his theory of circular and cumulative causation, and given its familiar form by Ragnar Nurkse as the vicious circle of poverty. It explains poverty not as a shortage of any one thing but as a self-sustaining arrangement of several.
12.5.1 Meaning of the Vicious Circle of Poverty
Take the case of a poor man. Having too little income, he cannot eat enough; being underfed, his health is weak; with weak health, his capacity to work and earn is low; earning little, he remains poor — and being poor, he again cannot eat enough. The chain has returned to where it started.
Two features of this chain matter. It is circular, because each negative factor produces another which eventually reproduces the first, so that every factor is both cause and effect. And it is cumulative, because at each turn the person’s economic position sinks a little lower rather than merely holding steady.
Applied to a whole economy, the argument yields a proposition that sounds like a paradox and is not: ‘A country is poor because it is poor.’ Its poverty is itself among the major obstacles to its development. Because it is poor it does not develop, and because it does not develop it stays poor.
Three such circles are commonly distinguished, running through the supply side of capital formation, the demand side, and the resources of the country.
12.5.2 The Circle on the Supply Side of Capital Formation
The first circle operates through saving. In an underdeveloped country total output is low, because underdevelopment brings low productivity with it, and low productivity is reflected in low real income.
At a low level of income, the bulk of what is earned must go on meeting consumption needs, so both the capacity and the willingness to save are small. Low income therefore results in low savings, low savings permit only a low level of investment, and low investment leaves the economy deficient in capital.
Capital deficiency then closes the circle. With too little capital to work with, productivity stays low, income stays low, and the whole sequence begins again. Underdevelopment is here explained by capital deficiency, which acts both as a cause and as a consequence of the low level of income. The circle is shown in Fig. 12.2.
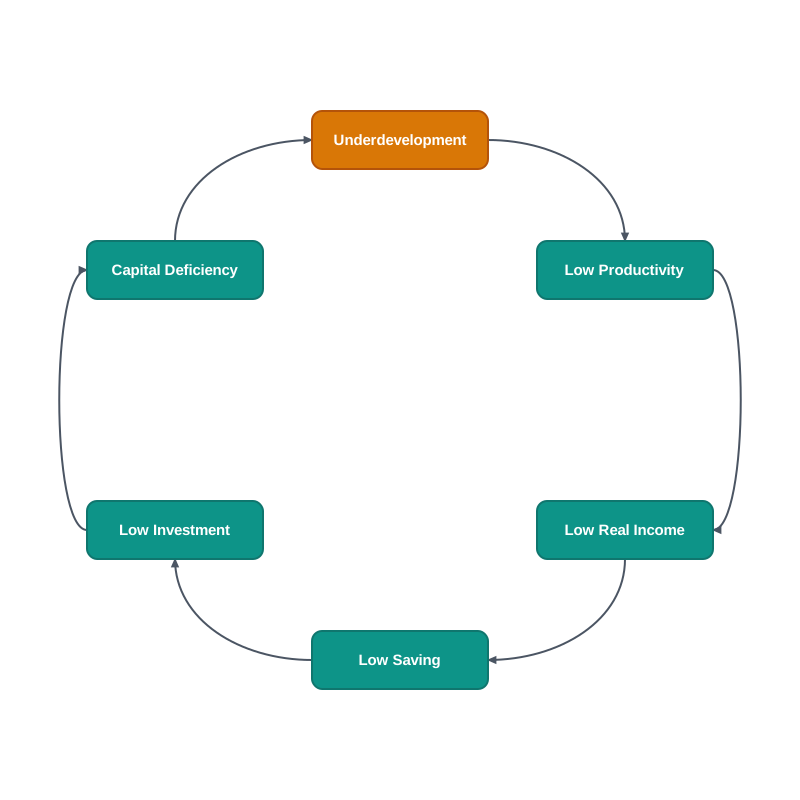
Fig. 12.2 – Vicious circle on the supply side of capital formation.
12.5.3 The Circle on the Demand Side of Capital Formation
The second circle operates through the size of the market. Low productivity associated with capital deficiency again leads to low income, but the consequence traced this time is different.
A low level of income in the economy means small buying power among the people, and small buying power offers only a limited market to entrepreneurs. Since the inducement to invest depends on the size of the market, a small market means a weak inducement to invest.
Investment is therefore low, capital remains deficient, productivity stays low and income stays low. The circle closes exactly as before, but through demand rather than through saving. It is shown in Fig. 12.3.
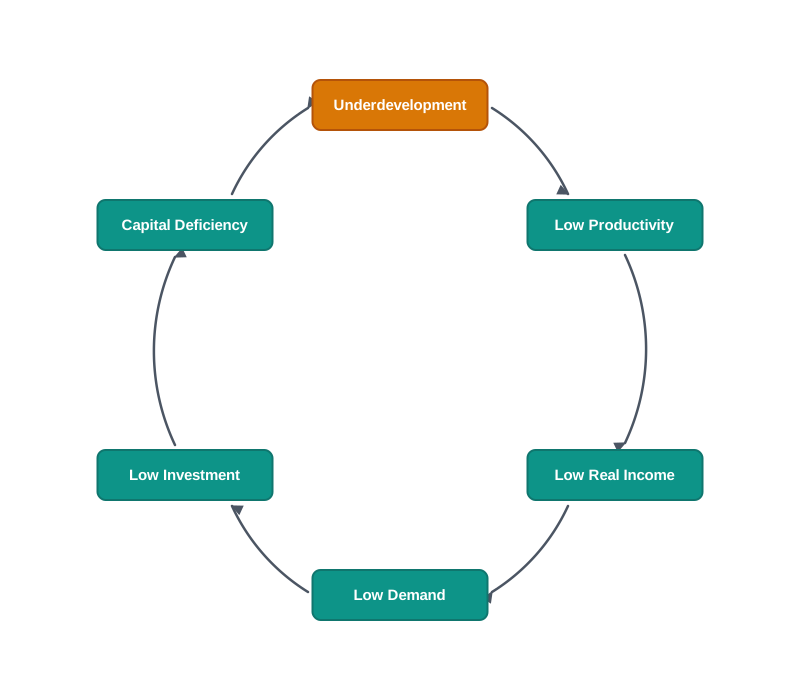
Fig. 12.3 – Vicious circle on the demand side of capital formation.
Taken together, the two circles show that the vicious circle operates from both sides of capital formation. Capital deficiency, low productivity and low income are common to both. Capital deficiency lies at the root, but the obstacle arises from low income, which produces both low saving and a weak inducement to invest. In this sense poverty is the cause of poverty.
12.5.4 Underdeveloped Human and Natural Resources
The third circle runs between people and resources. The development of a country’s natural resources depends on the productive capacity of its human resources.
In underdeveloped countries natural resources remain unutilised or underutilised because the people are economically backward and often illiterate, and lack the technical skill and knowledge needed to work them. Economically backward people thus lead to underdeveloped natural resources.
The relation runs the other way as well. People are economically backward in part because the natural resources around them remain undeveloped and offer them no productive employment. Underdeveloped resources are therefore both a consequence and a cause of the backwardness of the people, as Fig. 12.4 shows.
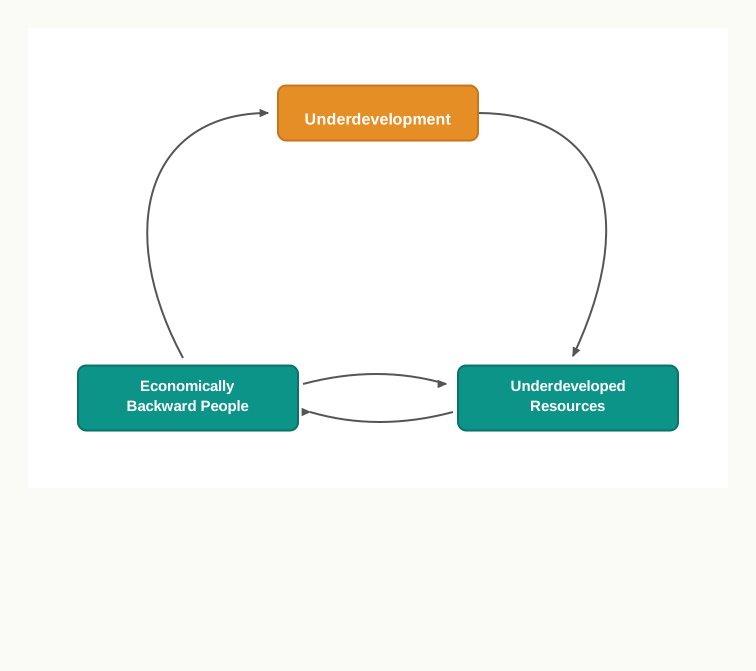
Fig. 12.4 – Vicious circle of underdeveloped human and natural resources.
12.5.5 Breaking the Circle
If poverty is circular, it cannot be ended by acting on any single point of the circle and leaving the rest alone. This is the practical lesson of the whole analysis, and it shapes everything in the sections that follow.
The circle can be broken at any of several links, but the effort must be large enough and sustained enough to carry the economy past the point where the old relations reassert themselves. Raising productivity through better techniques and equipment, adding to capital from sources outside the domestic saving pool, and above all developing human resources through education, health and skill, are the routes usually proposed.
12.6 Causes of Poverty in India
Given the magnitude of poverty in India and the seriousness of its consequences, the factors responsible for it have to be identified before any policy against it can be framed. Those factors are of diverse kinds, ranging from economic causes to socio-cultural, political and administrative ones.
They also work upon one another. Each cause examined below feeds at least one other, which is why the vicious circle described in §12.5 is not an abstraction but a description of how these causes are related.
12.6.1 Rapid Population Growth Among the Poor
A high rate of population growth in India, and particularly among the poor, is among the important causes of poverty. Population growth is high among poor households because of illiteracy, traditional attitudes, limited practice of family planning and a preference for the male child.
The consequence is arithmetical. With employment at a low level and families large, income per head of the population stays low and falls short of even the basic minimum needs. More income is being shared among more members of the household, so per capita income and per capita consumption improve little even when total household earnings rise.
The relation runs both ways. It is the poverty of the people that leads to a high growth rate of population among the poor, and rapid population growth in turn leads back to poverty. The poor are caught here in a vicious circle of their own.
12.6.2 Low Rate of Economic Growth
For much of the planning period the rate of economic growth in India remained below the level required. Growth in the first three decades after 1951 averaged only about three and a half per cent a year, and rose appreciably only from the 1980s onwards.
Against a population growing steadily through those years, a modest rate of output growth could not bring about a substantial improvement in the living standard of the masses. A large part of the increase in income was absorbed simply in feeding a larger population, and employment opportunities expanded slowly because the economy itself was expanding slowly.
Here too the relation is circular. A low rate of growth produces a low standard of living and a high level of unemployment; a low standard of living produces low efficiency, low savings and low investment, which hold the rate of growth down.
12.6.3 Unemployment and Underemployment
A high level of unemployment and underemployment, particularly in rural areas, accounts directly for a large part of the incidence of poverty. Job seekers have been increasing faster than employment opportunities, so the volume of unemployment has grown.
The causes of that unemployment are themselves familiar: a high growth rate of population, a low rate of economic growth, development strategies during the Plans that gave greater emphasis to capital-intensive projects, and slow generation of employment in agriculture. Efforts to promote small and cottage industries have not been sufficient to absorb the backlog of unemployment together with the additional labour force each year.
Unemployment causes lower output and therefore lower income, and it is in this straightforward sense that it makes the problem of poverty more acute.
12.6.4 The Growth Strategy and Inequalities of Income
The development strategy pursued in the Plans was not designed to fight poverty directly, and on one reading it kept the poor outside the development process altogether. Two features of that strategy are particularly relevant.
- Emphasis on capital goods industries — for many years the Plans concentrated on developing heavy and capital goods industries. This added to poverty by slowing the growth of employment and by holding down the growth in the availability of consumer goods.
- A rural strategy favouring the larger farmer — growth strategy in agriculture favoured landlords and substantial farmers, whose holdings and access to inputs allowed them to take up new techniques. The interest of the great mass of small cultivators was sacrificed in the process.
Inequality And The Reach Of Growth
Large inequalities of income exist in both rural and urban areas, and they are the reason a rising average leaves the poor where they are. Part of the increased income generated during the Plans has been captured by the richer sections, and, more fundamentally, the ownership of assets — land in the villages, property and capital in the towns — is very unequally distributed. Where inequality in income and assets is this wide, even a substantial rise in per capita income need not reach the poor.
This is why the benefits of growth did not percolate down as expected. Early planners had assumed that growth would itself take care of inequality and poverty by generating employment, so little was done to strengthen the poor by transferring income-earning assets to them. Very little surplus land, for instance, was actually distributed among poor farmers under the policy of land ceiling.
A steep and continuous rise in prices, particularly of essential commodities, has worked in the same direction. Inflation reduces the real income of those on fixed and low incomes, and with it their purchasing power and their standard of living.
To this must be added the inadequacy of the anti-poverty measures themselves, many of which have been implemented half-heartedly or confined to particular areas and groups. Their performance is assessed in §12.9.
12.6.5 Backwardness of Agriculture
Agriculture in India has continued to be backward, relying on primitive and less efficient techniques of production and suffering from an inadequate supply of water, fertilisers, pesticides and high-yielding varieties of seed.
The result is that both labour productivity and land productivity remain low. Since the majority of the working population depends on agriculture, low productivity in that sector translates directly into widespread rural poverty.
Unequal distribution of landholdings compounds this. Where land reforms have failed to redistribute holdings, a large number of cultivators work plots too small to support a household, and the landless work for wages fixed by the abundance of labour.
12.6.6 Low Level of Education
A low level of education among the poor is another major cause. Poor people are illiterate or only partly educated, and can therefore take up only low-paid work, which explains the low levels of income among them.
The effect carries across generations. Poor parents cannot afford to give their children higher education, so the children in turn enter the same low-paid occupations, and low incomes are perpetuated over the years.
12.6.7 Socio-cultural and Political Factors
The social structure of the country has itself contributed to the persistence of poverty. The ranks of the poor are drawn heavily from low caste and tribal groups, who are not only poor but deprived of various privileges, discriminated against in a number of ways, particularly in rural areas, and limited in their access to higher education and to positions of economic and political power. Their chances of upward mobility being restricted, poverty tends to perpetuate itself in the same groups.
Political structure works to similar effect. Political power is concentrated in the hands of the upper strata of society in both urban and rural areas, and the higher caste groups dominate even at the level of village panchayats. Where economic policies are formulated with the interests of industrialists, traders, landlords and richer farmers in view, poor peasants, landless labourers, tribal people and slum-dwellers are the ones who suffer in the process.
12.7 Government Policy for the Eradication of Poverty
Poverty needs to be removed not only on ethical and humanitarian grounds but on economic ones. The whole apparatus of economic development is pointless if the benefits of growth do not reach the masses, which is why the alleviation of poverty and the raising of living standards have been among the declared objectives of planning in India from the beginning.
What has changed over the Plans is not the objective but the strategy adopted to reach it. The main measures the government has relied on are set out below; the programmes designed as a direct attack on poverty are taken up separately in §12.8.
12.7.1 Economic Growth as the Early Strategy
The earliest strategy held that the ultimate solution to poverty lay in accelerating the pace of economic growth. Up to the Fourth Plan the government placed prime emphasis on growth itself.
The reasoning was that the benefits of growth would filter, or trickle, down to the poor in the form of more employment and higher incomes, as agricultural and non-agricultural activity expanded in the villages and economic activity expanded in the towns. Poverty was thus to be solved through growth rather than through a direct planned attack upon it.
The strategy did not succeed, for two reasons.
- Growth itself was modest — the rate of economic growth in the early years of planning was low, and a low rate of growth can at best prevent poverty from spreading. It cannot reduce poverty already in existence.
- The benefits did not reach the poor — such growth as occurred failed to reach the mass of people, and the lower income groups and weaker sections in particular. Equating growth with poverty reduction took too simple a view, since it attended to total income and ignored its distribution.
12.7.2 Agricultural Development
A very large proportion of India’s population still depends on agriculture, so mass poverty in rural areas cannot be reduced without developing that sector. Agricultural development has been an essential part of the strategy of economic development since 1951.
The instruments have been the familiar ones: irrigation, improved seeds and fertilisers, extension of credit, and support to output prices. Since a great many of the poor are cultivators or agricultural labourers, a rise in agricultural productivity raises their earnings directly, and a rise in agricultural output holds down the price of the food they buy.
Alongside this, the government has pursued special income-creation and employment-generation schemes intended to improve the position of landless labourers and marginal farmers, whom agricultural growth alone was unlikely to reach.
12.7.3 Cottage and Small-Scale Industries
The development of cottage and small-scale industries has been a significant feature of the Indian economy through the planning period, and these industries have been given a special place in the industrialisation programme.
Their relevance to poverty is a matter of technique. Being labour-intensive, they generate more employment for a given amount of capital than large-scale industry does, and being dispersed, they generate it where the poor already live. They have therefore played an important part both in creating employment and in securing a more equitable distribution of income.
To promote their growth the government has provided credit, allocation of raw material, marketing assistance, technical assistance and infrastructural facilities.
12.7.4 Population Control and Land Reforms
Two further measures address causes identified in §12.6 rather than symptoms.
Population control is essential because a high rate of population growth among the poor keeps per capita income and per capita consumption low, however much total income rises. Per capita income in India has continued to remain low despite a substantial rise in GDP, because more income is being shared among more members of the family. Reducing the rate of population growth raises per capita income, and by limiting the growth of the labour force it also eases unemployment. The government has pursued the family planning programme to this end.
Land reforms address the distribution of assets in agriculture. Their main planks have been the abolition of the zamindari system, the redistribution of land through a ceiling on holdings, and security of tenure for cultivators.
The results have fallen well short of the intention. Progress has been very tardy, ownership of land remains concentrated in the hands of the richer cultivators, and the number of landless agricultural labourers has increased significantly. The reforms are a step in the right direction, but for want of effective implementation the outcome so far has been far from satisfactory.
12.7.5 The Public Distribution System
The most direct of the general measures is the supply of food itself at prices the poor can meet.
The system operates through a wide network of fair-price shops, which supply such essential commodities as rice, wheat, edible oils, sugar and kerosene against ration cards at subsidised prices. Households in selected backward and remote blocks — drought-prone, desert, hill and tribal areas — are supplied at prices lower still. The PDS has been in operation since the beginning of planning and forms an important constituent of the strategy of poverty alleviation.
Its basic objective is to provide cheap foodgrains to the poor, but for many years it was open to poor and non-poor alike. This was the weakness the next step addressed. Under the targeted public distribution system adopted in June 1997, a two-tier pricing arrangement was introduced: families above the poverty line obtained foodgrains at a higher price, while families below the line received them at specially subsidised rates, normally about half the price charged to the others. The BPL entitlement, initially 10 kg per family per month, was raised to 20 kg with effect from 1 April 2000 and to 35 kg with effect from 1 April 2002.
For the poorest of the poor the government launched the Antyodaya Anna Yojana in December 2000. The scheme identified one crore of the poorest families and supplied them 25 kg of foodgrains per family per month at ₹2 per kg for wheat and ₹3 per kg for rice, the quantity being raised to 35 kg from April 2002. Its coverage was later extended to about 2.5 crore families.
The statutory basis of the system is now the National Food Security Act, 2013, under which foodgrains are supplied to a very large share of the population — of the order of 80 crore persons — through more than five lakh fair-price shops. India operates the largest distribution network of its kind in the world. Free foodgrains provided to these beneficiaries, first introduced as a temporary measure, have since been extended by successive government decisions.
12.8 Poverty Alleviation Programmes
The measures of §12.7 work on the economy at large and reach the poor indirectly, through growth, prices and the supply of food. A different class of measure works on poor households directly, by putting income or an asset into their hands.
These are the poverty alleviation programmes. They are the instrument through which planning in India has attempted a direct attack on poverty, and they are the part of policy most often examined and most often criticised.
12.8.1 The Shift to a Direct Attack on Poverty
During the 1970s a number of special programmes for the rural poor were undertaken — the Small Farmers Development Agency, the Marginal Farmers’ and Agricultural Labourers’ Development Agency, the Drought-Prone Area Programme and the Crash Scheme for Rural Employment among them. None covered the whole country, several operated simultaneously on the same target groups, and many were reduced to giving subsidies rather than attacking rural poverty at its source.
The decisive change came with the Fifth Plan, from 1974 to 1979, which adopted poverty alleviation as an explicit objective of economic planning rather than as a hoped-for by-product of growth. The Plan stated the position plainly: the elimination of abject poverty would not follow automatically from a faster rate of growth, and a direct attack on unemployment, underemployment and low-end poverty would have to be launched alongside it.
In the 1980s and 1990s the government undertook a wider set of programmes making a direct attack on both rural and urban poverty. Among them were the National Rural Employment Programme, the Rural Landless Employment Generation Programme, the Jawahar Rozgar Yojana, the Integrated Rural Development Programme, the scheme for Training Rural Youth for Self-Employment, the Self-Employment Programme for the Urban Poor, the Nehru Rozgar Yojana, the Prime Minister’s Rozgar Yojana and the Prime Minister’s Integrated Urban Poverty Eradication Programme. These were revamped, redesigned and restructured in 1999–2000 to make them more effective.
12.8.2 Self-Employment and Wage-Employment Programmes
Most poverty alleviation programmes take the form of special employment generation schemes for the poor, who live mostly in rural areas and small towns. The people for whom they are launched are the landless agricultural labourers, marginal farmers, village artisans, tribal people and people living in the hilly areas — precisely the groups identified in §12.4 as the rural poor.
These schemes are of two kinds, and the distinction is worth holding on to.
- Self-employment programmes — these supply an asset, a skill or credit so that the beneficiary can set up an occupation of his own. The income generated is expected to continue after the programme’s assistance ends.
- Wage-employment programmes — these offer paid work directly, usually on public works. The income is immediate but lasts only as long as the work does.
Besides generating employment, such schemes are intended to raise earning capacity, push up wages in the areas where they operate, add to the assets of the poor in the form of land, animals or houses, and so reduce poverty.
12.8.3 The Rural Employment Guarantee
The largest of these programmes gave the poor not a scheme but a legal right to work.
The National Rural Employment Guarantee Act was passed in 2005 and implemented from February 2006 in the 200 most backward districts, its coverage extended gradually to the rest of rural India. It was renamed the Mahatma Gandhi National Rural Employment Guarantee Act in October 2009. The Act guaranteed at least 100 days of unskilled wage employment in a year to every rural household whose adult members volunteered for it, at a minimum wage that varied across states, with at least one-third of the beneficiaries to be women. The programme was run by gram panchayats.
Its record over two decades was substantial. It provided wage employment to crores of rural households, raised agricultural wages in the areas where it operated, improved the economic condition of women, who came to form more than half the workforce under it, and reduced distress migration from rural areas. Beginning as a wage employment scheme, it evolved into an asset creation programme, building rural roads and undertaking soil conservation, flood control and land improvement works. UNDP cited it as an exemplary instance of job creation for the poorest rural households.
It also drew criticism — corruption and leakages, and delay in the payment of wages. The delays were reduced by routing payments through the Aadhaar-linked payment system, which transferred wages directly into beneficiaries’ bank accounts.
The framework has since changed. The Viksit Bharat — Guarantee for Rozgar and Ajeevika Mission (Gramin) Act, 2025 came into force on 1 July 2026, and MGNREGA stands repealed from that date. The new Act raises the statutory guarantee from 100 days to 125 days of wage employment per rural household in a financial year, retains employment on demand with an unemployment allowance where work is not provided in time, and directs the work towards durable rural assets — water security, core rural infrastructure, livelihood infrastructure and works to mitigate extreme weather.
Two changes have been criticised. The open-ended funding of the old Act, under which the Centre bore the whole of the unskilled wage cost and released funds against demand, has been replaced by a normative allocation fixed for each state, with the states meeting a share of the wage bill and any expenditure beyond the allocation. Critics argue that this shifts a financial burden onto the poorer states and weakens the demand-driven character of the guarantee.
12.8.4 Housing, Insurance and Pension Schemes
Alongside employment, the poor need shelter and protection against the risks that push a household back below the line.
Housing is provided under the Pradhan Mantri Awas Yojana. Its urban component, launched in June 2015, aims at housing for all in the towns, and is directed at low-income groups and economically weaker sections, to whom the central government provides a subsidy and an interest subsidy on home loans. A parallel rural component, launched in April 2016, provides financial assistance for a pucca house with basic amenities — toilet, gas connection, electricity and drinking water — to homeless households and those living in kutcha and dilapidated houses. The assistance per unit is about ₹1.2 lakh in the plains and ₹1.3 lakh in hilly areas, shared between the central and state governments. Crores of houses have been completed under the two components together.
Insurance is provided under the Pradhan Mantri Suraksha Bima Yojana, an accident insurance policy for people aged 18 to 70 with a premium of ₹20 a year and cover of ₹2 lakh for accidental death or disability. It is assisted by the central government and is open to those below the poverty line who would otherwise remain uninsured.
Old age income security is provided under the Atal Pension Yojana, launched in 2015 for the poor, the under-privileged and workers in the unorganised sector. Persons aged 18 to 40 may join, and the scheme provides a monthly pension between ₹1,000 and ₹5,000 after the age of 60, according to the contribution made. For subscribers who joined in the early years the central government co-contributed to the account for a period of five years.
12.8.5 Skill Development and Health Schemes
Two further groups of schemes act on the causes of poverty identified in §12.6 rather than on its symptoms.
Skill development is the object of the Pradhan Mantri Kaushal Vikas Yojana, launched in 2015 to provide industry-relevant skill training to youth, with centres at the district level. Its reasoning is that a large number of young people leave school after class X or class XII and enter the ranks of the unemployed; guided into a vocational skill suited to their aptitude, they can be gainfully employed instead. It is implemented through the National Skill Development Corporation under the Ministry of Skill Development and Entrepreneurship. Initiatives such as Startup India address the same problem from the side of enterprise, and separate efforts are directed at raising the participation of women in the labour force.
Health is addressed by the National Health Policy, 2017, which sets targets for universalising primary healthcare, reducing infant and under-five mortality, preventing premature deaths from non-communicable diseases and raising government expenditure on health. As a step towards universal health coverage the government has extended health insurance to poor and vulnerable households, covering hospitalisation costs that would otherwise be met by borrowing or the sale of assets.
The pandemic years produced a further set of measures. The government undertook one of the world’s largest foodgrain distribution programmes, along with direct cash transfers to crores of individuals and to women’s Jan Dhan accounts, cash support to construction workers, additional pension payments and free cooking gas cylinders. The Garib Kalyan Rojgar Abhiyan, launched in June 2020 for a period of 125 days across 116 districts in six states, provided employment and livelihood to migrant workers who had returned to their villages. Free foodgrains were supplied to beneficiaries under the National Food Security Act, 2013 through the Pradhan Mantri Garib Kalyan Anna Yojana, first as a temporary measure and then by extension.
12.9 A Critical Assessment of Poverty Alleviation Programmes
Large sums have been spent on poverty alleviation in India over half a century, and a great many official and non-official studies have been conducted to evaluate what that expenditure achieved. The verdict of those studies is neither a dismissal nor an endorsement: progress has been made, and it has fallen well short of what the effort should have produced.
Before 1970 the record was poor. India saw no consistent or significant drop in poverty up to that decade, because planning emphasised total output rather than its distribution. In rural areas the Green Revolution raised agricultural production without the benefits reaching the poor, and land reforms were largely ineffective. In urban areas the focus lay on heavy industry and public sector enterprises rather than on the small enterprises that employ poor people. Performance has been distinctly better since 1970, largely as a result of pro-poor policies and the alleviation programmes themselves.
12.9.1 Achievements of the Programmes
Four achievements are commonly credited to the programmes.
- Decrease in poverty — the proportion of the population below the poverty line fell by more than half over the four decades to 2011–12, and multidimensional poverty has fallen sharply since 2015–16. The alleviation programmes are held to have contributed substantially to this decline.
- Increase in the income of the poor — studies suggest that a considerable part of the rise in the incomes of poor households in recent years is attributable to poverty alleviation programmes, and India’s extreme poverty rate has fallen steeply over the last decade.
- Higher wages — one of the clearest effects has been a rise in wages in the areas where the programmes operate, particularly in backward regions. By offering an alternative source of employment, a public works programme raises the wage that private employers must offer.
- Improvement in nutritional level — the nutritional level of the poorest sections has improved, assisted by the public distribution system alongside the employment programmes.
12.9.2 Shortcomings of the Programmes
Against this, the programmes have met with limited success relative to the money spent on them, because the increase in income, employment and asset formation has been much below expectation. The causes of that limited success are these.
- Unsatisfactory administration — implementation has been far from satisfactory. Implementing staff are often inefficient, procedural requirements are complex, monitoring machinery is lacking and follow-up action is absent.
- Weak supporting institutions — the institutions that must supply credit, marketing and similar facilities to the beneficiary have not performed well. An asset handed to a poor household is of little use if the credit and the market to work it are missing.
- Leakages — the definition of who is poor has often been vague and unscientific, so a large number of non-poor have taken advantage of the schemes. Leakages have also been high on account of corruption and inefficient management.
- Neglect of remote areas — poor households in remote areas have been left out for want of accessibility and for want of information about the schemes.
- Defective strategy — the strategy has not attended to the exploitative agencies operating in rural areas, has not attempted to eradicate poverty by a direct attack on its structural causes, and has not recognised that the poor may be unable to take advantage of a benefit because they lack the skill, the stamina or the initiative to claim it. Poverty is an outcome of the way the economy functions, and what is needed is a modification of that functioning.
- Disjointed programmes — the programmes have been disjointed both at the policy level and at the stage of implementation, with several schemes running separately for the same target group.
- Lack of people’s participation — they have remained largely government-sponsored programmes. There is little consultation with local communities in general, and with the target groups in particular, in deciding and implementing the schemes.
- No link with the overall development strategy — the programmes have stood apart from the broader strategy of development instead of being integrated with it, which limits the benefit obtainable from either.
12.9.3 What Sustained Poverty Reduction Requires
The assessment points in a definite direction. What is needed is not more programmes but better ones, integrated with the overall development strategy so that the maximum benefit is obtained from both.
Three requirements follow from the shortcomings just listed. Identification must be accurate, or the subsidy meant for the poor will continue to be shared with those who are not poor. Administration must be capable and monitored, or the money allocated will not become a benefit received. And the people for whom the programmes exist must have a hand in deciding and running them, which is why the revitalisation of the panchayati raj institutions, and the setting up of the Ministry of Panchayati Raj to strengthen their role, is regarded as a step in the right direction.
The wider lesson returns to §12.5. Because the causes of poverty reinforce one another, no single programme acting alone will end it. India needs sustained effort across employment, education, health, agriculture and the distribution of assets if poverty is to be eliminated, and it needs that effort maintained long enough for the circle to be broken rather than merely dented.
12.10 Summary
- Poverty is the inability to obtain the basic necessities of life. It is multidimensional, involving not only a lack of goods but the denial of the opportunity to live a tolerable life.
- Poverty is understood in two senses. Income poverty is the lack of the basic necessities of material well-being; human poverty is the denial of the opportunity to lead a long, healthy and creative life. India’s official measure is a measure of income poverty.
- Income poverty itself is measured in two ways.
- Absolute poverty compares a household against a fixed minimum standard of living, defined in physical terms and expressed in money. It can, in principle, be eliminated.
- Relative poverty compares a household against the average income of its own society. It measures inequality, exists in rich countries too, and cannot be eliminated.
- India takes poverty in the absolute sense. The poverty line indicates the level of consumption expenditure just sufficient to buy the basic minimum quantity of food and a few selected non-food items.
- The poverty line is determined in four steps: fixing a nutritional norm of 2,400 calories per person per day for rural areas and 2,100 for urban areas; pricing the consumption basket that supplies it; setting the line at that level of per capita consumption expenditure; and updating it for price change using a price deflator.
- Persons whose per capita consumption expenditure falls below the line are said to be below the poverty line. The headcount ratio expresses their number as a proportion of the total population, and it is this ratio that is quoted as the incidence of poverty.
- The poverty line approach has definite limits. It records how many are poor but not how far below the line they are, it is anchored in food rather than in the full range of needs, and it captures one dimension of poverty only.
- Estimates differ with the methodology used, and figures from different methodologies must never be compared.
- On the Lakdawala methodology the all-India poverty ratio fell from 54.9 per cent in 1973–74 to 27.5 per cent in 2004–05.
- On the Tendulkar methodology, adopted from 2005, it fell from 37.2 per cent in 2004–05 to 21.9 per cent in 2011–12, the number of poor falling to 269 million. This is the last official estimate of income poverty.
- Multidimensional poverty measures deprivation across health, education and standard of living together. India’s national index, constructed by NITI Aayog on twelve indicators, shows a fall from about 25 per cent of the population in 2015–16 to a substantially lower level by the early 2020s, with rural deprivation still well above urban.
- Four observations describe the nature and extent of poverty in India: a long downward trend in the ratio; a very large absolute number of poor even so; wide variation between the states, poverty being high in Bihar, Chhattisgarh, Jharkhand, Madhya Pradesh, Odisha and Uttar Pradesh and low in Kerala, Goa, Punjab and Haryana; and a different composition of the poor in the two sectors.
- The rural poor are mainly landless labourers, small and marginal farmers, rural artisans and the scheduled castes and tribes, whose problem is low productive employment rather than open unemployment. The urban poor are mainly the unemployed, the underemployed and low-paid workers in the unorganised sector, and urban poverty is largely an extension of rural poverty carried in by migration.
- The vicious circle of poverty is a situation of self-reinforcing forces in which certain factors are related in a circular way, so as to result in the continuation of poverty and underdevelopment. It is both circular, each factor being cause and effect, and cumulative, the position worsening at each turn. A country is poor because it is poor.
- Three such circles are distinguished.
- On the supply side of capital formation: low productivity, low income, low saving, low investment, capital deficiency, and back to low productivity.
- On the demand side: low income, low demand and a small market, weak inducement to invest, capital deficiency, and back to low productivity.
- Between people and resources: economically backward people leave natural resources undeveloped, and undeveloped resources keep the people backward.
- The causes of poverty in India are diverse and mutually reinforcing: rapid population growth among the poor, a low rate of economic growth, unemployment and underemployment, a growth strategy that bypassed the poor, wide inequalities of income and assets, backwardness of agriculture, low levels of education, inflation, and socio-cultural and political structures that exclude the weaker sections.
- Government policy has relied on economic growth, agricultural development, cottage and small-scale industries, population control, land reforms and the public distribution system. The growth-first strategy of the early Plans failed, because growth was modest and its benefits did not reach the poor.
- The public distribution system supplies foodgrains and other essentials at subsidised prices through fair-price shops. It was targeted from 1997 by charging BPL households less than APL households, supplemented by the Antyodaya Anna Yojana of December 2000 for the poorest families, and now rests on the National Food Security Act, 2013.
- A direct attack on poverty was adopted as an explicit objective from the Fifth Plan (1974–79). Poverty alleviation programmes are of two kinds: self-employment programmes, which supply an asset, skill or credit, and wage-employment programmes, which supply paid work.
- The rural employment guarantee is the largest of these. MGNREGA, in force from 2006, guaranteed 100 days of unskilled wage employment a year to every rural household demanding it, raised rural wages and reduced distress migration. It was repealed on 1 July 2026 and replaced by the Viksit Bharat — Guarantee for Rozgar and Ajeevika Mission (Gramin) Act, 2025, which raises the guarantee to 125 days and replaces open-ended central funding with a normative allocation shared with the states.
- Other current schemes address shelter, risk and skill: the Pradhan Mantri Awas Yojana for housing, the Pradhan Mantri Suraksha Bima Yojana for accident insurance, the Atal Pension Yojana for old age income security, and the Pradhan Mantri Kaushal Vikas Yojana for skill training.
- The programmes have achieved a decrease in poverty, a rise in the incomes of the poor, higher wages in the areas where they operate and an improvement in nutritional levels. Their success has nevertheless been limited relative to the expenditure incurred.
- The shortcomings are unsatisfactory administration, weak supporting institutions, leakages arising from a vague definition of the poor, neglect of remote areas, a defective strategy, disjointed programmes, lack of people’s participation, and no link with the overall development strategy.
- Because the causes of poverty reinforce one another, no single programme will end it. Accurate identification, capable administration, participation through the panchayati raj institutions and sustained effort across employment, education, health, agriculture and the distribution of assets are what the elimination of poverty requires.
The two ways of measuring poverty used through the chapter are set out below.
12.11 Points to Ponder
- A poverty line drawn from calorie requirements says that a person who eats enough is not poor. If the line were redrawn today from what a household must spend on health, schooling and rent as well as food, would India’s poverty ratio be a different number, or a different kind of number altogether?
- Relative poverty cannot be eliminated, since some group must always be at the bottom of the distribution. Does that make it a lesser problem than absolute poverty, or simply a problem that policy finds it convenient to set aside?
- The vicious circle argues that poverty is its own cause. If that is true, how did any poor country ever escape — and what does the answer suggest about where an economy should apply its effort first?
- A wage-employment programme guarantees work at a fixed number of days a year. A cash transfer of the same value guarantees income with no work attached. Which does more for a poor household, and does your answer change if the household is headed by someone unable to do manual labour?
- India’s income poverty ratio has not been officially estimated since 2011–12, while multidimensional poverty has been estimated repeatedly. What is gained and what is lost when a country changes the measure by which it judges its own progress?
- Poverty in India is concentrated in a few states, and the gap between them and the rest has widened even as national poverty has fallen. Should the resources for poverty alleviation be allocated where the poor are most numerous, or where each rupee spent is likely to lift the most people out of poverty?
12.12 Objective Questions
- The poverty line in India is defined in terms of [1]
- the average income of the society
- the consumption expenditure just sufficient to buy a basic minimum quantity of food and a few select non-food items
- the income of the poorest ten per cent of the population
- the wage paid under rural employment programmes
- State whether the following statement is true or false, giving a reason: A fall in the headcount ratio shows that the condition of those still below the poverty line has improved. [1]
- The nutritional norm used in fixing India’s poverty line is ______ calories per person per day for rural areas and ______ calories for urban areas. [1]
- Match the items in Column A with those in Column B. [1]
| Column A | Column B |
|---|---|
| a. Tendulkar Committee | i. Vicious circle of poverty |
| b. Antyodaya Anna Yojana | ii. Revised methodology for estimating poverty |
| c. Ragnar Nurkse | iii. Foodgrains for the poorest families |
- From the statements Assertion (A) and Reason (R) given below, select the correct option. [1] Assertion (A): Relative poverty exists even in developed economies. Reason (R): Relative poverty measures the distribution of income rather than the ability to buy a fixed minimum of goods.
- Both Assertion (A) and Reason (R) are true and Reason (R) is the correct explanation of Assertion (A).
- Both Assertion (A) and Reason (R) are true but Reason (R) is not the correct explanation of Assertion (A).
- Assertion (A) is true but Reason (R) is false.
- Assertion (A) is false but Reason (R) is true.
12.13 Check Your Concepts
- Distinguish between absolute poverty and relative poverty. [2]
- Explain any three causes of poverty in India, showing in each case how the cause leads to low income. [3]
- ‘The nature of poverty is not the same in the rural and the urban sectors.’ Explain this statement with reference to who the poor are in each sector and what employment problem each faces. [4]
- Draw the vicious circle of poverty operating on the supply side of capital formation and explain it. Why is the process described as cumulative and not merely circular? [6]
12.14 Case-Based Question
- Ramkishan owns two acres of unirrigated land in a village in a backward district. In a good season the harvest feeds his family of six and leaves nothing over; in a poor season he works as a labourer on a neighbour’s field. He has never been able to save enough to buy a pump or better seed. His elder daughter Sunita left school after class VIII to help at home. Last year, when work in the village ran short, Ramkishan spent four months on a construction site in a distant city, living in a settlement without water or sanitation, and returned when the season turned.
- Identify the vicious circle at work in Ramkishan’s case and trace its links in order. [2]
- Ramkishan’s household is counted as rural poor, but for four months he was among the urban poor. Explain what this movement tells us about the relationship between rural and urban poverty in India. [2]