Chapter 16: Definition, Scope, Importance and Limitations of Statistics
Every month the Ministry of Statistics and Programme Implementation publishes an index number showing what has happened to the prices households pay. The Reserve Bank of India studies that figure before deciding whether borrowing should be made dearer or cheaper. One number, carefully collected, moves the cost of a loan for a farmer in Rajasthan and for a shopkeeper in Kerala alike. Economics deals with the choices people make when their means fall short of their wants. Those choices leave a trail of numbers behind them — of what was produced, what was earned, what was spent and what it cost. A statement such as ‘prices are rising’ or ‘unemployment is high’ carries little meaning until the extent of the rise or the size of the problem is measured. Statistics is the body of method by which such numerical facts are collected, arranged, condensed and read. This chapter explains what the word statistics means in its two senses, defines it in each, sets out the characteristics that numerical facts must have before they can be called statistics, and examines the scope of the subject, its importance in economics and its limitations.
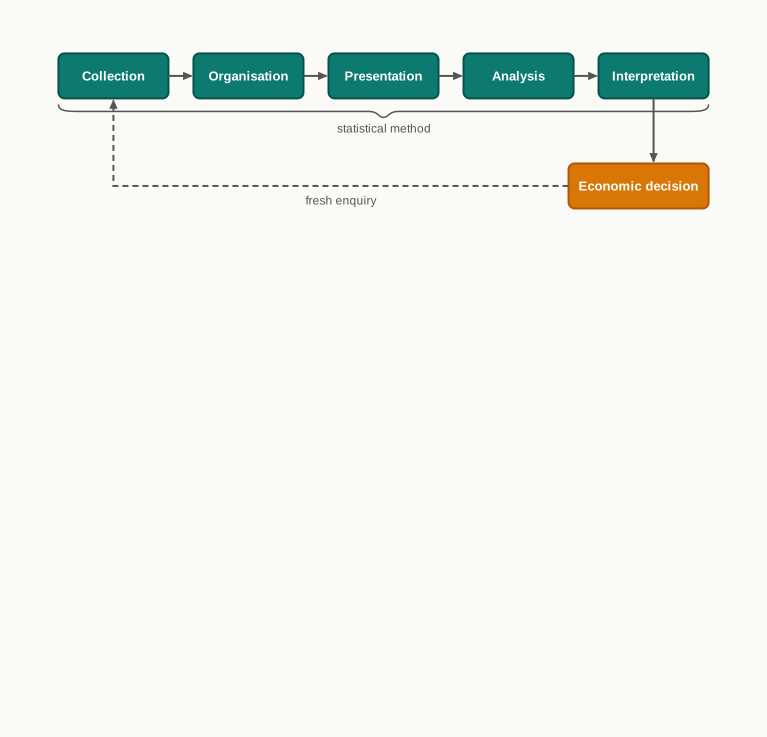
Fig. 16.0 — From numerical facts to economic decisions.
16.1 Numbers and the Study of an Economy
All of us want to know about the world we live in — about our neighbourhood, our town, the state of the country. Some of what we come to know can be stated in words alone; the rest has to be measured before it means anything definite.
Economics belongs firmly to the second kind of enquiry. It studies the choices people make when their means fall short of their wants, and a choice can be judged only when the gain and the sacrifice are placed side by side and compared. Comparison needs magnitudes, and magnitudes need numbers.
16.1.1 Quantitative and Non-Quantitative Knowledge
Knowledge is of two kinds. Qualitative knowledge describes a quality or an attribute of a thing — that a person is tall, that a harvest was poor, that a market is crowded. Quantitative knowledge states a magnitude — that the person is 172 centimetres in height, that the harvest was a fifth smaller than last year’s.
Both kinds are useful, but the quantitative kind is the more precise. To say that a person is tall leaves the listener to guess how tall; to give the height in centimetres leaves nothing to be guessed, and allows one person to be compared with another.
This is why knowledge in our times is pursued so largely through numbers and their measurement. Scientists, economists, business people, government officials, bankers and administrators all express their facts numerically when they want those facts to carry weight in an argument. The point is put sharply in the saying that ‘those who don’t count, won’t count’.
16.1.2 Why Economics Needs Measurement
An economic statement is almost useless until its extent is known. ‘Prices are rising’ tells us the direction of change but not whether the rise is one that households can absorb or one that will push families below the poverty line. ‘Unemployment is high’ tells us a problem exists but not how many people are without work, or which regions and age groups carry the burden.
Numbers are needed for three tasks in particular. They allow an economy to be compared with itself over time, so that we can say whether production, income or employment has grown. They allow one region, sector or group to be compared with another. And they allow a policy to be tested against the promise made for it, by measuring what actually changed after it was introduced.
Because numerical facts are needed so widely, a special body of method has grown up for handling them. That method collects the figures, arranges them, presents them, analyses them and finally interprets them, as Fig. 16.0 sets out. It is known as the statistical method, or briefly as statistics — and it is the meaning of that word that the next section takes up.
16.2 Meaning of Statistics
The word ‘statistics’ is an unusual one, because English uses it both as a plural noun and as a singular noun, and the two uses carry quite different meanings. A student who does not hold them apart will find the definitions in the next section contradicting one another.
16.2.1 Statistics in the Plural Sense
Used as a plural noun, statistics means numerical facts. In this plural sense the word refers to information stated in figures, gathered in a particular field of knowledge or enquiry, from which some conclusion is to be drawn.
The facts may belong to any branch of knowledge — economics, physics, chemistry, sociology, public administration or medicine. In economics they are figures of income, employment, output, prices, public expenditure and the like. When a newspaper reports the statistics of foodgrain production, it is the figures themselves that are meant.
16.2.2 Statistics in the Singular Sense
Used as a singular noun, statistics means the scientific method by which such numerical facts are handled. In this singular sense the word refers to a body of technique — the collection of data, their presentation in an orderly form, their analysis and the drawing of conclusions from them.
Understood this way, statistics is a subject of study rather than a set of figures. It is this second sense that is meant when we say that a student is learning statistics, and it is this sense that the rest of this book is concerned with.
The two senses are related, and the relation is worth stating plainly: statistics in the singular sense is the method used to make sense of statistics in the plural sense. The main points of difference between them are set out below.
16.3 Definition of Statistics
A definition states precisely what a subject covers and where it stops. Since the word statistics carries two senses, it has to be defined twice — once as numerical facts and once as the method of handling them.
16.3.1 Plural Definitions of Statistics
Several writers have defined statistics in its plural sense, and each of the earlier definitions fastened on one feature of numerical data.
Yule and Kendall described statistics as quantitative data affected to a marked extent by a multiplicity of causes. Their emphasis falls on the fact that figures in the social sciences are never the product of a single influence.
A. L. Bowley described statistics as numerical statements of facts in any department of enquiry placed in relation to each other. His emphasis falls on comparison — a figure has meaning only beside another figure.
Each of these definitions is correct as far as it goes, but each rests on one aspect alone. The most comprehensive definition in the plural sense is that of Horace Secrist, which gathers the several aspects together.
16.3.2 Characteristics of Statistical Data
Secrist’s definition is comprehensive because every phrase in it names a condition that numerical facts must satisfy before they can be called statistics. Merely stating a fact in figures is not enough. These conditions, taken together, are the characteristics of statistical data.
- Statistics are an aggregate of facts — a single numerical fact cannot be called statistics, because no conclusion can be drawn from a figure standing by itself. To say that there are 1,500 students in a school has no statistical significance. To say that 200 of them are in Class XII, 300 in Class XI and so on makes statistical sense, because the figures can now be compared.
- Statistics are numerically expressed — the facts must be stated in numbers. The heights or ages of students in a class are statistics; qualitative descriptions such as tall, short or honest are useful information but are not statistics, because they cannot be counted or measured.
- Statistics are affected by a multiplicity of causes — figures in economics and the social sciences are never the outcome of one influence alone. The number of deaths in a town in a year is affected by accident, disease, hunger and heat together. Data relating to one cause alone, say accidental deaths, would not be an aggregate in this sense.
- Statistics are enumerated or estimated with reasonable accuracy — since conclusions are to be drawn from the figures, they must be reasonably accurate, or the conclusions will mislead. The facts may be enumerated, which means actually counted, or estimated on the basis of accepted principles where counting every unit is impossible.
- Statistics are collected in a systematic manner — there must be a clearly laid-out plan before collection begins, covering what is to be collected, from whom and by what method. Figures gathered haphazardly do not serve the purpose for which they were wanted.
- Statistics are collected for a predetermined purpose — the object of the enquiry must be settled first, so that every fact bearing on it is collected and facts irrelevant to it are left out. Information gathered with no definite purpose in view remains a numerical value and does not become statistics.
- Statistics are placed in relation to each other — the facts must be comparable, whether the comparison is over time, across regions or across causes. Unrelated figures, however accurate, yield no conclusion.
From these characteristics follows a statement worth remembering in exactly its two halves: ‘all numerical data cannot be called statistics, but all statistics are called numerical data’. Numbers that fail any of the seven conditions remain mere numbers.
16.3.3 Singular Definition of Statistics
In the singular sense, statistics is a method or technique of dealing with numerical facts. It involves collecting the data, presenting them in a systematic manner, condensing and analysing them, and then interpreting them so that a conclusion can be drawn.
Around this method a theory of statistics has been built up as a distinct branch of scientific enquiry. What is studied in this course is that method — the techniques by which quantitative data are handled — and not the figures of any one field.
16.3.4 Stages of a Statistical Enquiry
The singular definition is in effect a list of stages, and an enquiry passes through them in order.
- Collection — the figures are gathered from the field or drawn from published sources, according to the plan settled beforehand.
- Organisation — the raw figures are classified into groups and arranged so that they can be handled.
- Presentation — the organised figures are set out in tables or diagrams, so that their broad shape can be seen at a glance.
- Analysis — the data are condensed into averages, measures of dispersion, correlation coefficients or index numbers, which summarise a mass of figures in a few values.
- Interpretation — the results of the analysis are read for what they say about the problem the enquiry began with, and a conclusion is drawn.
Each of these stages is taken up in detail in the chapters that follow, and the order in which they appear there is the order in which an enquiry actually moves.
16.4 Scope of Statistics
The scope of a subject is the range of matters it can be applied to. In the case of statistics that range is unusually wide, because every field of study that gathers numerical facts must sooner or later handle them.
16.4.1 Statistics as a Tool of All Enquiry
Statistics pervades almost every field of life around us. It has become an indispensable tool for drawing conclusions and for making decisions, because it allows a mass of figures to be reduced to a few values that can actually be read and compared.
Since the use of statistical method makes knowledge more precise, its use has spread into every field of study. Statistical methods enable conclusions to be drawn from a vast variety of data, and they allow the relationship between two aspects of a subject to be examined. The relationship between age and height, for instance, can be studied by collecting data on the age and the height of a large number of persons and examining how the two move together.
16.4.2 Fields in Which Statistics Is Applied
In its early phase statistics was concerned with the affairs of the state — with the counts of people, land and revenue that a government needed in order to govern. The subject has long since outgrown that origin, and today statistical methods are used in fields as far apart as these:
- Agriculture, biology and medicine
- Business, economics and public administration
- Chemistry, physics and electronics
- Communications and engineering
- Education, psychology and sociology
16.4.3 The Limits of the Subject Matter
The breadth of the subject creates a difficulty for a course of study, because no single book can follow statistical method into every field it has entered. A limit therefore has to be drawn, and the limit is drawn by the field of application rather than by the method itself.
In this book we are concerned only with the application of statistical methods in economics. The techniques taught in the chapters that follow — the collection and presentation of data, averages, dispersion, correlation and index numbers — are general techniques, and a student of biology or of psychology would learn much the same ones. What is particular to this course is that they are applied throughout to economic data.
16.5 Importance of Statistics in Economics
Statistics helps in grasping the meaning of the laws of behaviour that the social sciences state, and lends precision to scientific enquiry generally. In economics its role is central, because the propositions of economics are about magnitudes — how much is produced, how much is earned, how sharply buyers respond — and a magnitude cannot be argued about until it has been measured.
16.5.1 Understanding the Performance of the Economy
The condition of an economy is described by a small set of aggregate figures: total production, employment, national income and the general level of prices. Statistics supplies these figures, and without them the phrase ‘the state of the economy’ would have no definite content.
These aggregates also make comparison possible. An economy can be compared with itself over earlier years, so that we can say whether it has grown and how fast; and it can be compared with other economies, so that its performance can be judged against theirs.
Measurement further allows economic problems to be expressed quantitatively. Unemployment, poverty and a rise in prices are all felt before they are counted, but stating their magnitude is what turns a felt difficulty into a problem a government can be asked to act on.
16.5.2 Comparing Sectors and Regions
An economy is not a single block. Agriculture, manufacturing, power and services each contribute a share of output and employment, and the size of each share is a statistical question. Figures of production, employment and growth for each sector allow their relative importance to be judged, and allow a change in that importance over time to be traced.
Two kinds of comparison are worth naming. An intersectoral comparison sets one sector or region against another at the same date. An intertemporal comparison sets the same sector or region against itself at two dates.
Poverty illustrates both. To understand the problem, an economist wants to know its magnitude in rural areas as against urban areas — an intersectoral comparison. To know whether the problem is easing, the same measure is compared across years — an intertemporal comparison.
Regional figures matter for the same reason. How much of the country’s agricultural output comes from Punjab and Haryana, and how much from the other states, is important information; so is the share of different states in industrial production. Imbalances between regions can be established only by placing their figures side by side.
16.5.3 The Role of Government and the Framing of Policy
A government collects a part of the income of the economy as taxes, borrows and pays interest on what it borrows, and spends on administration, defence, education and support to agriculture and industry. All of this is a substantial part of economic activity, and all of it is recorded in figures.
Statistics relating to these activities are what make the role of government in the economy visible. They are also the material from which policy is framed, since a tax cannot be set, a subsidy budgeted or an expenditure defended without an estimate of what it will raise, cost or achieve.
16.5.4 Planned Development and the Use of Resources
Economic planning aims at a better utilisation of the resources an economy has. Planning of that kind is impossible without statistics on two matters: what resources are available, and how they are at present distributed among competing uses.
Statistics is equally necessary at the other end of the exercise. Whether a plan achieved what it set out to achieve can be settled only by measuring the outcome against the target, which is how the progress of successive five-year plans has been evaluated.
16.5.5 Testing and Building Economic Theory
Economics has developed its own principles — the laws of demand and supply, the relationship between the cost of production and the quantity produced, and many others. These principles are held to be general, but a general statement earns its standing only when data bear it out.
Statistical data allow a cause-and-effect relationship between two sets of figures, such as price and quantity demanded, to be examined. It was from data on prices and on the quantities purchased at those prices that the inverse relationship stated by the law of demand was established, and it is by the same means that the behaviour of consumers and producers continues to be verified.
The traffic runs both ways. As statistical methods are put to work on economic questions, the inadequacy of some of them becomes evident, and the effort to overcome it improves the methods themselves. The development of statistical technique has in this way been a gradual process driven by its use in economics and other fields.
16.6 Limitations of Statistics
Statistics is of immense importance, but it is not a method that can be applied to every question, and its results have to be read with an understanding of what they can and cannot establish. Its limitations are of two kinds — limits on what the method can study at all, and limits on how far its results can be pressed.
16.6.1 Statistics Ignores the Individual Observation
Statistical method studies aggregates of facts, and an aggregate has properties of its own that no single member of it possesses. The method is therefore not concerned with individual values or observations, and gives no special recognition to any one of them.
In studying the monthly incomes of the persons employed in an organisation, statistics is concerned with the incomes as a group — their average, their spread, the way they are distributed. The income of one particular employee has no standing in that enquiry, however unusual it may be.
This is a genuine limitation wherever the individual case is the point of interest. A doctor treating one patient, or a teacher deciding what a particular student needs, is asking a question that an aggregate cannot answer.
16.6.2 Statistics Does Not Study Qualitative Phenomena
Statistical methods deal with objects and attributes that can be measured in quantitative terms. A great many phenomena that matter in economic life cannot be measured in that way — honesty, beauty, goodwill and integrity among them.
Such qualitative phenomena are not for that reason unimportant. The goodwill of a firm affects its sales, and the honesty of an administration affects the working of every policy it implements. They simply lie outside what statistical method, unaided, can handle.
16.6.3 Statistical Results Are True Only on the Average
Generalisations arrived at from statistical data are not exactly accurate; they are true on the average. Statistical method gives approximate results rather than exact ones, and a result stated for a group need not hold for any particular year or any particular member of it.
Suppose food production is said to have been rising at 4 per cent a year over the last ten years. This does not mean that production rose by 4 per cent in each of those ten years. The increase in any one year may have been well above that figure or well below it, and in a year of drought there may have been no increase at all.
The same caution applies to averages of income, expenditure or yield. An average is a summary, and every summary suppresses the variation among the figures it summarises.
16.6.4 Statistics Can Be Misused
The most serious limitation of statistics is not in the method but in the hands that use it. Using numerical facts well calls for expertise, and where that expertise is absent there is wide scope for misuse and for conclusions that mislead. Yule and Kendall warned that statistical methods are ‘most dangerous tools in the hands of an inexpert’.
Misuse is sometimes deliberate. Figures can be selected, the base of a comparison chosen and the presentation arranged so as to support a conclusion decided on in advance. This is done by those with an interest in the conclusion, and the possibility is a standing warning that statistics should be used to draw the conclusions the data support, and not the conclusions one would like.
It was in this spirit that Benjamin Disraeli is said to have ranked statistics alongside the worst class of lies. The remark is an overstatement, and it is aimed at the wrong target. The fault lies not with statistics as a subject but with those who distort figures to reach a wrong conclusion. As W. I. King observed, the science of statistics is a most useful servant, but of real value only to those who understand how to use it properly.
The conclusion for a student of the subject is a practical one. Keep these limitations in mind while applying statistical method, use data impartially, and draw conclusions from them without bias or prejudice.
16.7 Summary
- Knowledge is of two kinds, qualitative and quantitative. Quantitative knowledge is the more precise, because it states a magnitude and so allows one case to be compared with another.
- Economics needs measurement because an economic statement means little until its extent is known, and because numbers allow an economy to be compared over time, across regions and against the promise made for a policy.
- The word statistics is used in two senses. In the plural sense it means numerical facts collected in a field of enquiry; in the singular sense it means the scientific method by which such facts are handled.
- In the plural sense, Yule and Kendall stressed that data are affected by a multiplicity of causes and Bowley stressed that facts must be placed in relation to each other. Horace Secrist’s definition is the comprehensive one, gathering these aspects together.
- Numerical facts become statistics only if they satisfy seven conditions:
- They are an aggregate of facts, not a single figure.
- They are numerically expressed.
- They are affected by a multiplicity of causes.
- They are enumerated or estimated to reasonable standards of accuracy.
- They are collected in a systematic manner, to a plan settled beforehand.
- They are collected for a predetermined purpose.
- They are placed in relation to each other, so that comparison is possible.
- It follows that all numerical data cannot be called statistics, but all statistics are called numerical data. The statement is not reversible.
- In the singular sense, Croxton and Cowden defined statistics as the collection, presentation, analysis and interpretation of numerical data.
- A statistical enquiry passes through five stages in order — collection, organisation, presentation, analysis and interpretation. The chapters that follow take up each of these in turn.
- The scope of statistics is very wide. Beginning with the affairs of the state, statistical method has spread to agriculture, medicine, business, the physical sciences, education and the social sciences, though this book applies it to economics alone.
- Statistics is important in economics in several areas:
- Understanding the performance of an economy and expressing its problems in quantitative terms.
- Comparing sectors and regions, both intersectorally and intertemporally.
- Understanding the role of government and framing economic policy.
- Planning the use of resources and evaluating what a plan achieved.
- Testing economic principles against data and building economic theory.
- Statistics also has limitations. It studies aggregates and ignores the individual observation, and it cannot deal directly with qualitative phenomena such as honesty, beauty or goodwill.
- Statistical results are true only on the average and are approximate rather than exact, so a rate stated for a period need not hold in any particular year.
- The gravest limitation is misuse. Figures can be selected and presented so as to support a conclusion fixed in advance, but the fault lies with those who distort them and not with the subject, which is of value only to those who understand its proper use.
16.8 Points to Ponder
- Secrist’s definition requires that data be collected for a predetermined purpose. But a purpose settled in advance decides which facts are worth collecting and which are not. Does this make statistics less objective than it claims to be, or is a stated purpose exactly what keeps an enquiry honest?
- Qualitative phenomena such as trust in a government or the goodwill of a firm cannot be measured directly, yet economists increasingly use numerical indicators to stand in for them. When an indicator is used in place of the quality itself, what is gained and what is quietly lost?
- If a government’s own agencies collect the figures by which that government’s performance will be judged, what safeguards would you want in place? Consider who should decide what is measured, and who should decide when a measure is changed.
- An average is a summary, and every summary suppresses variation. Are there economic questions for which the spread of the figures matters more than the average of them, and how would you decide which questions those are?
- Statistics ignores the individual observation. Yet a policy affects individuals, not aggregates. Can a decision made on aggregate evidence be a good decision for the particular household it falls on, and what should be done when it is not?
- Numerical facts about an economy are expensive to collect, and the money spent on collecting them is money not spent on schools or roads. How would you judge how much a country should spend on knowing about itself?
16.9 Objective Questions
- Which one of the following would be called statistics? [1]
- The statement that a shopkeeper is honest
- The figure of one household’s monthly expenditure, standing alone
- The monthly expenditure of fifty households in a locality, collected to study consumption
- Any set of numbers, however collected
- Fill in the blank: In the ______ sense, statistics means the scientific method of collecting, presenting, analysing and interpreting numerical data. [1]
- State whether the following is true or false, with no reason required: statistical generalisations give exact results for every unit in the group they describe. [1]
- Match the following: [1]
| Column A | Column B |
|---|---|
| a. Horace Secrist | i. Facts placed in relation to each other |
| b. Croxton and Cowden | ii. Collection, presentation, analysis and interpretation of numerical data |
| c. A. L. Bowley | iii. Aggregates of facts affected by multiplicity of causes, collected for a predetermined purpose |
- Assertion (A): A single numerical fact is not statistics. Reason (R): Numerical facts must be placed in relation to each other before any conclusion can be drawn from them. [1]
- Both A and R are true, and R is the correct explanation of A
- Both A and R are true, but R is not the correct explanation of A
- A is true but R is false
- A is false but R is true
16.10 Check Your Concepts
- The word ‘statistics’ is used in two different senses. Name them and give the meaning of each in one line. [2]
- State any three characteristics of statistical data, explaining each briefly. [3]
- ‘All numerical data cannot be called statistics, but all statistics are called numerical data.’ Explain this statement with one example of each kind. [4]
- Explain any four areas in the study of economics in which statistics plays a vital role, giving one illustration for each. [6]
16.11 Case-Based Question
- The municipal council of Rampur wants to decide where a new primary health centre should be located. Its office has two documents. The first is a note from a councillor reporting that people in the eastern wards complain of long journeys to the existing centre. The second is a record, kept ward by ward over the past three years, of the number of households, the distance of each ward from the existing centre and the number of patients treated from each ward.
- Which of the two documents contains statistics, and which does not? Give two characteristics of statistical data to support your answer. [2]
- The council finds that the average distance to the existing centre across all wards is short, and concludes that no new centre is needed. Identify the limitation of statistics the council has run into, and explain it. [2]