Chapter 21: Index Numbers
Prices do not move together. Between any two years the price of rice may rise, the price of pulses may rise faster, and the price of a mobile handset may fall. The changes are also quoted in different units — rice in rupees per kilogram, milk in rupees per litre, cloth in rupees per metre. Reading down such a list tells us nothing about whether living has become dearer, or by how much. Economics answers this with the index number, a specialised average that turns every price change into a percentage and then combines those percentages into a single figure, read against a base year taken as 100. An index of 120 says that the group of goods covered costs 20 per cent more than it did in the base year. India uses measures of exactly this kind — the Consumer Price Index for retail inflation, the Wholesale Price Index for prices in the wholesale market, and the Index of Industrial Production for the volume of factory output. This chapter explains what an index number is and what it measures, the uses and the limitations of index numbers, the problems met in constructing one, and the methods, simple and weighted, by which a price index number is built.
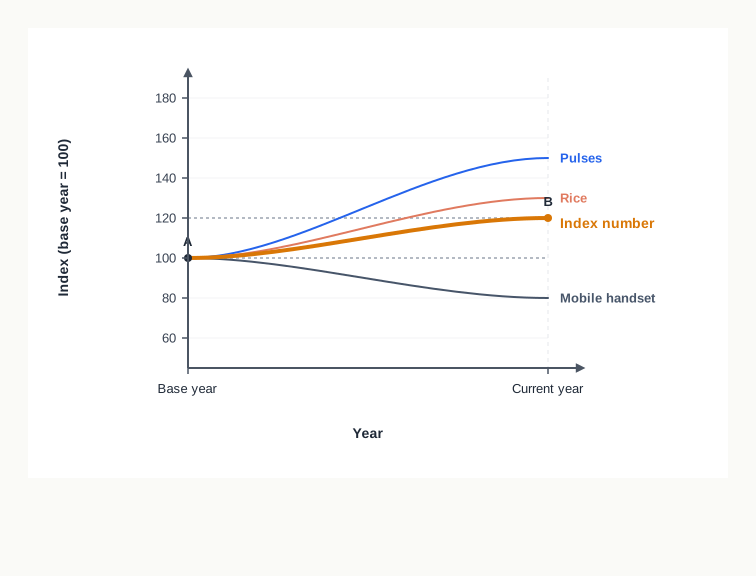
Fig. 21.0 – Divergent price changes reduced to a single average index number.
21.1 Why an Index Number Is Needed
A household asks a simple question at the end of a year: has living become dearer, and by how much? A government asks the same question before it revises pay, and a firm asks it before it fixes the price of what it sells. The question sounds easy, but the data available to answer it are a long list of separate prices, each moving in its own way.
21.1.1 Prices Change at Different Rates
No two prices move together. Over the same year the price of one commodity may rise steeply, another may rise a little, and a third may actually fall as its production becomes cheaper. The retail prices of four commodities in a base year and a current year are set out in Table 21.1, along with the change in each.
Read down the last column and no single answer emerges. Three prices have risen and one has fallen, and among those that have risen the increase ranges from 5 per cent to 30 per cent. The list describes each commodity accurately, yet it cannot say what has happened to prices taken as a whole.
21.1.2 Prices Are Quoted in Different Units
A second difficulty lies in the units. Wheat flour is priced by the kilogram, oil by the litre, cloth by the metre and a bulb by the piece, so the four money figures are not quantities of the same kind. Adding them together gives a total that would change if oil were quoted per 100 millilitres instead of per litre, and an answer that depends on how the seller happens to quote the price cannot be a measure of anything real.
The absolute change in rupees is unsatisfactory for a related reason. Wheat flour has risen by ₹6 and shirting cloth by ₹9, so the cloth appears to have risen more; but ₹6 on a price of ₹30 is a rise of a fifth, while ₹9 on a price of ₹180 is a rise of a twentieth. Only when each change is expressed as a proportion of the price it started from does a comparison across commodities become possible.
21.1.3 The Need for a Single Representative Figure
Both difficulties point to the same remedy. If every price change is first turned into a percentage of the price in the year chosen for comparison, the units disappear and become directly comparable; and once they are comparable they can be averaged into one figure that stands for the group. That figure is an index number.
An index number is therefore a specialised kind of average. An ordinary average summarises a set of values that are already measured in the same unit, such as the daily wages of fifty workers. An index number must first make its items comparable by converting them into relative changes, and only then averages them. It is expressed with the year of comparison taken as 100, so a figure of 120 reports an average rise of 20 per cent, and a figure of 92 an average fall of 8 per cent.
The device is not confined to prices. Wherever a group of items has to be compared over time and the items cannot simply be added, the same construction is used — for the volume of industrial output, for the value of exports, for agricultural production. This is why the index number is sometimes described as an economic barometer: it does not measure any one thing directly, but it registers the direction and the extent of a change in the group.
21.2 Meaning and Definition of an Index Number
Once the need for a single representative figure is accepted, the next task is to say precisely what that figure is, how it is anchored, and what a reader is entitled to conclude from it.
21.2.1 Meaning of an Index Number
An index number measures the change in the magnitude of a group of related variables between two situations, one of which is taken as the standard of comparison. The variables are related in the sense that they belong together for the purpose in hand — the prices of the goods a working-class household buys, the output of the industries in a country, the value of the commodities a country exports.
The comparison is usually made over time, which is the case the syllabus is concerned with. It may equally be made over space, as when the cost of living in one city is compared with that in another, or between groups, as when the output of the public sector is compared with that of the private sector. In every case the figure reports a relative change, never an absolute quantity.
21.2.2 Definitions of an Index Number
Two definitions state the idea compactly, and either is acceptable in an answer.
The first definition is the fuller of the two because it names the three grounds of comparison — time, place and other characteristics. The second is the shorter, and fixes attention on the essential point that what is measured is a difference in magnitude across a group rather than a value for any single item.
21.2.3 The Base Year, the Current Year and the Price Relative
Every index number needs a standard against which the comparison is made. The year selected as that standard is the base year, and its index is fixed at 100 by definition. The year whose position is being measured is the current year. The index for the current year is then read directly against 100: a figure above 100 reports a rise since the base year and a figure below it a fall.
For a single commodity, the comparison is made by expressing the current year’s price as a percentage of the base year’s price. This ratio is called the price relative, and it is the building block from which every price index number in this chapter is constructed.
\[\text{Price relative} = \dfrac{p_1}{p_0} \times 100\]
Here \(p_1\) is the price of the commodity in the current year and \(p_0\) its price in the base year, both in the same unit. The result is a pure number with no unit, read against 100: a price relative of 115 means the commodity is 15 per cent dearer than in the base year, and one of 90 means it is 10 per cent cheaper.
The same working repeated for several years converts a run of prices into a run of price relatives, all anchored to the same base. The prices of tea over four years and the relatives worked out from them are set out in Table 21.2.
Notice that the relative for 2021 is compared with 2018 and not with 2020. Every figure in such a series answers the same question — how does this year stand against the base year — and comparisons between two current years must be made with that in mind.
21.2.4 What an Index Number Shows
An index number for a group of commodities is an average of the individual relative changes, and this fixes both what it can tell a reader and what it cannot.
- Direction of change — whether the group as a whole stands above or below the base year, read from the position of the index against 100.
- Extent of change — how far above or below, read as the difference between the index and 100 in percentage terms.
- Comparison over time — the movement of the group from year to year, provided every figure in the series is built on the same base year.
What it does not show is the behaviour of any single commodity in the group. An index of 112 does not mean that each price has risen by 12 per cent, and it is entirely possible that some prices within the group have fallen. The index is an average, and like every average it conceals the spread of the values it summarises.
21.3 Features of Index Numbers
The definition tells us what an index number is. Its features tell us how it behaves, and each of them follows from the way the figure is built — as an average of relative changes anchored to a base taken as 100.
21.3.1 Index Numbers Measure Relative Change
An index number never reports a magnitude on its own. It reports how a magnitude stands in relation to what it was in the base year, and the whole of its meaning lies in that comparison. An index of 118 is a statement about two years at once, and is meaningless until the base year is named.
This is what makes index numbers comparable across quantities that have nothing else in common. A price index of 118 and an output index of 118 both report an average rise of 18 per cent, although one summarises rupees per unit and the other tonnes and metres.
21.3.2 Index Numbers Express Change Quantitatively
Ordinary language can say that prices have risen, that industry has slowed, that trade has recovered. An index number replaces such statements with a measured figure, so that the direction of change is accompanied by its extent.
This precision also allows one change to be set against another. If the index of retail prices stands at 118 and the index of money wages at 112 over the same period, the two figures together show that wages have not kept pace with prices — a conclusion that no purely descriptive account could establish.
21.3.3 Index Numbers Are a Specialised Average
An index number is an average, but not an ordinary one. An ordinary average is worked out from values already expressed in the same unit, and it summarises those values as they stand. An index number must first convert its items into relatives, because the items themselves are in different units and cannot be added; only then does averaging become legitimate.
It is specialised in a second respect. The items in the group are rarely of equal importance to the purpose in hand, so the average is usually a weighted one, with more weight given to the commodities that matter more. How that weighting is done is the subject of the later sections of this chapter.
21.3.4 Index Numbers Measure Change Over a Period of Time
Index numbers are ordinarily constructed as a series — a run of figures for successive years, all built on the same base — so that the movement of the group can be traced. A single index for a single year is of limited use; the value of the device lies in the series it makes possible.
The comparison need not be confined to time. Taking one place as the base allows the cost of living in two cities to be compared, and taking one group as the base allows two groups to be compared in the same way. What the device requires is a standard of comparison, and a year is only the most common choice of standard.
21.3.5 Index Numbers Measure What Cannot Be Measured Directly
Some of the magnitudes economics is most interested in cannot be observed as such. There is no single object called the general price level that can be weighed or counted, and the same is true of the cost of living, the volume of industrial production and the level of business activity. Each of these exists only as a summary of a large number of separate items.
An index number supplies that summary. By taking a representative group of items and measuring their average relative change, it produces a figure that stands for the whole even though the whole was never directly observable. This is why index numbers are described as economic barometers, and why the accuracy of the figure depends so heavily on how the group is chosen — a matter taken up when the problems of construction are examined.
21.4 Types of Index Numbers
Index numbers are classified by the variable whose change they measure. Three types are important in economics, and the choice between them is settled by the question being asked: has the group become dearer, has more of it been produced, or has the total money spent on it grown?
21.4.1 Price Index Numbers
A price index number measures the average change in the prices of a group of commodities between the base year and the current year. Quantities are either left out of the calculation altogether or used only as weights; what is being tracked is the price of each item.
This is the commonest type, and the one the syllabus requires to be constructed. The Wholesale Price Index and the Consumer Price Index are both price index numbers, differing in the market whose prices they collect and in the group of commodities they cover. A price index of 124 reports that the covered basket costs 24 per cent more than it did in the base year.
21.4.2 Quantity Index Numbers
A quantity index number measures the average change in the physical volume of a group of items — units produced, tonnes consumed, metres sold. Prices are held out of the comparison, or enter only as weights, so that the figure reports change in real terms and is not disturbed by inflation.
In its simplest form the quantities of the current year are compared with those of the base year.
\[Q_{01} = \dfrac{\sum q_1}{\sum q_0} \times 100\]
Here \(q_1\) is the quantity of each item in the current year, \(q_0\) its quantity in the base year and \(\sum\) the sum over all the items in the group. The result is a pure number read against 100, so a figure of 108 reports that the volume of the group is 8 per cent above the base year. The methods used to improve on this simple form, by attaching weights, are the same as those set out for prices later in the chapter.
The Index of Industrial Production is a quantity index of exactly this kind, since it measures the volume of output of mines, manufacturing and electricity rather than the money value of what they sell.
21.4.3 Value Index Numbers
A value index number measures the average change in the total money value of a group of items, and value is price multiplied by quantity. It therefore combines both the changes the first two types keep separate.
\[V_{01} = \dfrac{\sum p_1 q_1}{\sum p_0 q_0} \times 100\]
Here \(p_1\) and \(q_1\) are the price and quantity of each item in the current year, \(p_0\) and \(q_0\) their price and quantity in the base year, and each product \(pq\) is the money value of that item. The result is again read against 100, a figure of 130 reporting that the group is worth 30 per cent more than in the base year.
The convenience of a value index is also its weakness. Because both influences are inside the figure, a rise of 30 per cent may mean that prices have risen with output unchanged, that output has risen with prices unchanged, or any combination of the two — and the index itself cannot say which.
The three types are compared below on the points that decide which of them a particular question calls for.
21.5 Purpose and Uses of Index Numbers
An index number is built for a purpose, and it is worth being clear about the purposes before the methods of construction are taken up, because the purpose settles which commodities are included, whose prices are collected and how the items are weighted.
21.5.1 Barometer of Economic Activity
The condition of an economy is not directly visible. What can be observed are a large number of separate movements — output in one industry, prices in one market, trade in one commodity — and index numbers reduce these to a few figures that can be watched from month to month.
Read together, a price index, an output index and a trade index give a working account of the direction in which an economy is moving. This is why index numbers are described as economic barometers: they register a change and its extent without themselves being part of the weather.
21.5.2 Measurement of the Purchasing Power of Money
The value of money lies in what it will buy, so a rise in the general price level is the same event as a fall in the value of money seen from the other side. A price index measures the first and can therefore be used to measure the second.
\[\text{Purchasing power of money} = \dfrac{100}{P_{01}}\]
Here \(P_{01}\) is the price index for the current year with the base year taken as 100, and the result is the amount of goods a rupee buys in the current year expressed as a fraction of what it bought in the base year. If the index stands at 125, purchasing power is \(100/125 = 0.80\), so a rupee now buys four-fifths of what it once did.
21.5.3 Guide to Planning and Government Policy
Policy has to be settled on evidence of what has already happened to prices, output and trade, and index numbers supply that evidence in a comparable form. A government deciding whether to release stocks of foodgrains, raise import duties or tighten credit is reading movements in index numbers before it acts.
The same figures are used afterwards to judge whether the action worked. A target stated in terms of an index is testable in a way that a general intention to control prices is not, and the record of successive index values is the record against which policy is assessed.
21.5.4 Basis of Wage and Income Policy
Money wages tell an employee very little on their own, because what a wage is worth depends on the prices that must be paid out of it. Deflating the money wage by a price index converts it into a real wage, and it is the real wage that measures command over goods.
\[\text{Real wage} = \dfrac{\text{Money wage}}{\text{Price index}} \times 100\]
Here the money wage is the amount actually received and the price index is the consumer price index for the same year on the same base. If money wages rise by 8 per cent while the price index rises by 12 per cent, the real wage has fallen even though the pay slip shows more. Wage agreements and dearness allowance rules are built on exactly this calculation, which is why the index used is examined so closely by both employers and unions.
21.5.5 Guide to Business and Trade Decisions
Firms use index numbers in the same way as governments, on a smaller scale. A manufacturer watching an index of raw material prices has warning of a rise in costs; a trader watching an index of wholesale prices judges when to hold stock and when to sell; an exporter reading indices of prices abroad and at home judges where the advantage lies.
Index numbers also enter contracts directly. Long-term supply agreements often provide for the price to be revised according to a stated index, so that neither party carries the whole risk of a change in the price level.
21.5.6 Use as a Deflator
The most technical of the uses gathers up several of the others. Deflating means dividing a value measured at current prices by an appropriate price index to obtain the value at constant prices, and it is the standard way of removing the effect of price change from a money figure.
The device is used wherever a money total has to be compared across years. National income measured at current prices is deflated to give national income at constant prices, so that a genuine change in output can be distinguished from a change in the price level; the same operation converts nominal wages into real wages and the money value of trade into its volume. Without a price index to deflate by, none of these comparisons could be made at all.
21.6 Limitations of Index Numbers
Every one of the uses set out above rests on a figure that is, in the end, an estimate. An index number is built from a sample of commodities, priced in a sample of markets, averaged by a method chosen from several and anchored to a base year selected by judgement. Each of those choices is a point at which the figure may depart from the reality it is meant to represent.
21.6.1 Only an Approximate Indicator
No index covers every commodity traded or every market in which it is sold. A representative group is selected, its prices are collected from selected centres, and the result is treated as standing for the whole. The figure is therefore an approximation, and two indices built on different samples of the same economy will not agree exactly.
The averaging adds a second approximation. Since the index summarises a spread of relative changes into one figure, it necessarily conceals the spread, and an economy in which food prices rise sharply while manufactured goods cheapen may show a modest index rise that describes no household’s experience accurately.
21.6.2 Long-Run Comparisons Are Not Reliable
An index compares the current year with the base year, and the comparison is sound only so long as the two years are comparable. Over a long interval they cease to be. Commodities that were important in the base year lose their place, wholly new goods appear, and qualities change so that the article priced today is not the article priced then.
Comparing an index for the current year with a base year fixed decades earlier is therefore comparing two baskets that have little in common. This is why the base year of an index is revised periodically, and why a series must be treated with caution across a revision.
21.6.3 No Perfect Index Number Can Be Constructed
At several points in construction, more than one defensible choice exists. Base year quantities may be used as weights or current year quantities; the average taken may be arithmetic or geometric; the commodities included may be few and closely priced or many and loosely priced. Each combination yields a different figure, and none of them is the single correct answer.
The difficulty is not carelessness but the nature of the problem. An index compresses many changes into one number, and information is lost in the compression whichever method is used. What can be asked of an index is that its method suits its purpose and is stated openly, not that it be perfect.
21.6.4 Index Numbers Can Be Manipulated
Because the outcome depends on choices, an index can be steered by the choices made. Selecting a base year in which prices happened to be unusually high will make later years look moderate; including commodities whose prices have moved little will damp the index; choosing one method of weighting over another will shift the result in a predictable direction.
Such manipulation need not be dishonest. A constructor with a purpose in mind will lean, often unconsciously, towards the choices that suit it, which is why the composition of an index and the reasoning behind its base year are published along with the figure and are open to examination.
21.6.5 Use Is Limited to the Purpose of Construction
An index is built for a defined group and a defined question, and it answers no other. A consumer price index compiled for industrial workers reflects the buying pattern of industrial workers, and applying it to the cost of living of farmers or of high-income households misdescribes both, because the weights are wrong for them.
The restriction extends to time and place as well as to groups. An index constructed for one region cannot be read as measuring price change in another, and an index constructed to measure wholesale price movements cannot be used to revise retail wages. Using an index outside the purpose it was built for is the commonest and least visible of the errors made with these figures.
21.7 Problems Involved in Constructing a Price Index Number
The limitations of index numbers are not accidents; they arise from a set of decisions that the constructor of an index cannot avoid making. Seven such decisions are involved in building a price index number, and each of them affects the figure that finally appears.
21.7.1 Defining the Purpose of the Index
Nothing else can be settled until the purpose is fixed, because every later choice depends on it. An index meant to measure the cost of living of factory workers, an index meant to measure wholesale price movements and an index meant to measure the prices farmers receive are three different constructions, with different commodities, different markets and different weights.
A purpose stated loosely — ‘to measure price change’ — leaves the constructor without a criterion for including or excluding anything. The purpose must name the group whose experience is being measured and the kind of prices that concern it.
21.7.2 Choice of the Base Year
The base year is the standard of comparison, so its selection governs the meaning of every figure in the series. Three conditions should be satisfied.
- It must be a normal year — a year free of war, famine, epidemic, boom or slump, since an abnormal year makes every later comparison misleading in one direction.
- It must not be too distant from the current year, because consumption patterns, qualities and the range of goods available change with time and eventually make the two years incomparable.
- It must be a year for which reliable and complete price data exist, since a base built on weak data weakens the whole series.
The base may be a single year or the average of prices over two or three years, the average being preferred where no single year is clearly normal. Whichever is chosen, it is fixed at 100 and revised periodically as it ages.
21.7.3 Selection of Commodities and the Extent of Coverage
No index can include everything, so a sample of commodities must be drawn. Two questions arise — which commodities, and how many.
The commodities selected must be relevant to the purpose, so that an index for industrial workers covers the goods such households actually buy. They must be of stable and recognisable quality, because an item whose specification keeps changing cannot be priced consistently across years, and they must be sufficiently important in the group’s spending to deserve a place.
As to number, a larger coverage makes the index more representative but costlier to compile and slower to publish, while too small a coverage lets a single erratic price move the whole figure. The number chosen is a compromise between representativeness and workability, settled with the purpose of the index in view.
21.7.4 Choice of Prices and the Source of Data
Prices must then be collected, and several decisions follow. Wholesale or retail prices are chosen according to the purpose; the markets or centres from which prices are drawn must be representative of the group; and a rule is needed for the price actually recorded, since a commodity may be sold at different prices on the same day.
Consistency across time matters more than any single choice. Prices should be collected from the same sources, on the same basis and at the same intervals in every year, so that a change in the index reflects a change in prices and not a change in the way prices were gathered. Where quoted prices differ from prices actually paid, it is the latter that the index needs.
21.7.5 Choice of an Average
Since an index number is an average, the kind of average must be settled. The arithmetic mean is the usual choice, being simple to compute and easy to explain, though it is affected by extreme price relatives and can be pulled up by one commodity whose price has multiplied.
The geometric mean is regarded as theoretically better suited to averaging relatives, because it treats a doubling and a halving as equal and opposite movements and is less disturbed by extremes. It is harder to compute, and for that reason the arithmetic mean is more common in practice.
21.7.6 The System of Weighting
The commodities in a group are not equally important to the people the index represents. A rise in the price of a staple food matters more to a working-class household than an equal proportionate rise in the price of an occasional purchase, and an index that ignored this would misreport the household’s position.
Weights are the device by which importance is recognised. Each commodity is given a weight reflecting its share in the group’s spending or its quantity consumed, and the average is taken with those weights applied. The constructor must decide whether the weights are to be quantities or values, and whether they are to be drawn from the base year or the current year — a decision that separates the main methods of construction from one another.
21.7.7 Choice of an Appropriate Method
Finally, a method must be selected. The index may be built by aggregating prices or by averaging price relatives, and either route may be taken with weights or without them, which yields four broad possibilities. Within the weighted aggregative route there is a further choice between using base year quantities as weights, current year quantities, or a combination of the two.
Each method gives a somewhat different answer from the same data, so the method used should be stated whenever an index is published. These methods, and the circumstances in which each is appropriate, are the subject of the sections that follow.
21.8 Methods of Constructing Price Index Numbers
The last of the seven problems was the choice of method, and it is best approached as two independent decisions rather than one long list of formulae. The first decision is whether the commodities are to be treated as equally important or not. The second is whether the index is to be built by adding prices or by averaging price relatives.
21.8.1 Unweighted and Weighted Indices
A simple index number, also called an unweighted index, treats every commodity in the group alike. Each item counts once, whatever its place in the group’s spending, so a rise in the price of an occasional purchase influences the index exactly as much as an equal proportionate rise in the price of a staple.
A weighted index number attaches to each commodity a weight representing its importance, and takes the average with those weights applied. The weight is normally a quantity consumed or a value spent, drawn from the base year or the current year, and it ensures that the commodities that matter most to the group move the index most.
Weighting is not an optional refinement. Since the purpose of an index is to describe the experience of a defined group, an index that ignores how the group actually spends will misdescribe it, and the simple methods survive mainly because they are quick to compute and easy to explain. The main points of difference are set out below.
21.8.2 The Aggregative Method and the Average of Relatives Method
Cutting across that first distinction is a second. Under the aggregative method the prices of all the commodities in the current year are added together, and the total is expressed as a percentage of the corresponding total for the base year. The individual price relatives are never computed; the comparison is made between two aggregates.
Under the average of price relatives method the price relative of each commodity is worked out first, exactly as in Section 21.2, and the index is then the average of those relatives. Here the comparison is made commodity by commodity, and the averaging comes last.
The two routes answer the same question differently, and the aggregative route carries a defect the other does not — because it adds prices as they are quoted, a commodity priced in large units contributes more to both totals than a commodity priced in small units, and so influences the index more without any greater importance to the buyer. The relatives route escapes this, since a relative is a pure number.
Each route may be travelled with weights or without them, which yields the four constructions set out in Fig. 21.1.
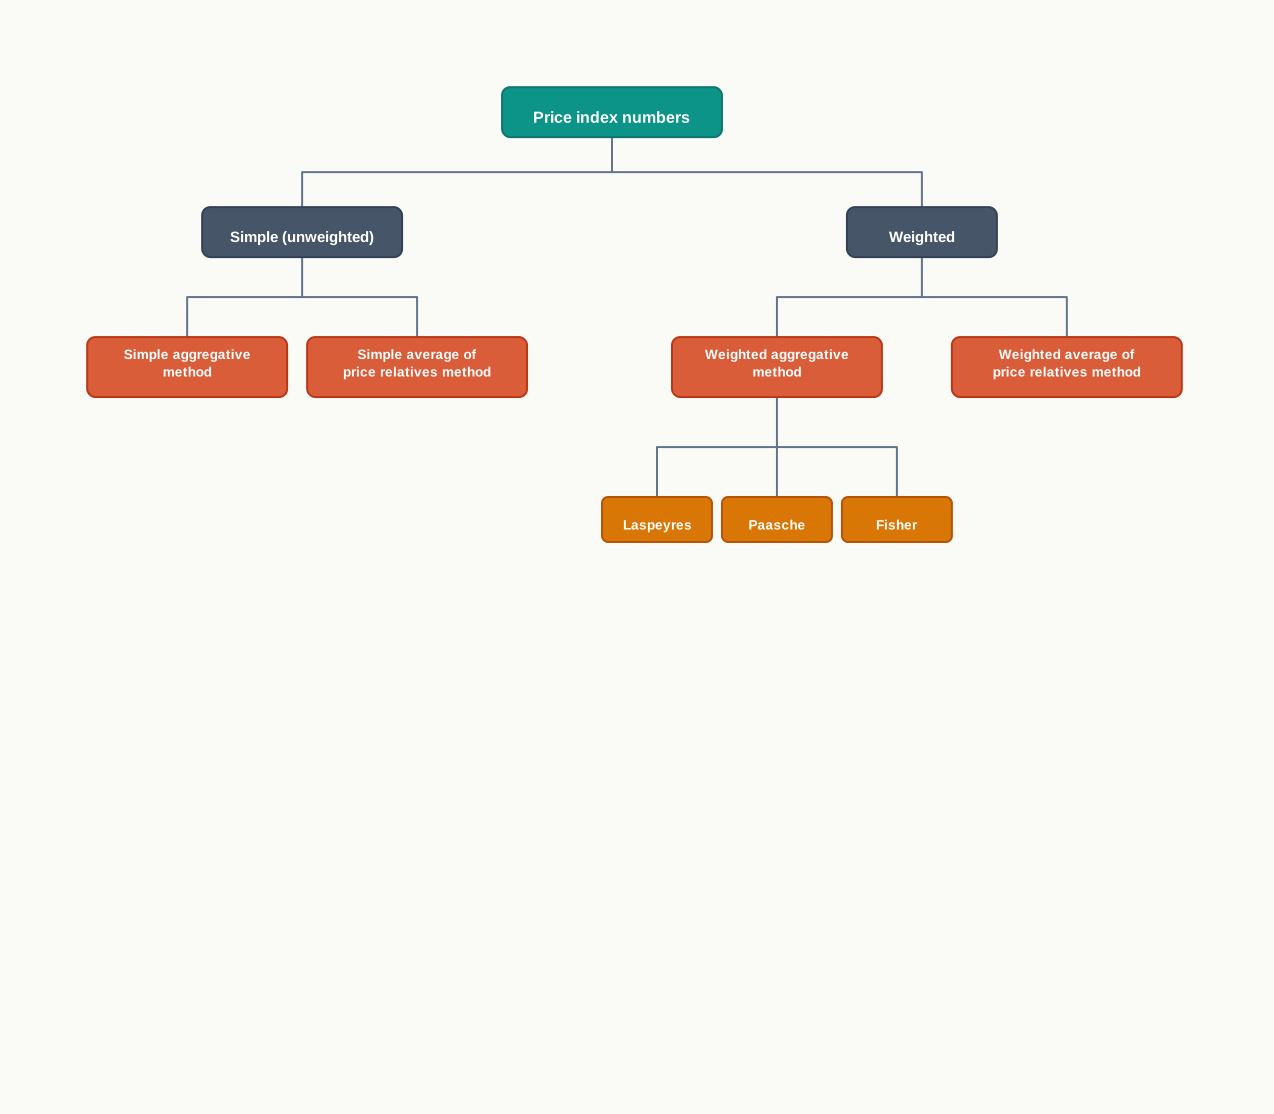
Fig. 21.1 – Classification of price index number methods.
21.8.3 Notation Used in the Formulae
The formulae in the sections that follow use one set of symbols throughout, and reading them is far easier once the notation is fixed. The subscript 0 always refers to the base year and the subscript 1 to the current year.
Two conventions are worth noticing. A product such as \(p_1q_0\) means the current year’s price multiplied by the base year’s quantity, so the order of the subscripts tells you at once which year each element is drawn from — and in the weighted methods that pairing is the whole point of the formula. And \(P_{01}\) reads as the index of year 1 on year 0, which is why the base year subscript comes first.
21.9 Simple or Unweighted Index Numbers
The two simple methods treat every commodity in the group as equally important. They are set out first because the weighted methods are extensions of them, and because the defects of the simple methods explain why weighting is needed at all.
21.9.1 Simple Aggregative Method
This is the shortest of all the constructions. The prices of all the commodities in the current year are added together, the prices of the same commodities in the base year are added together, and the first total is expressed as a percentage of the second.
\[P_{01} = \dfrac{\sum p_1}{\sum p_0} \times 100\]
Here \(\sum p_1\) is the total of the current year prices of all the commodities included, \(\sum p_0\) the total of their base year prices, and \(P_{01}\) the price index of the current year on the base year. The result is a pure number read against 100: a figure of 120 reports that the total cost of one unit of each commodity has risen by 20 per cent.
The steps are worth stating separately, since the same order is followed in every method that comes after.
- Set out the commodities with their base year and current year prices in adjacent columns.
- Add each column to obtain \(\sum p_0\) and \(\sum p_1\).
- Divide \(\sum p_1\) by \(\sum p_0\) and multiply by 100.
The prices of four commodities in a base year and a current year are given in Table 21.4, and the index is worked out in SE 21.3.
21.9.2 Limitations of the Simple Aggregative Method
The method has two defects, and both follow from adding prices as they are quoted rather than converting them into relatives first.
- The units of quotation influence the result — a commodity quoted in a large unit contributes a large figure to both totals and therefore dominates the index, while the same commodity quoted in a small unit barely affects it, although nothing about the commodity or its price change has altered.
- All commodities receive equal treatment in principle but not in effect — the index takes no account of how important each commodity is to the buyer, and yet the high-priced items influence it most, so the weighting that does occur is accidental rather than intended.
The first defect can be demonstrated directly. Table 21.5 repeats the data of Table 21.4 with one change only: milk is quoted per 100 ml instead of per litre, which alters neither its price nor the extent of its rise.
21.9.3 Simple Average of Price Relatives Method
The defect is removed by converting each price into a price relative before averaging. Since a relative is a pure number, the unit of quotation cancels out within each commodity and cannot influence the result.
\[P_{01} = \dfrac{\sum R}{N} \quad \text{where} \quad R = \dfrac{p_1}{p_0} \times 100\]
Here \(R\) is the price relative of a commodity, \(\sum R\) the total of the relatives of all the commodities included and \(N\) the number of commodities. The result is again read against 100, and it reports the arithmetic mean of the individual percentage changes.
The order of work is the reverse of the aggregative method: relatives first, averaging last. The relatives for the four commodities are computed in Table 21.6.
21.9.4 The Two Simple Methods Compared
Both methods ignore the importance of the commodities to the buyer, and in that respect they stand or fall together. Where they differ is in how they arrive at the average, and the difference decides which of them is the safer rough measure.
Neither method is used for a published index. Their value is that they show, in the plainest form, the two routes by which any price index is built — and the shortcomings that the weighted methods of the next section were devised to remove.
21.10 Weighted Index Numbers
A weighted index recognises that the commodities in a group matter to the buyer in different degrees. The importance of each is expressed as a weight, and the average is taken with the weights applied, so that a rise in the price of a staple moves the index more than an equal proportionate rise in the price of an occasional purchase.
21.10.1 Quantity Weights and Value Weights
Weights may be introduced in two ways, and the choice determines which formula is used.
Quantity weights are the quantities of the commodities bought or consumed, and they enter the aggregative methods directly: each price is multiplied by a quantity before the totals are taken, so that the aggregate becomes an expenditure rather than a sum of prices. Because the price is multiplied by the quantity, the unit of quotation cancels out and the defect of the simple aggregative method disappears.
Value weights are the amounts spent on each commodity, obtained as price multiplied by quantity, and they are used in the average of relatives method, where each relative is weighted by the value of the commodity before averaging.
A second decision follows. The quantities used may be those of the base year or those of the current year, and the three named methods of the syllabus differ from one another on precisely this point and on nothing else.
The Data Used Throughout This Section
One set of data serves for all four constructions, so that the methods can be compared on identical figures. The prices and quantities of four commodities in the base year and the current year, together with the four products required, are set out in Table 21.7.
21.10.2 Laspeyres’ Method
Laspeyres takes the quantities of the base year as weights. The question it answers is what the base year’s basket would cost at current year prices, compared with what it actually cost in the base year.
\[P_{01} = \dfrac{\sum p_1q_0}{\sum p_0q_0} \times 100\]
Here \(p_1\) and \(p_0\) are the current and base year prices of each commodity and \(q_0\) its base year quantity, so both aggregates are expenditures on the same fixed basket. The result is read against 100 in the usual way.
Fixing the basket in the base year is the method’s strength and its weakness together. It makes the index easy to maintain, because the quantities need to be collected only once, and it isolates the effect of price change by holding quantities constant. But consumers respond to price changes by buying less of what has become dear, and a basket fixed in the base year takes no account of that substitution — so the index tends to overstate the rise in the cost of living.
21.10.3 Paasche’s Method
Paasche takes the quantities of the current year as weights. The question it answers is what the current year’s basket costs now, compared with what the same basket would have cost at base year prices.
\[P_{01} = \dfrac{\sum p_1q_1}{\sum p_0q_1} \times 100\]
Here \(q_1\) is the current year quantity of each commodity, and both aggregates are expenditures on the basket actually bought in the current year.
Because the basket reflects present consumption, the index stays current in a way Laspeyres does not. The cost is that quantity data must be collected afresh every year, which is expensive and delays publication, and that each year’s index is built on a different basket, so successive figures in the series are not strictly comparable. Since the current basket already reflects the shift away from goods that have become dear, the method tends to understate the rise in the cost of living.
The two methods applied to the same data give 119.02 and 117.93. The difference is not an error; it reflects the different baskets held constant, and the main points of difference are set out below.
21.10.4 Fisher’s Method
Fisher’s method combines the other two. It takes the geometric mean of Laspeyres’ index and Paasche’s index, so that base year and current year quantities are given equal standing and the opposite biases are set against each other.
\[P_{01} = \sqrt{\dfrac{\sum p_1q_0}{\sum p_0q_0} \times \dfrac{\sum p_1q_1}{\sum p_0q_1}} \times 100\]
The four aggregates are the same ones already computed, and the square root of their combined ratio, multiplied by 100, is the index. It is described as the ideal index number because it uses the quantities of both years and lies between the two figures it is built from, and because a geometric mean is the appropriate average of two ratios.
21.10.5 Weighted Average of Price Relatives Method
The relatives route may also be weighted. Each commodity’s price relative is computed as before, and is then weighted by the value of that commodity rather than counted once.
\[P_{01} = \dfrac{\sum RW}{\sum W} \quad \text{where} \quad R = \dfrac{p_1}{p_0} \times 100\]
Here \(R\) is the price relative of a commodity and \(W\) its value weight, ordinarily the base year value \(p_0q_0\). The numerator is the total of the weighted relatives and the denominator the total of the weights, so the result is a weighted arithmetic mean of the relatives, read against 100.
The relatives and value weights for the same four commodities are set out in Table 21.8.
The answer is identical to Laspeyres’ index, and not by coincidence. Weighting the relatives by base year values is arithmetically the same operation as aggregating current prices over base year quantities, so the two formulae are two ways of writing one index. The distinction between the aggregative route and the relatives route is a matter of which data are easier to obtain, not of which answer is correct.
21.11 The Consumer Price Index
The methods of the last two sections can be applied to any group of prices. The three indices that follow are the applications that matter most in India, and the first of them is the one that touches households directly.
21.11.1 Meaning of the Consumer Price Index
The consumer price index measures the average change in the retail prices of the goods and services consumed by a specified class of people. It is also called the cost of living index, because it reports what has happened to the cost of maintaining a given standard of living rather than to prices in general.
Three elements of that description are essential. The prices are retail prices, since these are what a consumer actually pays. The commodities are those the specified class actually buys, weighted by their place in that class’s spending. And the class must be specified, because a basket that describes one group of consumers describes no other.
21.11.2 The Need for a Separate Index for Consumers
A general price index cannot answer the household’s question. It covers commodities the household never buys and omits services on which a large part of household spending goes; it collects prices in wholesale markets where households do not shop; and it weights commodities by their importance in trade rather than in domestic spending.
The gap is not small. Wholesale and retail prices of the same commodity move differently and by different amounts, because retail prices carry transport, storage and trade margins that change on their own account. An index built for consumers is therefore a separate construction, not an adjustment of a general index.
21.11.3 Steps in Constructing a Consumer Price Index
The general problems of construction set out in Section 21.7 take a definite form here.
- Decide the class of consumers — industrial workers, agricultural labourers, urban households — since the whole basket depends on whose cost of living is being measured.
- Conduct a family budget enquiry among that class to find how a typical household distributes its spending across groups such as food, clothing, fuel and light, housing, and miscellaneous items.
- Fix the weights from that enquiry, each group’s weight being its share in total consumption expenditure.
- Select the commodities and specify quality precisely, so that the same article is priced in every year and in every centre.
- Collect retail prices at regular intervals from the shops and markets where that class of consumers actually buys.
- Choose a normal base year and compute the index, ordinarily by the aggregate expenditure method.
21.11.4 Construction by the Aggregate Expenditure Method
Under the aggregate expenditure method the quantities consumed in the base year are used as weights, so the index compares what the base year basket costs at current retail prices with what it cost at base year prices.
\[\text{CPI} = \dfrac{\sum p_1q_0}{\sum p_0q_0} \times 100\]
Here \(p_1\) and \(p_0\) are the current and base year retail prices of each item and \(q_0\) the quantity of that item consumed in the base year. The formula is Laspeyres’ formula applied to a consumption basket, which is why a consumer price index is fixed to a basket of a particular year and must be rebased as consumption patterns change.
The consumption of a typical household in the base year and the retail prices of the five groups are set out in Table 21.9.
The same index may be reached by the family budget method, in which the price relative of each group is weighted by the amount spent on that group in the base year. As was shown at the end of Section 21.10, weighting relatives by base year values is arithmetically the same operation as aggregating current prices over base year quantities, so the two methods are two routes to one figure and either may be used according to the data available.
21.11.5 Uses of the Consumer Price Index
The index is the most widely used of all in India, and its uses follow from what it measures.
- Measurement of retail inflation — the headline inflation figure is the percentage change in this index over the same month a year earlier.
- Revision of wages and allowances — pay, pensions and dearness allowance are linked to a consumer price index so that money incomes keep pace with retail prices.
- Measurement of real income — money income deflated by the index gives real income, which is what measures command over goods.
- Measurement of the purchasing power of money — the reciprocal of the index shows what a rupee now buys against the base year.
- Formulation of policy — the index is the variable against which monetary policy is conducted and by which price control measures are judged.
21.11.6 Consumer Price Indices Compiled in India
India compiles more than one consumer price index, because different classes of consumers buy different baskets. Two families of series are in use.
The first is the set compiled by the National Statistical Office for the population at large, published separately for rural areas, for urban areas and for the two combined. The combined series is the one from which the headline retail inflation figure is calculated and against which monetary policy is conducted.
The second is the set compiled by the Labour Bureau for particular classes of workers — industrial workers, agricultural labourers and rural labourers. These are the series used to revise dearness allowance and wages for the groups concerned, and each has its own basket drawn from a family budget enquiry among that class.
The base year of each series is revised from time to time as consumption patterns change, and the weights are redrawn from the latest expenditure survey when the revision is made. For that reason an index figure should always be read along with the base year on which it is built.
21.12 The Wholesale Price Index
The second of the major Indian indices measures prices at an earlier stage of the market. It is watched as an indicator of the general price level rather than of the cost of living, and the difference between the two purposes explains almost everything about how it is built.
21.12.1 Meaning of the Wholesale Price Index
The wholesale price index measures the average change in the prices at which goods are traded in bulk in wholesale markets, between the base year and the current year. The transactions it prices are those between producers, wholesalers and traders — not the final sale to a household.
Because it catches prices before trade margins, transport costs and retail charges are added, the index registers a change in the price level earlier than a retail index does. It is for this reason treated as a general indicator of price movements in the economy, and used in deflating money values to constant prices where a broad measure of price change is needed.
21.12.2 Construction of the Wholesale Price Index in India
The index in India is compiled from wholesale transaction prices collected regularly from selected sources across the country, and the commodities included are arranged in three major groups.
- Primary articles — food articles, non-food articles such as fibres and oilseeds, and minerals.
- Fuel and power — coal, mineral oils and electricity.
- Manufactured products — the largest group, covering the output of manufacturing industry from food products and textiles to chemicals, metals and machinery.
Each group carries a weight reflecting its share in the total value of goods traded, and manufactured products, being the largest part of that trade, carry the largest weight. The index therefore responds more to a change in manufactured goods prices than to an equal proportionate change in the price of primary articles, although the latter are what a household notices first.
Two features of coverage should be noted. The index covers goods only and excludes services altogether, which is a substantial omission in an economy where services form a large share of output. And since the weights and the commodity basket reflect the pattern of trade in the base year, they are revised when the base year is revised.
An overall index is obtained from the group indices by weighting each group by its share. The group indices and weights in Table 21.10 are illustrative, and are used in SE 21.11 to show how the overall figure is arrived at.
21.12.3 The Wholesale and Consumer Price Indices Compared
The two indices frequently move by different amounts and occasionally in different directions, and students often treat this as a contradiction. It is not. They price different transactions, cover different items and are weighted for different purposes, so agreement between them would be the surprising outcome.
A practical consequence follows. A fall in wholesale prices does not guarantee relief at the shop, because retail prices carry margins and costs that move on their own account, and the two indices can diverge for months together. Each answers the question it was built for, and neither can be substituted for the other.
21.13 The Index of Industrial Production
The last of the three Indian indices is not a price index at all. It measures volume, and it is included here because the construction is the same and because it is read alongside the price indices in judging the condition of the economy.
21.13.1 Meaning of the Index of Industrial Production
The index of industrial production measures the average change in the physical volume of industrial output between the base year and the current year. Output is counted in units produced — tonnes, kilowatt hours, numbers of machines — so the figure is unaffected by what happens to industrial prices.
This is what makes it a quantity index in the sense of Section 21.4. A price index answers whether goods have become dearer; this index answers whether more of them has been made. An index of 110 reports that industrial output is 10 per cent above the base year, whatever prices may have done in the meantime.
21.13.2 Construction and Use of the Index in India
The index in India is compiled and released every month by the National Statistical Office, from production data reported by a large number of factories, mines and generating units. The items covered are grouped in two ways at once, and both classifications are published.
The sectoral classification divides output into three sectors.
- Mining — the extraction of coal, ores and other minerals.
- Manufacturing — much the largest sector, covering the whole range of factory industry.
- Electricity — the generation of power.
The use-based classification cuts across these, grouping output as primary goods, capital goods, intermediate goods, infrastructure and construction goods, consumer durables and consumer non-durables. It answers a different question: not which industry produced more, but what kind of demand the extra output was meeting. A rise concentrated in capital goods suggests investment is picking up; a rise in consumer non-durables suggests ordinary household demand is.
Each sector carries a weight reflecting its share in industrial output in the base year, and the overall index is the weighted average of the sectoral relatives. The weights and relatives in Table 21.11 are illustrative.
The index is used as a short-term indicator of industrial performance, as a basis for estimating the contribution of industry to national income between the full annual estimates, and as evidence in framing industrial and monetary policy. Its limitations follow from its coverage: it measures industry alone, leaving out agriculture and the whole of the service sector, so it describes one part of the economy and must not be read as a measure of overall growth.
21.14 Summary
- Prices of different commodities change at different rates and are quoted in different units, so a list of separate price changes cannot say what has happened to prices as a whole.
- An index number is a statistical measure showing the change in a variable or a group of related variables with respect to time, place or other characteristics. It is a specialised average, because the items must be converted into relatives before they can be averaged at all.
- The year taken as the standard of comparison is the base year and is fixed at 100; the year being measured is the current year. An index of 120 reports a rise of 20 per cent since the base year and an index of 92 a fall of 8 per cent.
- The price relative of a commodity is \(R = \dfrac{p_1}{p_0} \times 100\), where \(p_1\) is its current year price and \(p_0\) its base year price. The result is a pure number and is the building block of every price index.
- The main features of index numbers are that they measure relative and not absolute change, express that change quantitatively, are specialised averages, are ordinarily constructed as a series over time, and measure magnitudes such as the general price level that cannot be observed directly.
- Three types are distinguished by the variable measured.
- Price index numbers measure the average change in prices.
- Quantity index numbers measure the average change in physical volume, \(Q_{01} = \dfrac{\sum q_1}{\sum q_0} \times 100\), where \(q_1\) and \(q_0\) are current and base year quantities.
- Value index numbers measure the average change in total money value, \(V_{01} = \dfrac{\sum p_1q_1}{\sum p_0q_0} \times 100\), and cannot separate the price change from the quantity change inside them.
- Index numbers are used as barometers of economic activity, to measure the purchasing power of money as \(\dfrac{100}{P_{01}}\), to guide planning and policy, to fix wages through the real wage \(\dfrac{\text{Money wage}}{\text{Price index}} \times 100\), to guide business decisions, and as deflators converting values at current prices into values at constant prices.
- Their limitations are that they are approximate, being based on samples; that long-run comparisons across a distant base year are unreliable; that no perfect index can be constructed; that the choices involved allow manipulation; and that an index answers only the purpose it was built for.
- Constructing a price index requires seven decisions — the purpose, the base year, the selection and coverage of commodities, the choice of prices and their sources, the kind of average, the system of weighting, and the method. The base year must be normal, not too distant, and well supplied with data.
- Methods divide on two independent lines: simple or weighted, according to whether importance is recognised; and aggregative or average of relatives, according to whether prices are totalled or relatives are averaged.
- The simple aggregative method gives \(P_{01} = \dfrac{\sum p_1}{\sum p_0} \times 100\). Its serious defect is that the answer changes with the unit in which a commodity is quoted, since prices are added as they stand.
- The simple average of price relatives method gives \(P_{01} = \dfrac{\sum R}{N}\), where \(N\) is the number of commodities. It is free of the unit defect, because a relative is a pure number, but still treats all commodities as equally important.
- The three weighted aggregative methods differ only in whose quantities are used as weights, and are condensed below.
- The weighted average of price relatives method gives \(P_{01} = \dfrac{\sum RW}{\sum W}\), where \(W\) is the value weight of a commodity. With base year values as weights it reproduces Laspeyres’ index exactly, since the two formulae are two ways of writing one index.
- The consumer price index measures the average change in the retail prices of a fixed basket consumed by a specified class of people. By the aggregate expenditure method it is \(\dfrac{\sum p_1q_0}{\sum p_0q_0} \times 100\), which is Laspeyres’ formula applied to a consumption basket; the family budget method gives the same figure.
- India compiles consumer price indices for rural, urban and combined populations through the National Statistical Office, and separate series for industrial workers, agricultural labourers and rural labourers through the Labour Bureau. The weights come from household consumption expenditure surveys and are redrawn when the base year is revised.
- The wholesale price index measures the average change in bulk transaction prices, covering goods alone in three groups — primary articles, fuel and power, and manufactured products, the last carrying the largest weight. It indicates the general price level rather than the cost of living.
- The index of industrial production is a quantity index measuring the physical volume of output of mining, manufacturing and electricity. It is unaffected by industrial prices and covers neither agriculture nor services.
- Where group indices and their weights are given, whether for wholesale prices or industrial production, the overall index is their weighted average, \(\dfrac{\sum RW}{\sum W}\).
21.15 Points to Ponder
- Laspeyres’ index costs the base year basket at current prices and so ignores the fact that households buy less of what has become dear. Paasche’s index uses the basket they have actually shifted to. If pensions are to be revised so that pensioners are left no worse off than before, which of the two describes their position more honestly — and does the answer change if the substitution was reluctant rather than freely chosen?
- Revising the base year keeps an index relevant, but it breaks the comparability of the series across the revision. How should a statistical office weigh a figure that describes today’s consumption accurately against a series that can be traced back forty years, and is there any way to have both?
- A single national consumer price index averages across households whose baskets differ enormously — a family that spends most of its income on food and one that spends most of it on housing, education and travel experience the same headline inflation figure very differently. Is one number for the whole country adequate for setting policy, and what would be lost if several were published instead?
- A mobile handset today costs more than one did a decade ago, but it is a different and better article. When a price rises because the product has improved, has the cost of living risen at all? Consider how an index that ignores quality change and one that tries to adjust for it would each mislead.
- Every index reflects choices made by whoever built it — the base year, the commodities, the weights and the method. Since a government both compiles the index and is judged by what it shows, should the construction of official price indices be settled administratively, or does the conflict of interest call for some independent scrutiny?
- Wholesale prices can fall for several months while retail prices continue to rise. If policy is directed at one index while households experience the other, whose price level is the economy actually being managed for?
21.16 Objective Questions
- In Laspeyres’ method of constructing a price index number, the weights used are: [1]
- Base year quantities
- Current year quantities
- The average of base year and current year quantities
- Current year prices
- Assertion (A): The simple aggregative method gives a different index if a commodity is quoted per 100 ml instead of per litre. Reason (R): In this method the price relatives of the commodities are averaged. [1]
- Both A and R are true, and R is the correct explanation of A
- Both A and R are true, but R is not the correct explanation of A
- A is true but R is false
- A is false but R is true
- Fill in the blank: The index number of the base year is always taken as ________. [1]
- State whether the following statement is true or false: A value index number can show whether a rise in the total value of a group is due to a rise in prices or to a rise in output. [1]
- Match the items in Column A with those in Column B. [1]
| Column A | Column B |
|---|---|
| a. Fisher’s index number | i. Measures the physical volume of output of mining, manufacturing and electricity |
| b. Consumer price index | ii. Measures the average change in retail prices paid by a specified class of consumers |
| c. Index of industrial production | iii. The geometric mean of two weighted aggregative indices |
21.17 Check Your Concepts
- Define a price relative and state what a price relative of 108 shows. [2]
- Explain any three problems involved in constructing a price index number. [3]
- From the following data, calculate the price index number for the current year by Laspeyres’ method and by Paasche’s method, and state which of the two is the higher. [4] Commodity A: base year price ₹4 and quantity 10 units; current year price ₹5 and quantity 12 units. Commodity B: base year price ₹6 and quantity 8 units; current year price ₹9 and quantity 6 units. Commodity C: base year price ₹10 and quantity 5 units; current year price ₹12 and quantity 5 units.
- Distinguish between the wholesale price index and the consumer price index on any four bases, and explain why the two may move by different amounts over the same period. [6]
21.18 Case-Based Question
- Over a period of three years the monthly wage of workers at Suraj Textiles rose from ₹12,000 to ₹13,500. Over the same three years, the consumer price index for industrial workers rose from 100 to 125. The workers’ union has asked the management for a further revision, while the management points out that wages have already been raised.
- Calculate the real wage of a worker in the current year and state whether the workers are better off than they were three years ago. [2]
- Explain why the wholesale price index would not be a suitable measure for revising the wages of these workers. [2]