Chapter 19: National Income Aggregates
Every economy needs a figure that says how much it produced in a year and how much its residents earned from producing it. In India these figures are compiled by the National Statistical Office, which releases estimates of national income and the related aggregates each year. Those estimates are then used to judge how fast the economy is growing, what an average resident earns and where policy needs to act. The difficulty is that no single figure answers every question. Output produced inside the country is not the same as income earned by its residents, because foreigners work and own firms here while Indians work and own firms abroad. The value buyers pay is not the value the factors of production receive, because indirect taxes and subsidies sit between the two. And output measured before machinery wears out is not what remains once that machinery has been replaced. Economics therefore does not compute one aggregate but a family of them, each answering a different question about the same year’s output. This chapter defines these aggregates, shows how each is reached from another, extends them to the income households can actually spend, and finally asks how far any of them measures the welfare of a people.
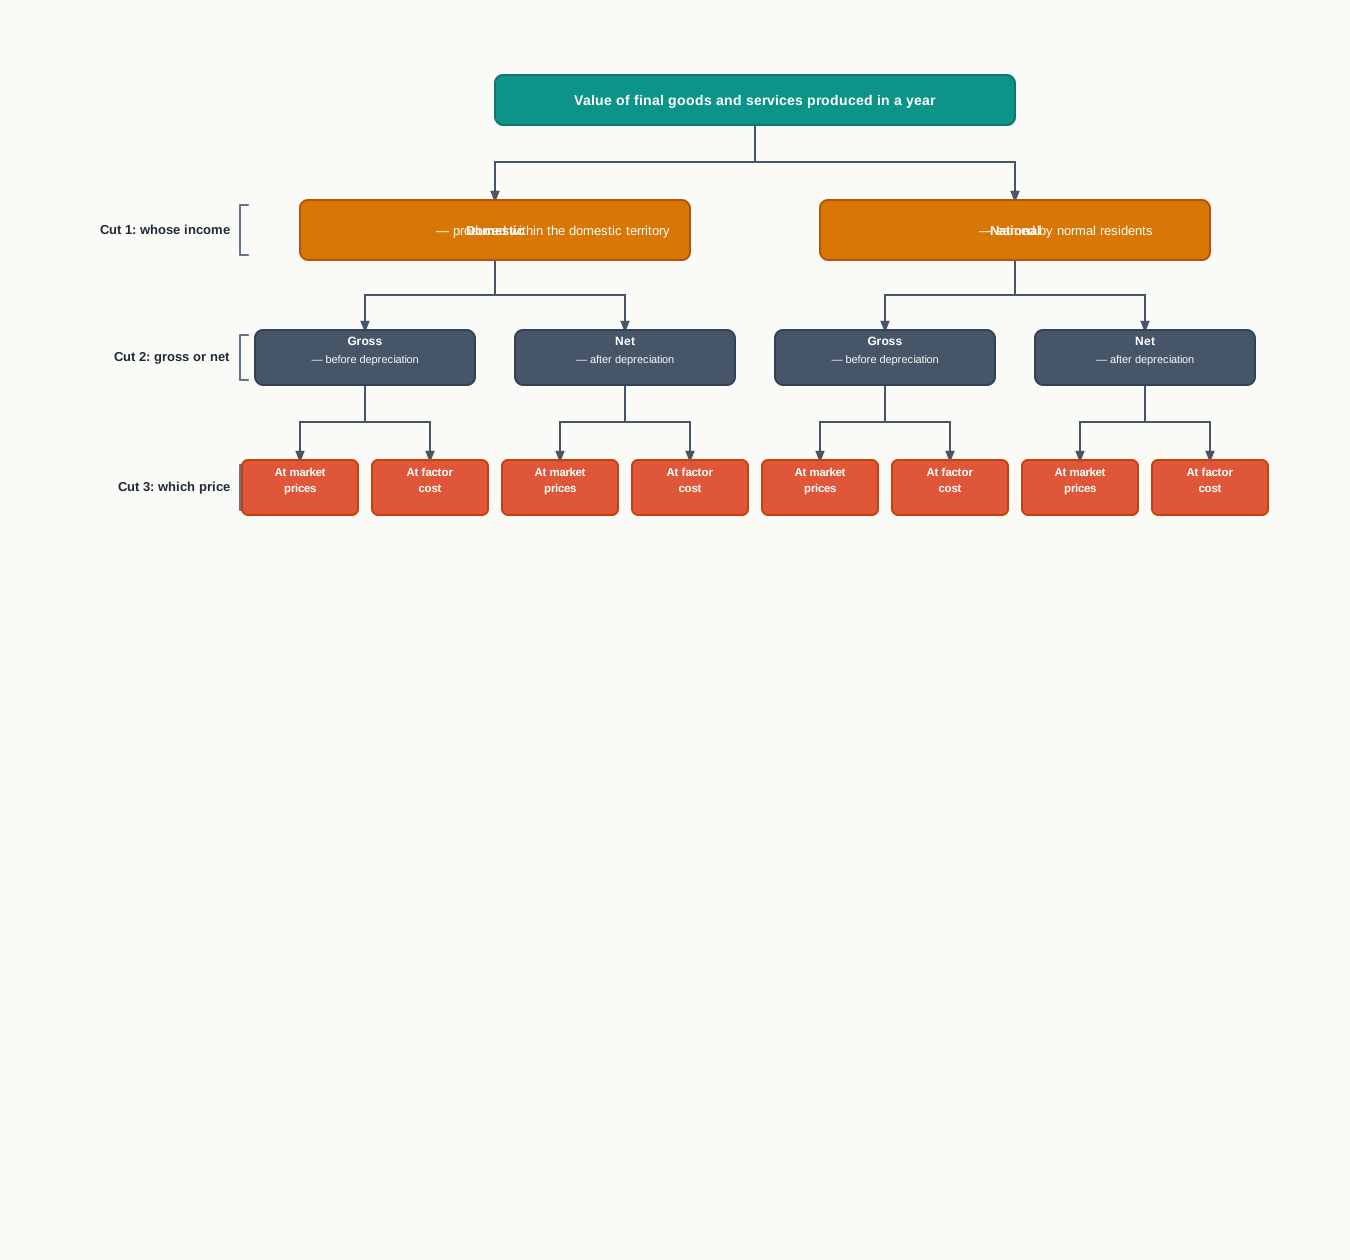
Fig. 19.0 – The three cuts producing national income aggregates.
19.1 Domestic Product And National Product
An economy produces goods and services all through the year, and that output has to be valued as a single sum before anything can be said about growth, average income or the burden a budget can carry. The sum, however, can be drawn in two different ways. We may count everything produced inside the country’s borders, whoever owns the firm and whoever does the work. Or we may count everything earned by the country’s own residents, wherever in the world they earn it.
The two totals are not the same, and each answers a different question. The first asks how much the territory produced; the second asks how much the people of the country earned. Modern economies are open, with goods, capital and workers crossing borders, so the gap between the two is real and has to be measured rather than assumed away.
The Territory And Its Residents
Both totals rest on two pieces of standard vocabulary. The first fixes the boundary of the territory; the second fixes who counts as belonging to the country.
For national income purposes the domestic territory is wider than the political map alone. It covers:
- Political frontiers — the land, inland waters, territorial waters and air space lying within the country’s borders.
- Ships and aircraft — vessels operated by residents of the country between two or more countries.
- Embassies and consulates — the country’s embassies, consulates and military establishments situated abroad.
- Fishing vessels and rigs — fishing boats, oil and natural gas rigs and floating platforms operated by residents in international waters.
By the same rule, the embassy of a foreign government situated in this country lies outside our domestic territory, because it is administered by another government.
Residence, not citizenship, is the test. Tourists, foreign diplomats, officials of international bodies posted in the country and workers on short visits are not normal residents of it, however long their passports say they have belonged elsewhere.
The Two Aggregates Defined
With the boundary and the residents fixed, the two aggregates follow directly.
The distinction is therefore one of criterion and not of size. Domestic product is geographical in character, since it asks where production took place. National product relates to nationals, since it asks who earned the income. Fig. 19.1 sets the two out side by side.
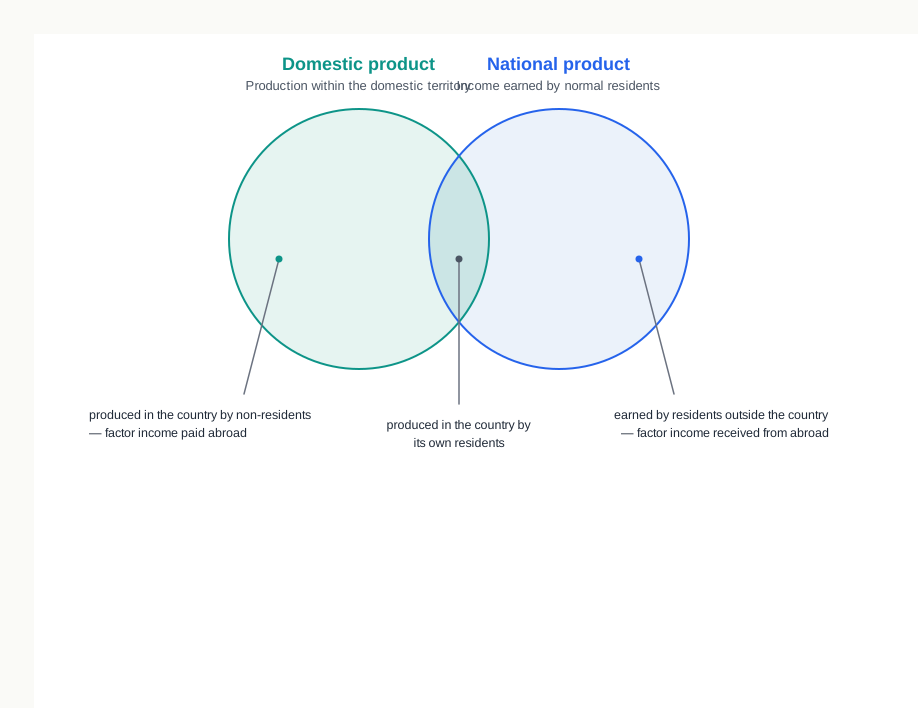
Fig. 19.1 – Domestic product and national product.
The Bridge Between Them
The two crescents in the figure are the whole of the difference. Some of the income generated inside the country accrues to non-residents and leaves it; some income generated outside the country accrues to residents and comes in. The net figure of these two flows is what carries us from one aggregate to the other.
It has three components:
- Net compensation of employees — wages and salaries earned by residents working abroad for short periods, less similar earnings of non-residents working in this country.
- Net income from property and entrepreneurship — rent, interest and profit received by residents from abroad, less such income paid to non-residents.
- Net retained earnings of resident companies abroad — profits of branches abroad kept back there by companies resident in this country, less profits kept back in this country by companies resident abroad.
Adding this net figure to the output of the territory gives the income of the residents.
\[\text{National Product} = \text{Domestic Product} + \text{Net Factor Income from Abroad}\]
Here both products and the net factor income are money values for one year, measured in ₹ crore. The net figure may be positive, negative or zero. It is positive when residents receive more factor income from abroad than the country pays out, and national product then exceeds domestic product; it is negative when the country pays out more than it receives, and national product falls short of domestic product. Where the two flows happen to balance, or where an economy is closed and neither flow exists, the two aggregates are equal.
The main points of difference between the two aggregates are set out below.
The relation can also be read as a simple stacking of values, shown in Fig. 19.2.
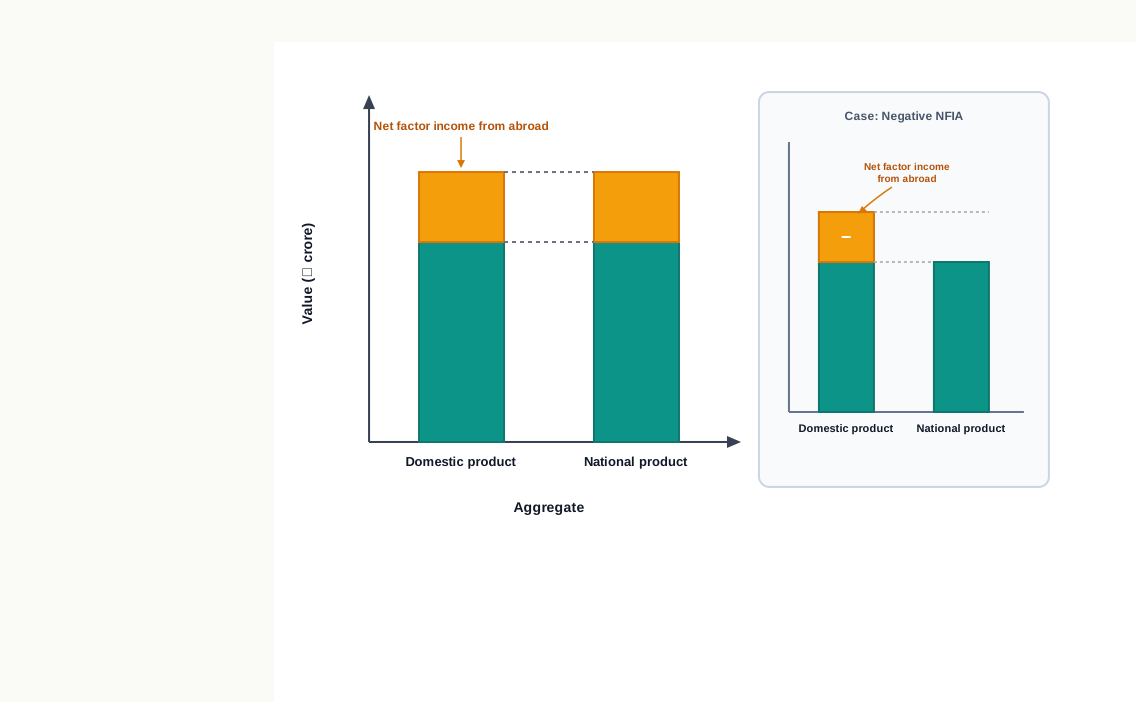
Fig. 19.2 – From domestic product to national product.
19.2 Market Price And Factor Cost
The output of a year has been valued, but at what prices? A buyer in the market pays one figure for a good; the land, labour, capital and enterprise that made it receive a smaller or a larger figure. Between the two stands the government, taking indirect taxes out of the price and putting subsidies back into it. Since national income can be read either as the value of what was bought or as the earnings of those who produced it, the same output yields two valuations.
The Two Valuations
Market price is the price at which a commodity is actually sold in the market. Factor cost is the sum of the payments made by firms to the owners of the factors of production for their productive services — wages, rent, interest and profit. Valuing output at market prices tells us what buyers paid; valuing it at factor cost tells us what the factors earned.
Why The Two Differ
The wedge between them is created by the government. Indirect taxes such as the Goods and Services Tax and excise duty are levied on goods and services and are collected as part of the price the buyer pays. That part of the price passes to the government and never reaches any factor of production. Indirect taxes therefore push market prices above factor cost, and must be taken out of a market-price valuation to reach a factor-cost one.
Subsidies work the other way. They are cash grants given by the government to producers so that goods may be sold below the price the market would otherwise require. The seller receives the low market price from the buyer and the subsidy from the government, so the factors are paid more than the market price alone would allow. Subsidies therefore pull market prices below factor cost, and must be added back.
Since the two pull in opposite directions, only their net figure matters for the conversion.
The conversion from one valuation to the other is therefore a single subtraction. It values the same year’s output twice, once as buyers paid for it and once as producers earned from it, and the difference is what the government took net of what it gave.
\[\text{National Product}_{FC} = \text{National Product}_{MP} - \text{Indirect Taxes} + \text{Subsidies}\]
Since indirect taxes less subsidies are net indirect taxes, the same relation is written more compactly as:
\[\text{National Product}_{FC} = \text{National Product}_{MP} - \text{Net Indirect Taxes}\]
Here the subscript \(FC\) stands for factor cost and \(MP\) for market prices, and every term is a money value for one year measured in ₹ crore. Net indirect taxes are normally positive, so a factor-cost figure usually lies below the corresponding market-price figure. Where subsidies exceed indirect taxes the net figure is negative, and the factor-cost valuation is then the higher of the two. The relationship is set out in Fig. 19.3.
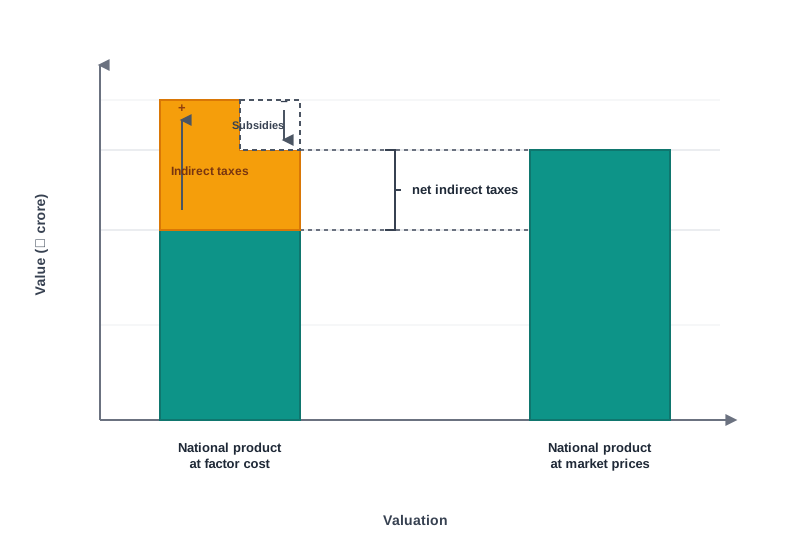
Fig. 19.3 – The wedge between factor cost and market prices.
The conversion runs in the other direction just as easily, as SE 19.2 shows.
The main points of difference between the two valuations are set out below.
19.3 Gross Product And Net Product
Producing this year’s output uses up part of the country’s stock of capital. Machines wear out, buildings age, vehicles are run down and equipment falls out of use. Some of what an economy produces in a year must therefore go simply to making good that loss, and only what is left over is a genuine addition to the goods and services available to it. The third cut in national income accounting turns on whether this replacement is counted in or taken out.
Depreciation
The loss of capital in the course of production is called depreciation, or in the language of national accounts, consumption of fixed capital.
Two causes lie behind it, and both are ordinary and expected:
- Normal wear and tear — the physical using up of a machine, vehicle or building through the work it does over the year.
- Foreseen obsolescence — the expected loss of usefulness as a technique or a design is superseded, so that an asset must be replaced before it physically fails.
Because both are foreseen, producers provide for them. A firm sets aside a part of its earnings each year as a depreciation allowance, so that when the asset finally has to be replaced the money is at hand. The allowance is not a payment to any factor of production; it is a charge against output for the maintenance of the capital stock itself.
Gross And Net
An aggregate is described as gross when no allowance has been made for depreciation, and as net when depreciation has been deducted. The relation is a single subtraction, and it holds for domestic and national aggregates alike and at either valuation.
\[\text{Net Product} = \text{Gross Product} - \text{Depreciation}\]
Here the gross product is the value of a year’s output before any allowance for capital used up, depreciation is the value of that capital used up, and the net product is what remains. All three are money values for one year measured in ₹ crore. The net figure is the truer measure of what the economy gained during the year, since it counts only the output available over and above what was needed to keep the capital stock intact. Fig. 19.4 shows the two side by side.
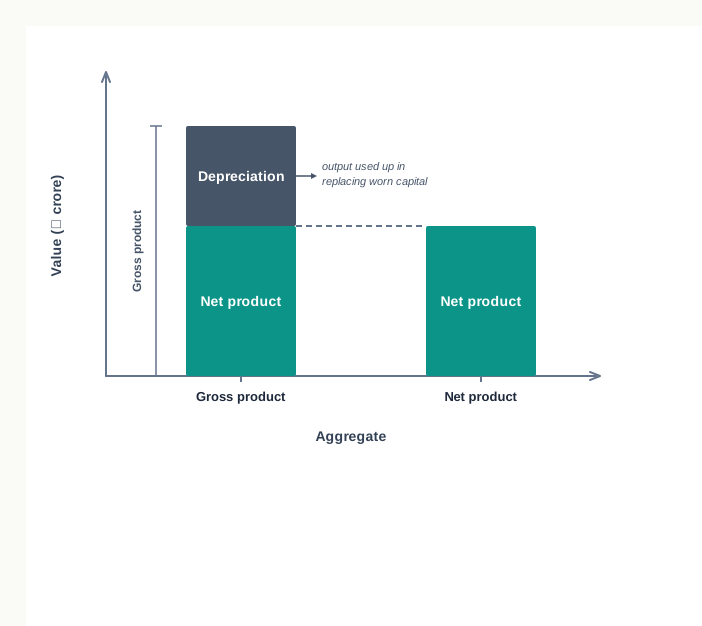
Fig. 19.4 – Gross product and net product.
The same distinction runs through investment. Gross investment is the whole of a year’s expenditure on capital goods; net investment, or net capital formation, is what is left after depreciation is met. Only net investment enlarges the capital stock. If gross investment exactly equals depreciation the stock is merely being maintained, and if it falls short the stock is shrinking even though new machines are being bought. Fig. 19.5 traces the stock through a year.
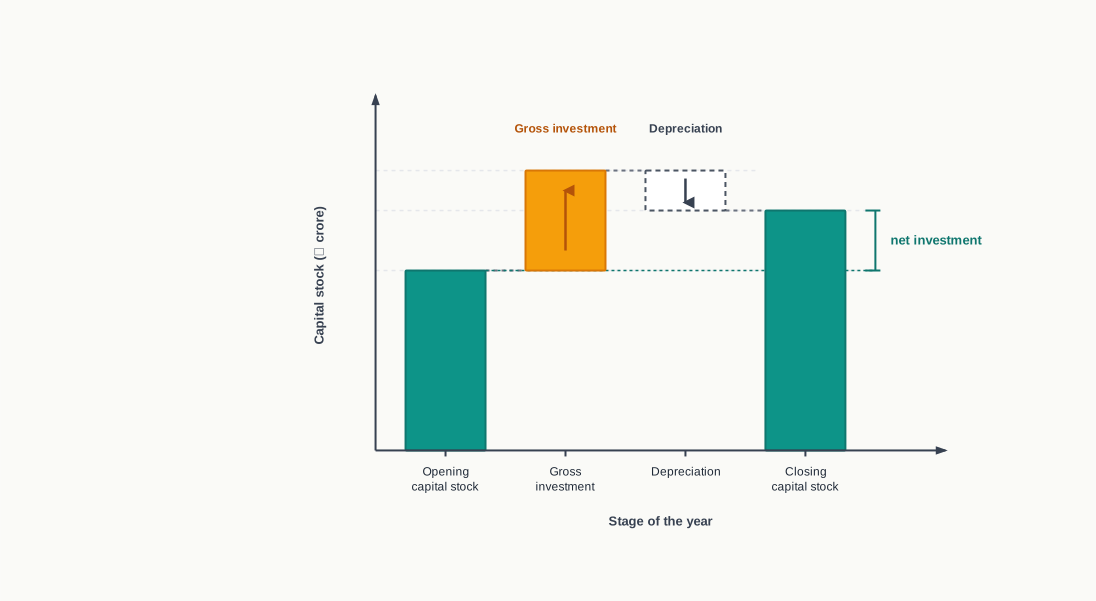
Fig. 19.5 – Capital stock through the year.
The three relations established so far can be applied one after another to move between any two aggregates, as SE 19.4 shows.
The main points of difference between the gross and the net aggregates are set out below.
19.4 The Eight National Income Aggregates
Three cuts have now been made through the same year’s output. The first asked whether we are measuring the product of the territory or the income of the residents. The second asked whether the valuation is at the prices buyers paid or at the earnings the factors received. The third asked whether the capital used up in production has been deducted. Each cut divides the output two ways, and since the three cuts are independent, together they yield eight aggregates.
Every one of the eight measures the same year’s production. They differ only in which question they answer, and any one of them can be reached from any other by making the adjustments the cuts define. Table 19.1 sets out the family.
The three adjustments that carry us from one cell of the table to another are the three we have already established. Net factor income from abroad moves us between domestic and national; net indirect taxes move us between market prices and factor cost; depreciation moves us between gross and net. Fig. 19.6 shows the eight aggregates arranged on these three cuts.
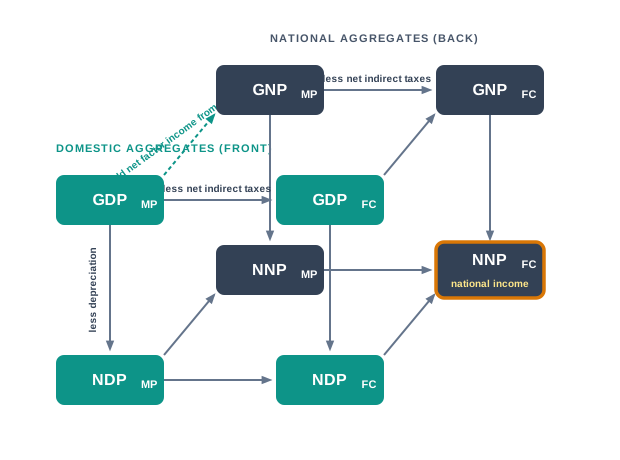
Fig. 19.6 – The eight aggregates on three cuts.
19.4.1 Aggregates At Market Prices
The natural starting point is the output of the territory, valued at the prices at which it was actually sold and before any deduction for capital used up.
Because it is gross, it does not show how much of the year’s output was merely replacing worn capital. Because it is domestic, it counts production by residents and non-residents alike, so long as it took place inside the territory. It is the widest and most commonly quoted of the eight, and the one from which the others are most often derived.
Adding the net factor income from abroad shifts the coverage from the territory to the residents.
\[\text{GNP}_{MP} = \text{GDP}_{MP} + \text{Net Factor Income from Abroad}\]
Both terms are money values for a year in ₹ crore. Since the net factor income may be of either sign, gross national product may stand above or below gross domestic product. In a closed economy, where no factor income crosses the border, the two are equal.
Deducting depreciation from either figure gives its net counterpart. Net domestic product at market prices is the market value of final goods and services produced within the domestic territory during a year after allowing for depreciation, and net national product at market prices is the corresponding figure for the residents of the country.
\[\text{NDP}_{MP} = \text{GDP}_{MP} - \text{Depreciation}\]
\[\text{NNP}_{MP} = \text{GNP}_{MP} - \text{Depreciation}\]
Net domestic product at market prices measures the output actually available to the economy for consumption and for adding to its capital stock. Net national product at market prices measures the same thing for the residents, and is the better guide to long-run growth than the gross figure, because it counts only what the economy gained over and above keeping its capital intact.
19.4.2 Aggregates At Factor Cost
The four aggregates just described value output at the prices buyers paid. Deducting net indirect taxes from each of them re-values the same output as the earnings of the factors that produced it.
\[\text{GDP}_{FC} = \text{GDP}_{MP} - \text{Net Indirect Taxes}\]
The same subtraction applied to the national aggregate gives gross national product at factor cost, which is the sum of the earnings of the factors of production owned by normal residents, wherever those factors were employed, again before any allowance for depreciation.
\[\text{GNP}_{FC} = \text{GNP}_{MP} - \text{Net Indirect Taxes}\]
Taking depreciation out of the gross domestic figure gives the aggregate that lies at the centre of the whole factor-cost family.
\[\text{NDP}_{FC} = \text{GDP}_{FC} - \text{Depreciation}\]
Because it is a factor-cost figure, it can be built up directly from the incomes it consists of. Three heads exhaust it:
- Compensation of employees — all payments made by producers to their employees in return for labour service, comprising wages and salaries in cash, payments in kind and the employers’ contributions to social security schemes.
- Operating surplus — the sum of property income and income from entrepreneurship, that is, rent, royalty, interest and profit earned by those who own the factors other than labour.
- Mixed income — income that is part labour income and part property income, arising where the two cannot be separated, as in the earnings of own-account workers such as street vendors, small farmers, doctors in private practice and small handicraft producers.
\[\text{NDP}_{FC} = \text{Compensation of Employees} + \text{Operating Surplus} + \text{Mixed Income}\]
Each term is a money value for one year in ₹ crore, and the sum is the total factor income generated inside the territory, whether it accrued to residents or to non-residents. Fig. 19.7 shows the three heads stacked.
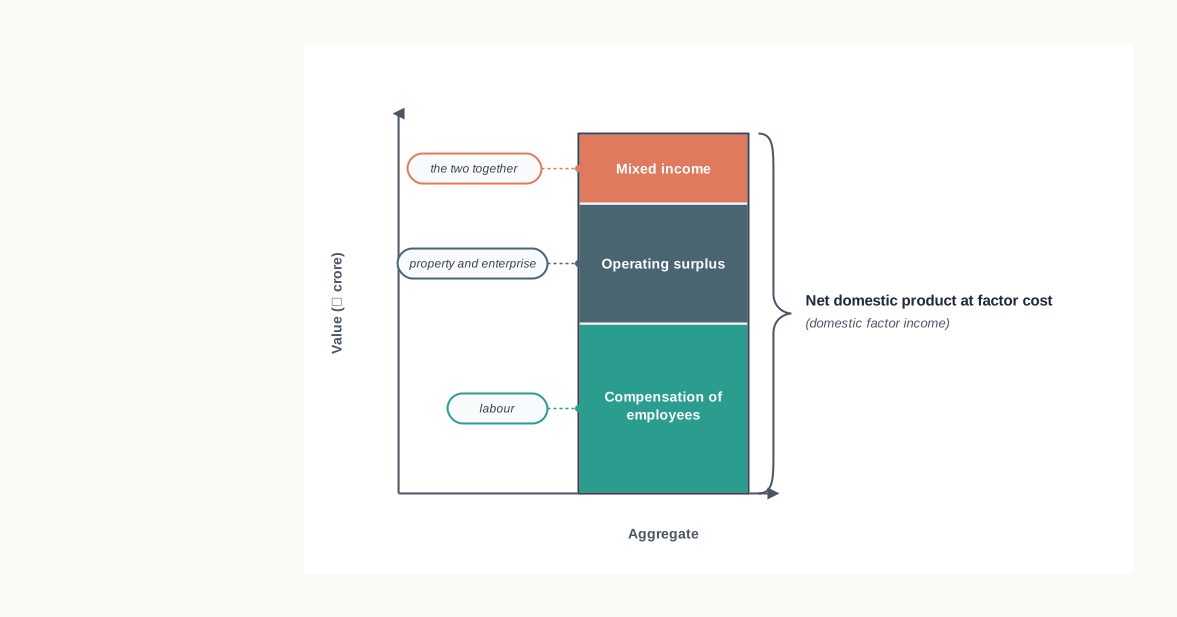
Fig. 19.7 – Components of domestic factor income.
19.4.3 Net National Product At Factor Cost Or National Income
The eighth aggregate is the one the subject means when it says national income without qualification. It is national in coverage, net of depreciation and valued at factor cost, so it answers the question the other seven only approach: how much did the residents of this country actually earn from a year’s production?
It can be reached along either of two routes, and both give the same figure. Adding the net factor income from abroad to domestic factor income shifts the coverage from the territory to the residents.
\[\text{NNP}_{FC} = \text{NDP}_{FC} + \text{Net Factor Income from Abroad}\]
Alternatively, deducting depreciation from the gross national figure at factor cost takes out the capital used up.
\[\text{NNP}_{FC} = \text{GNP}_{FC} - \text{Depreciation}\]
In both, the terms are money values for one year in ₹ crore. Where the net factor income from abroad is zero, national income and domestic factor income coincide; where it is negative, national income falls below domestic factor income, and where positive, above it.
National income is the sum of compensation of employees, operating surplus and mixed income accruing to the normal residents of a country. This is why it is the aggregate preferred for judging the real earning capacity of an economy. Because it is measured at factor cost, a change in the rate of an indirect tax leaves it untouched, whereas the market-price aggregates rise with the tax though not a unit more has been produced. That steadiness also makes it the safest basis for comparing income levels across countries whose tax structures differ.
The same aggregate can be built up from the factor incomes themselves, as SE 19.6 shows.
19.5 Interrelationship Among The Aggregates
The eight aggregates are not eight separate estimates. They are one quantity of output looked at from eight positions, and any one of them can be reached from any other by making the adjustments that separate the two positions. Only three adjustments exist, and each is reversible.
- Net factor income from abroad — added when moving from a domestic aggregate to the corresponding national aggregate, deducted when moving back.
- Depreciation — deducted when moving from a gross aggregate to the corresponding net aggregate, added back when moving from net to gross.
- Net indirect taxes — deducted when moving from a market-price aggregate to the corresponding factor-cost aggregate, added back when moving from factor cost to market prices.
Fig. 19.8 arranges the eight aggregates so that each adjustment becomes a single step in one direction.
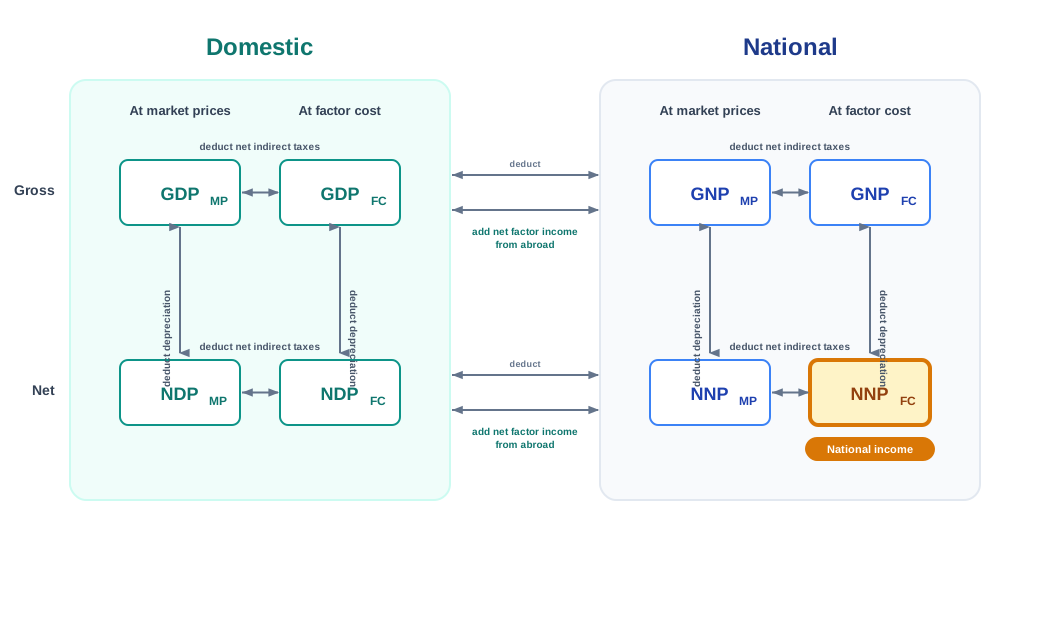
Fig. 19.8 – Conversions between the eight aggregates.
The map shows why the same aggregate can be reached by more than one route. To move from gross domestic product at market prices to national income, three steps are needed, and it makes no difference to the answer whether depreciation or net indirect taxes is deducted first. What does matter is that each intermediate figure is named correctly, because an intermediate line carries a name of its own and an examiner reads the names.
The Conversions In Summary
Table 19.2 collects the single-step conversions, together with the three-step conversion that is asked for most often.
Every relation in the table is one of the three adjustments applied once. Reading a row from right to left reverses the sign of the adjustment, so a table of seven rows in fact supplies fourteen conversions.
The Aggregates As Stacks Of Components
There is a second way of seeing the same relationships. Since every aggregate is built from the same underlying factor incomes, each can be drawn as a stack in which the three adjustments appear as blocks added on top. Fig. 19.9 draws all six of the most used aggregates side by side on this plan.
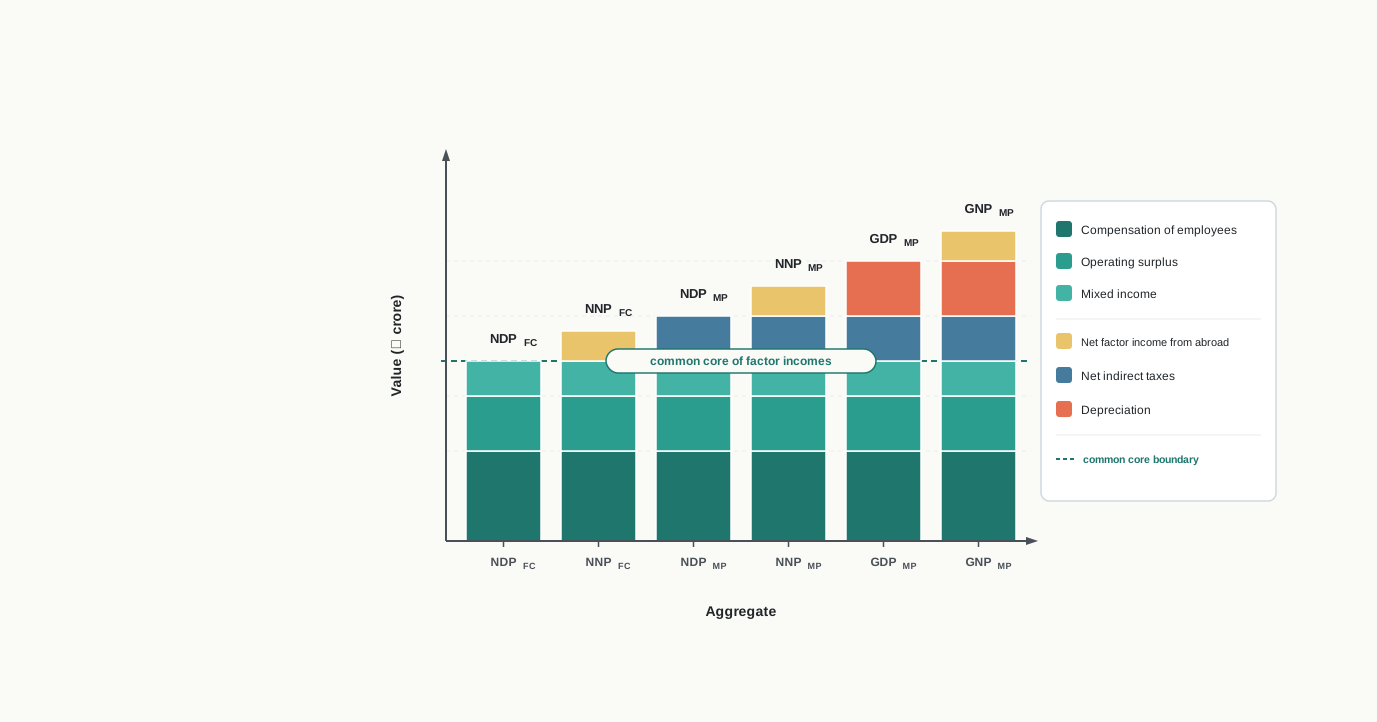
Fig. 19.9 – Aggregates as stacks of components.
Drawn this way, the point of the whole exercise becomes plain. The three factor income blocks at the base are the real income of the year. Everything stacked above them is an accounting adjustment, and choosing an aggregate amounts to choosing which of those adjustments the question requires.
Working Backwards
Examination questions frequently give the aggregate at one end of the map and ask for the one at the other, or supply several aggregates and ask for a missing adjustment. SE 19.7 works from national income outward.
SE 19.8 shows the second type, in which the adjustment itself is the unknown.
19.6 Transfer Payments And National Disposable Income
The aggregates built so far all measure production. Every rupee counted in them was paid to somebody for contributing to the year’s output. But a great many payments in an economy are made without anything being produced in return, and the income a country actually has at its disposal depends on these payments as well as on what it produced.
This section takes up those payments and the aggregate they give rise to.
19.6.1 Transfer Payments
A wage is paid because labour was supplied; interest is paid because capital was lent. In each case the payment moves in one direction and a factor service moves in the other. A pension paid to a retired person moves in one direction only. The recipient supplies nothing to the payer in the current period, and no output comes into existence on account of the payment.
Old-age pensions, unemployment relief, scholarships, gifts, donations, fines and taxes are all transfer payments. They alter who holds purchasing power without altering how much output exists to be purchased. A pension paid by a government to a retired employee moves money from the government to the household; it does not add a single good or service to the year’s production.
Because they are excluded from national income, transfer payments must be identified and set aside whenever an aggregate is being computed. The distinction that decides the treatment is the one below.
Current And Capital Transfers
Transfer payments are of two kinds, and only one of them matters for the aggregates of this chapter.
Only current transfers enter the disposable income aggregates, because only they add to the income a household or a country can spend in the year. Once they are brought in, a distinction opens up between income earned and income available.
\[\text{Disposable Income} = \text{Income} + \text{Net Current Transfers}\]
Both terms are money values for one year, measured in ₹ crore, and net current transfers means current transfers received less current transfers paid. Disposable income may therefore be greater or smaller than income itself, according as the net figure is positive or negative.
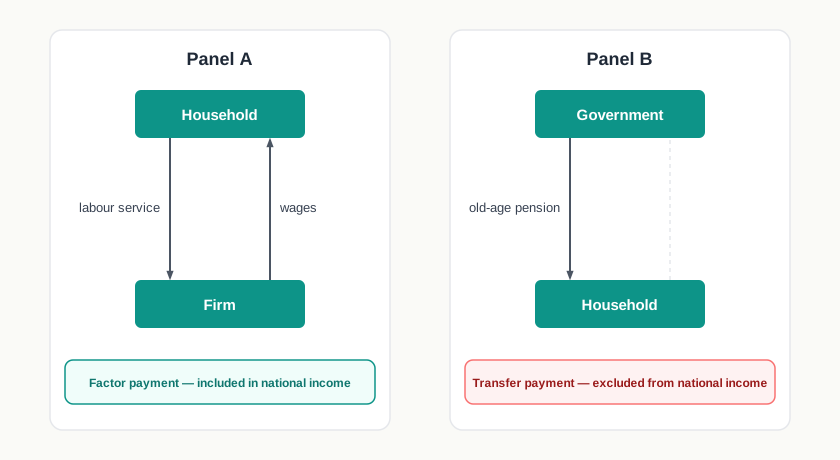
Fig. 19.10 – Factor payment and transfer payment compared.
19.6.2 National Disposable Income
What holds for a household holds for a country. A country receives gifts, grants and donations from the rest of the world and makes such payments to it, and these current transfers change what the country as a whole can spend without changing what it produced.
Two points fix the definition. First, the national income aggregate taken is at market prices and not at factor cost, because what a nation can spend includes the indirect taxes collected on its purchases. Second, only transfers with the rest of the world count. A transfer from one sector to another within the country raises the income of the receiving sector and lowers that of the paying sector by exactly the same amount, so such transfers cancel out and leave the national total untouched.
Since the underlying aggregate may be taken gross or net of depreciation, national disposable income comes in two forms. Gross national disposable income includes depreciation; net national disposable income excludes it, and the two differ by depreciation alone.
\[\text{GNDI} = \text{GNP}_{MP} + \text{Net Current Transfers from the Rest of the World}\]
\[\text{NNDI} = \text{NNP}_{MP} + \text{Net Current Transfers from the Rest of the World}\]
Here all terms are money values for one year, measured in ₹ crore. The result is read as the total the country may dispose of in the year — the amount available to be spent on consumption or set aside as saving, whatever its origin in production or in transfers.
SE 19.9 computes the gross figure, starting one step further back.
SE 19.10 asks for the net figure and supplies one item that is not needed.
19.7 Disposable Income Aggregates Of The Private Sector
National income tells us what the residents of a country earned. It does not tell us how much of that earning reached the households who do the spending. Part of it is earned by the government’s own enterprises, part is kept back by companies, part is taken away in taxes; and some income that never entered national income at all — interest on the national debt, pensions, remittances — does reach households.
Three further aggregates trace that journey. Each is narrower than the one before it, and each answers a question about who may actually spend the income. Table 19.3 sets out the adjustments in advance, and the subsections that follow explain them.
19.7.1 Private Income
The first step separates the private sector from the government. Some factor income earned inside the country is earned by the government itself and stays with it, so it is not available to private hands however large it may be. At the same time, the private sector receives current transfers that no factor service earned.
Written as a relation, it is national income adjusted in five particulars.
\[\text{Private Income} = \text{NNP}_{FC} - \text{Income Accruing to the Government} + \text{Transfers to the Private Sector}\]
The two deductions are:
- Income from property and entrepreneurship accruing to government administrative departments — the rent, interest and profit earned by the government in its own right, which the government retains.
- Savings of non-departmental enterprises of the government — the profits that public sector undertakings keep back for their own expansion instead of passing on.
The three additions are:
- Interest on the national debt — interest paid by the government to the public on its borrowings, which is conventionally treated as a transfer payment and so lies outside national income.
- Net current transfers from the government — pensions, unemployment allowances, scholarships and similar payments made by the government to households.
- Net current transfers from the rest of the world — gifts, grants and remittances received from abroad, less such payments made to abroad.
Private income is a pre-tax figure. It shows the whole of what the private sector had before the government took anything back from it, which is why the size of private income tells a government how much tax burden the private sector can be asked to bear.
19.7.2 Personal Income
The second step separates households from the firms they own. What a company earns is not what its shareholders receive. Part of the profit is kept back in the business, part goes to the government as tax on profits, and part of the wage bill is paid over to social security funds rather than to the employee.
\[\text{Personal Income} = \text{Private Income} - \text{Undistributed Profits} - \text{Corporate Profit Tax} - \text{Net Retained Earnings of Foreign Companies} - \text{Social Security Contributions of Enterprises}\]
Each deduction is an income that was earned but not received by any person.
- Undistributed profits — the part of company profit retained for further investment instead of being distributed among shareholders, also called retained earnings.
- Corporate profit tax — the tax levied on company profits, which accrues to the government before any distribution can take place.
- Net retained earnings of foreign companies — earnings of foreign companies operating here that are kept back rather than paid over, which form part of private income but reach no person in this country.
- Contribution of enterprises towards social security schemes — payments made by employers into provident and insurance funds on behalf of employees, which the employee does not receive in the current period.
Personal income is therefore a measure of the purchasing power actually placed in people’s hands, and it is the natural starting point for studying how income is distributed among individuals and how the burden of personal taxes falls on them.
19.7.3 Personal Disposable Income
Even what a household receives is not all of it free to spend. The government takes personal taxes out of it and collects various fees and fines besides. What survives both is the household’s own to dispose of.
\[\text{Personal Disposable Income} = \text{Personal Income} - \text{Personal Taxes} - \text{Miscellaneous Receipts of the Government Administrative Departments}\]
Personal taxes are direct taxes on persons, such as income tax and wealth tax. Miscellaneous receipts are the fees, fines and similar payments households make to government departments. Both are compulsory, so neither is available for the household to allocate.
Because whatever is not spent is by definition saved, the same aggregate can also be read from the household’s side of the account.
\[\text{Personal Disposable Income} = \text{Consumption Expenditure of Households} + \text{Household Savings}\]
All terms are money values for one year, measured in ₹ crore. Read this way, personal disposable income is the best available measure of the potential demand for goods and services in an economy, which is why producers watch it when planning what to produce. Fig. 19.11 traces the whole descent from national income.
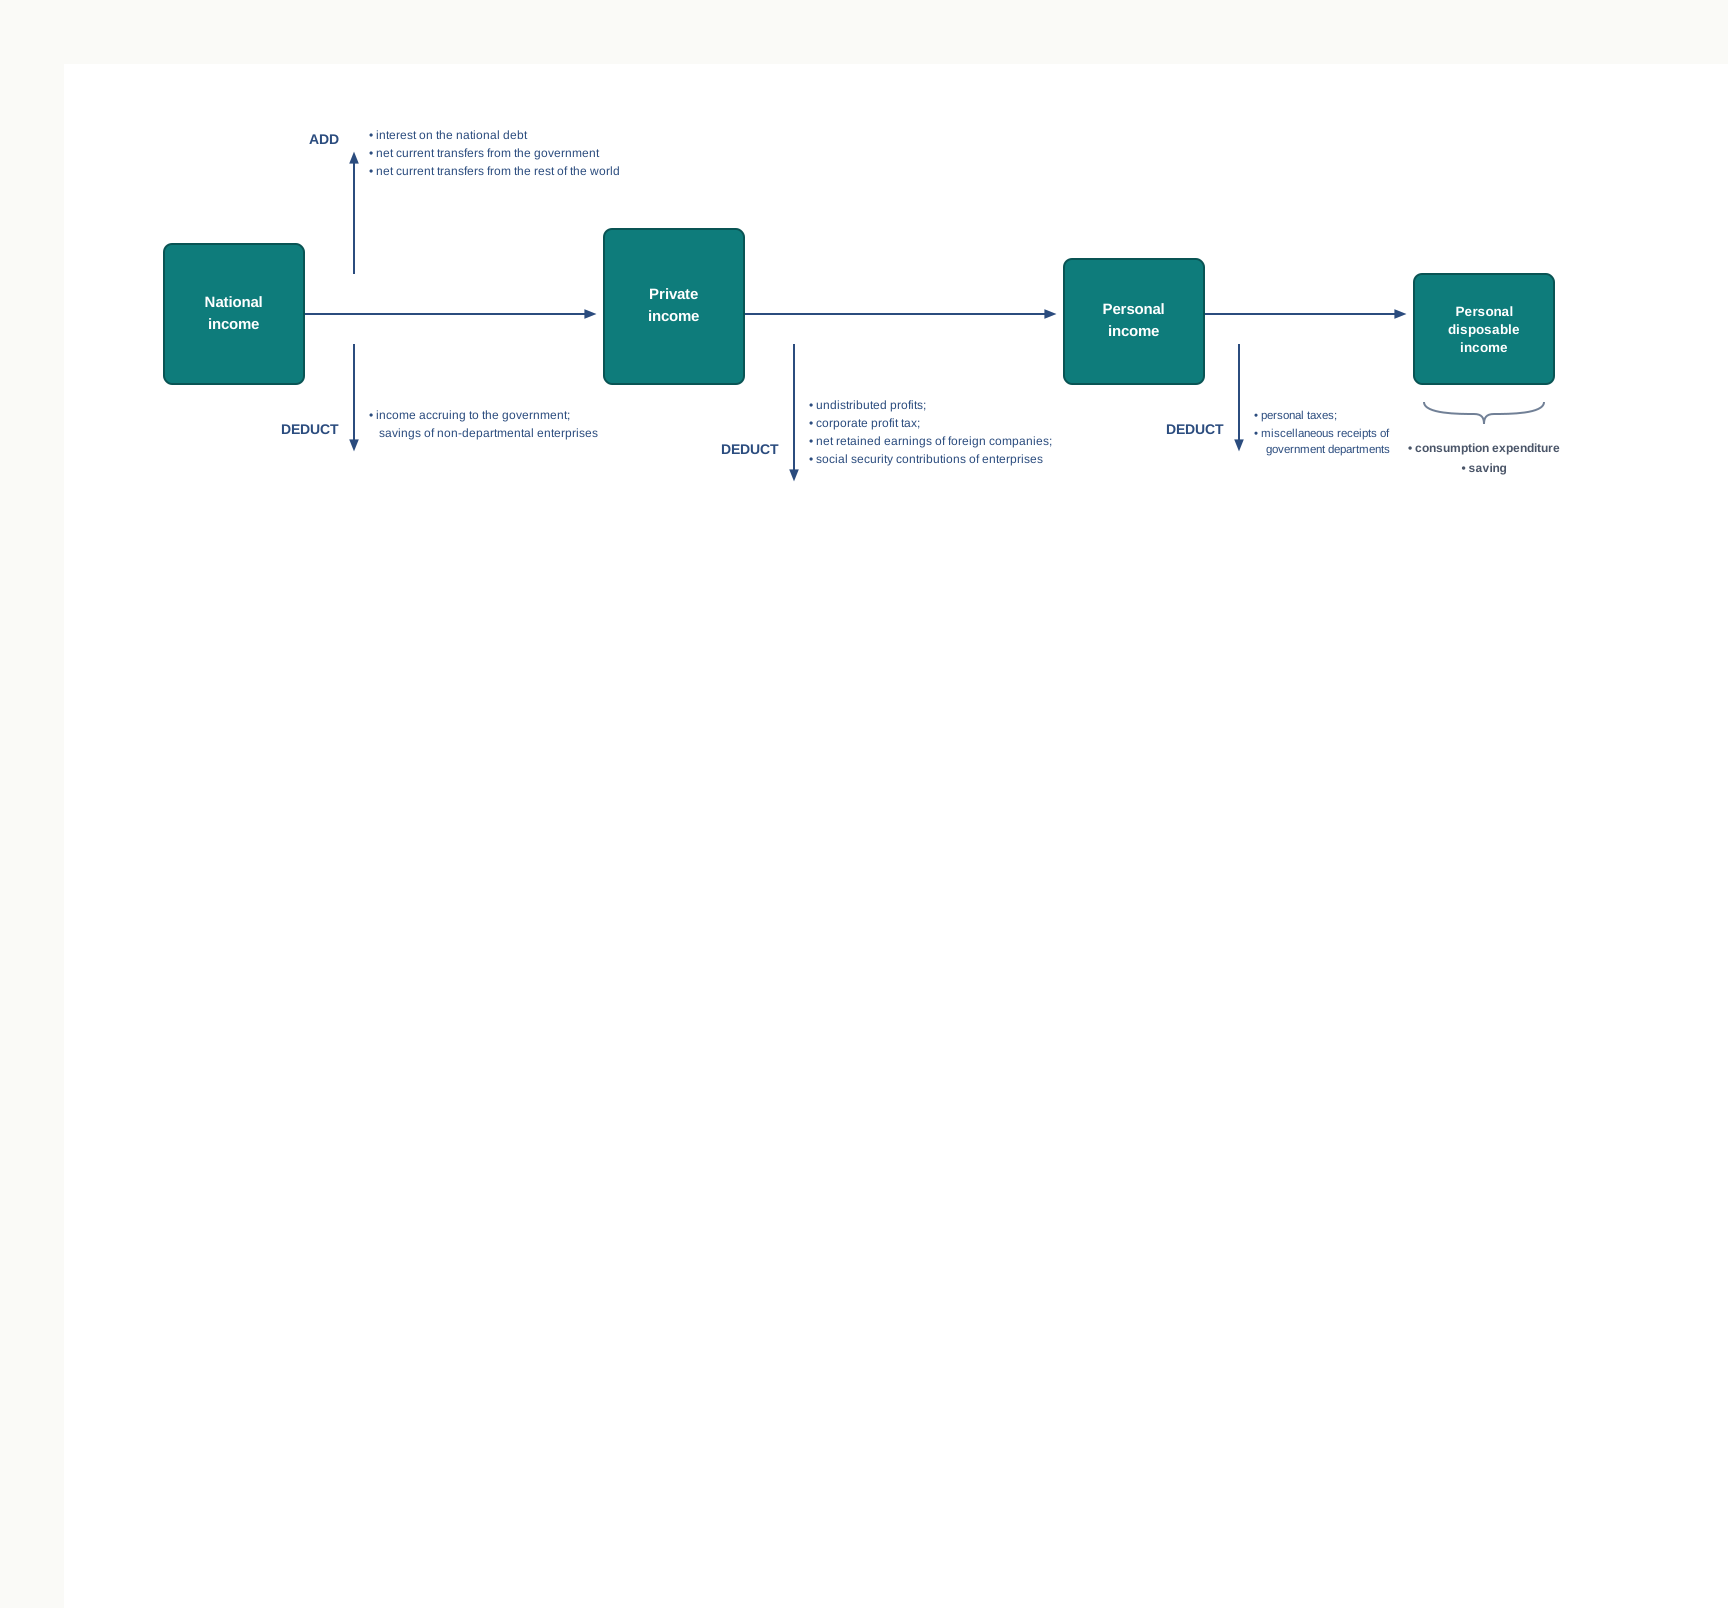
Fig. 19.11 – From national income to personal disposable income.
19.8 Per Capita Income
Every aggregate so far has been a total for the whole economy. A total tells us how large an economy is; it tells us nothing about how well off the people in it are. Two countries with the same national income are in very different positions if one has ten crore residents and the other has a hundred crore. To say anything about the average resident, the total has to be spread over the people who share it.
The measure asks how much income there would be for each person if the year’s national income were shared equally, and it is the standard way of comparing living standards across countries of unequal size.
\[\text{Per Capita Income} = \dfrac{\text{National Income}}{\text{Population}}\]
Here national income is \(\text{NNP}_{FC}\) for the year, measured in ₹ crore, and population is the mid-year population, measured in crore. The result is a figure in rupees per person per year. It is an average and nothing more: it says what each person would have received under an equal division, not what any actual person received.
Income Growth Against Population Growth
Because population sits in the denominator, per capita income depends on two rates of change and not one. It rises only where national income grows faster than population. Where the two grow at the same rate it stands still, and where population grows faster it falls even though the economy has produced more than before. SE 19.14 sets out that case, and Fig. 19.12 draws it.
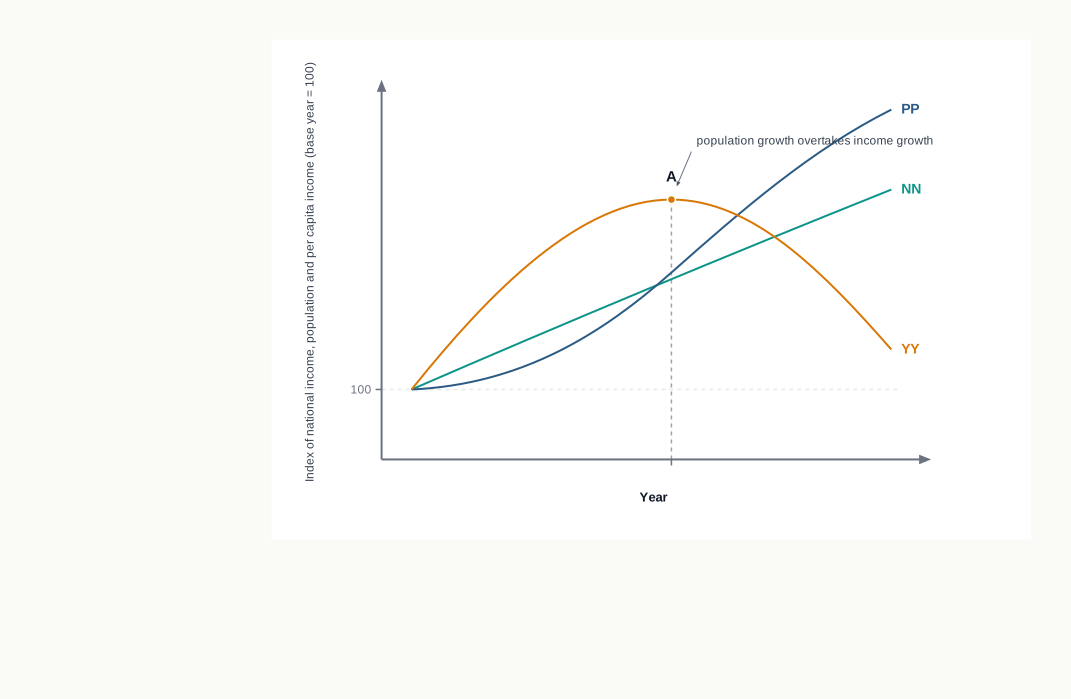
Fig. 19.12 – Income growth against population growth.
At Current And At Constant Prices
Per capita income, like the aggregate it comes from, may be worked out at current prices or at constant prices. Taking national income at current prices in the numerator gives per capita income at current prices, which moves with prices as well as with output. Taking real national income — national income at constant prices — gives real per capita income, from which the effect of price change has been removed.
It is real per capita income that is traditionally used as an index of economic welfare and of economic development, because it alone indicates the average quantity of goods and services actually available per person. The two versions of the figure can move quite differently in a year of rapid price rise, and Section 19.9 takes up the distinction between current and constant prices in full.
19.9 Real And Nominal Gross Domestic Product
Gross domestic product is a money value, and a money value is a quantity multiplied by a price. It can therefore change for two quite different reasons. The economy may have produced more goods and services than before, or it may have produced exactly the same goods and services and sold them at higher prices. The first is growth; the second is inflation wearing the appearance of growth.
Anyone using national income to judge how an economy is performing has to separate the two. The separation is made by fixing the prices at which output is valued.
In the nominal figure, output and prices both belong to the current year. In the real figure, the output belongs to the current year but the prices are frozen at their base-year level, so the same basket is valued the same way in every year of the series. Since prices are held still, a change in real gross domestic product can only mean a change in the physical quantities of goods and services produced. That is why the real figure is taken as the reliable index of the growth of an economy, and the nominal figure is not.
The idea is easiest to see in the extreme case. Suppose an economy produces exactly the same goods in the same quantities in two successive years, but every price in it doubles. Its nominal gross domestic product doubles, although not one extra unit of anything has been made. Its real gross domestic product, valued at base-year prices throughout, does not change at all — which is the correct answer, because the economy’s production has not changed.
Converting The One Into The Other
To move from the nominal figure to the real one, the effect of price change has to be stripped out, and this is done with the help of a price index.
\[\text{Real GDP} = \dfrac{\text{Nominal GDP}}{\text{Price Index of the Current Year}} \times 100\]
Here nominal gross domestic product is the current year’s money value in ₹ crore, and the price index is a pure number with the base year set at 100. The result is the current year’s output valued at base-year prices, again in ₹ crore. Where the current index stands above 100, prices have risen since the base year and the real figure comes out below the nominal one. Where it stands below 100, prices have fallen and the real figure exceeds the nominal one. In the base year itself the index is 100 and the two figures coincide.
Fig. 19.13 shows the two series moving together over a run of years.
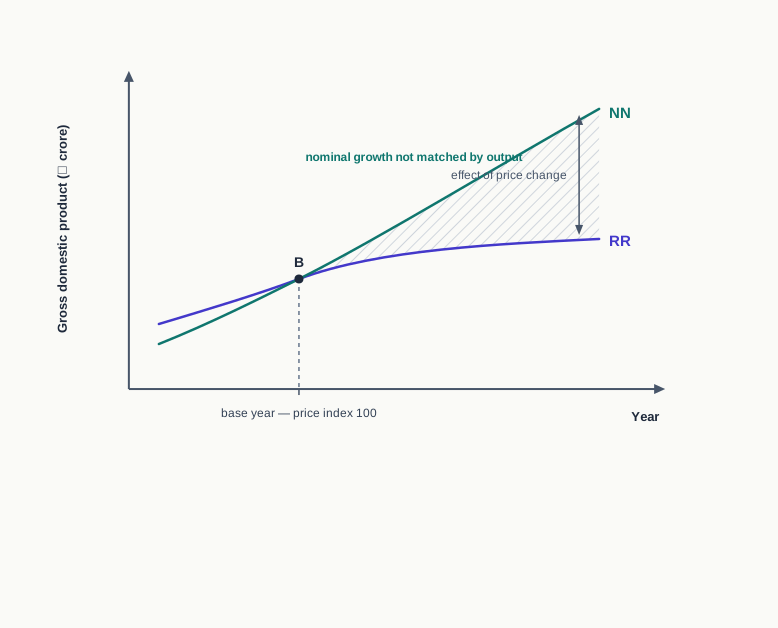
Fig. 19.13 – Nominal and real gross domestic product.
The main points of difference between the two measures are set out below.
19.10 Gross Domestic Product And Economic Welfare
The aggregates of this chapter were built to measure production. They are used for something more ambitious: to judge whether a country’s people are better off this year than last, and better off than the people of another country. The last question of the chapter is how far a measure of production can carry that weight.
19.10.1 The Concept Of Economic Welfare
Welfare means a sense of satisfaction, of well-being, of being better off. Taken as a whole it has two parts, and only one of them is the business of economics.
Non-economic welfare covers everything else that makes life go well and cannot be bought — the affection of a family, the respect of neighbours, moral satisfaction, the security of living under a just government, the feeling of patriotism. These are social, political and moral values, and no aggregate measured in rupees reaches them.
The division matters because national income can only speak to the first part. Whatever it establishes about economic welfare, it establishes nothing at all about the rest, and total welfare is the sum of both.
19.10.2 Gross Domestic Product As An Indicator Of Economic Welfare
Traditionally, economic welfare has been measured by national income, and the reasoning behind that practice is straightforward. Economic welfare depends on the goods and services available to satisfy people’s wants. A larger national income means more goods and services produced, and therefore more available to be consumed. On this reasoning a rise in national income should mean a rise in economic welfare.
The practice needs two corrections before it can be relied upon even this far.
- Take the figure per head, not in total — what matters for welfare is the availability of goods and services on average, and a total may rise while the average falls if population rises faster. A country whose output grows by a tenth while its population grows by a fifth has a lower standard of living than before.
- Take the figure in real terms, not nominal — a money income that has risen only because prices have risen buys no more than before. Only national income at constant prices measures the quantity of goods actually available.
Applying both corrections gives the measure conventionally used: real per capita income. It indicates the average quantity of goods and services available to a person during a year, and a rise in it is taken to mean an improvement in the standard of living and in economic development alike.
19.10.3 Limitations Of Gross Domestic Product As A Welfare Indicator
A rise in real per capita income is not by itself a sufficient condition for a rise in economic welfare. Welfare depends on a number of things the figure never sees, and it also counts a number of things that add nothing to welfare. The major limitations are these.
- Distribution of income — the average says nothing about how the income is shared. If the whole of an increase accrues to those who are already rich, economic welfare of the people in general need not rise, and a widening inequality may reduce it. A given per capita income is consistent with widely different degrees of well-being.
- Composition of output — what is produced matters as much as how much is produced.
- Consumer goods satisfy wants today, while capital goods satisfy them only in future. Where output has risen because more machines were built and fewer consumer goods, current welfare does not rise in proportion.
- Civilian goods such as food and clothing add directly to welfare; goods produced for defence and security do not satisfy consumption wants at all. An increase in gross domestic product traceable to armaments leaves welfare where it was.
- Manner of increase in gross domestic product — how the extra output was obtained is part of the reckoning. Output raised by longer working hours, by employing children, by unhealthy and polluted conditions inside factories, or by the reckless exhaustion of natural resources, buys its increase at a cost to the people that the figure does not record. An increase in environmental pollution may reduce welfare even as it raises measured output.
- Expenditure on regrettable necessities — some spending is forced on people and yields no satisfaction of its own. Fares paid to travel to work, and medical bills incurred because city air is foul, are counted in gross domestic product like any other expenditure, though nobody is better off for having made them.
- Monetisation of goods and services — gross domestic product counts only what is exchanged for money. When work formerly done at home begins to be bought in the market, the same work is now recorded and the figure rises, although the amount of goods and services available has not changed at all.
- Exclusion of some items from gross domestic product — several things that plainly affect welfare are left out.
- Leisure — shorter working hours and more rest make people better off, but the amount of leisure enjoyed appears nowhere in the estimates.
- Non-market transactions — services rendered within the household and vegetables grown in a kitchen garden are not exchanged at market prices, and so are excluded, though they add to well-being.
- Quality of life — life expectancy, child mortality, adult literacy, years of schooling and the ordinary liveability of a city all bear on welfare and none of them is in the figure.
The limitations run in both directions, and Fig. 19.14 sets them out that way.
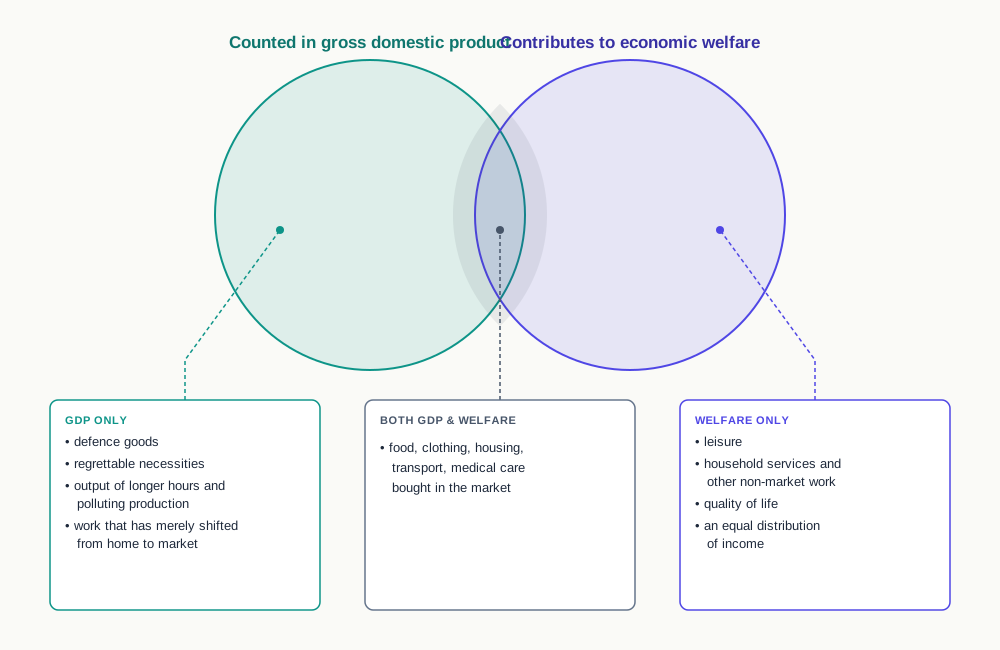
Fig. 19.14 – Gross domestic product and economic welfare.
To sum up, there are goods and services counted in gross domestic product that do not add to economic welfare, and there are goods and services outside it that do. The aggregate remains the best single indicator available, and real per capita income the best form of it; but it is an indicator of production, and it must be read alongside evidence on distribution, on the environment and on the quality of life before anything is concluded about how well a people live.
19.11 Summary
Throughout this summary, NFIA stands for net factor income from abroad and NIT for net indirect taxes. Every money value is a figure for one year, measured in ₹ crore, unless stated otherwise.
- Domestic product is the value of final goods and services produced within the domestic territory of a country in a year, by residents and non-residents alike. National product is the value of final goods and services produced by the normal residents of a country, whether they operate inside the territory or outside it.
- Domestic territory is the geographical territory administered by a government, extended to include the country’s ships and aircraft operating between countries, its embassies and consulates abroad, and rigs and fishing vessels operated by its residents in international waters. A normal resident is one whose centre of economic interest lies in the country; residence and not citizenship is the test.
- Net factor income from abroad is the factor income received by residents from the rest of the world less the factor income paid to the rest of the world. It may be positive, negative or zero, and it is the whole of the difference between the two products. \[\text{National Product} = \text{Domestic Product} + \text{NFIA}\]
- Market price is the price the buyer pays; factor cost is the sum the factors of production receive. Indirect taxes raise market price above factor cost and subsidies pull it below, and net indirect taxes are indirect taxes minus subsidies. \[\text{Market Price} = \text{Factor Cost} + \text{Indirect Taxes} - \text{Subsidies}\] \[\text{Aggregate at Factor Cost} = \text{Aggregate at Market Prices} - \text{NIT}\]
- Depreciation, or consumption of fixed capital, is the loss in the value of fixed capital assets during the year through normal wear and tear in production. A gross aggregate includes it; a net aggregate has been reduced by it. \[\text{Net Product} = \text{Gross Product} - \text{Depreciation}\] \[\text{Net Investment} = \text{Gross Investment} - \text{Depreciation}\]
- The three cuts — domestic or national, market prices or factor cost, gross or net — are independent, and taken together they give eight aggregates: \(\text{GDP}_{MP}\), \(\text{GNP}_{MP}\), \(\text{NDP}_{MP}\), \(\text{NNP}_{MP}\), \(\text{GDP}_{FC}\), \(\text{GNP}_{FC}\), \(\text{NDP}_{FC}\) and \(\text{NNP}_{FC}\).
- Within the market-price group, the aggregates are connected as follows, where depreciation is the consumption of fixed capital for the year. \[\text{GNP}_{MP} = \text{GDP}_{MP} + \text{NFIA}\] \[\text{NDP}_{MP} = \text{GDP}_{MP} - \text{Depreciation}\] \[\text{NNP}_{MP} = \text{GNP}_{MP} - \text{Depreciation}\]
- Each factor-cost aggregate is its market-price counterpart less net indirect taxes. \[\text{GDP}_{FC} = \text{GDP}_{MP} - \text{NIT}\] \[\text{GNP}_{FC} = \text{GNP}_{MP} - \text{NIT}\] \[\text{NDP}_{FC} = \text{GDP}_{FC} - \text{Depreciation}\]
- Net domestic product at factor cost is also called domestic factor income, and being a sum of factor incomes it can be built directly from its three components. \[\text{NDP}_{FC} = \text{Compensation of Employees} + \text{Operating Surplus} + \text{Mixed Income}\]
- Compensation of employees is all payment for labour service, in cash and in kind, including the employer’s contribution to social security.
- Operating surplus is rent, interest and profit taken together.
- Mixed income is the earnings of own-account workers and unincorporated enterprises, in which the labour and capital elements cannot be separated.
- National income is net national product at factor cost and nothing else. It is the sum of factor incomes earned by normal residents in a year after providing for depreciation, and it may be reached by either of two routes. \[\text{NNP}_{FC} = \text{NDP}_{FC} + \text{NFIA}\] \[\text{NNP}_{FC} = \text{GNP}_{FC} - \text{Depreciation}\]
- Any aggregate can be reached from any other by applying the three adjustments, each of which reverses its sign when the direction of travel reverses. The order of the adjustments does not affect the answer, but every intermediate figure must be named correctly.
- Transfer payments are payments received without any contribution to current output. They are unilateral, they create no output, and they are excluded from national income. A current transfer is paid out of the current income of the payer and adds to the current income of the receiver; a capital transfer is paid out of wealth and adds to wealth.
- Disposable income is income inclusive of all current transfers, and may exceed or fall short of income according as net current transfers are positive or negative. \[\text{Disposable Income} = \text{Income} + \text{Net Current Transfers}\]
- National disposable income is national income at market prices together with net current transfers received from the rest of the world. It is what the nation as a whole may spend or save, and transfers within the country cancel out and are excluded. \[\text{GNDI} = \text{GNP}_{MP} + \text{Net Current Transfers from the Rest of the World}\] \[\text{NNDI} = \text{NNP}_{MP} + \text{Net Current Transfers from the Rest of the World}\]
- Private income is the factor income accruing to the private sector from all sources, including retained corporate profits, together with current transfers from the government and from the rest of the world. It is a pre-tax figure. \[\text{Private Income} = \text{NNP}_{FC} - \text{Income from Property and Entrepreneurship Accruing to the Government} - \text{Savings of Non-departmental Government Enterprises} + \text{Interest on the National Debt} + \text{Net Current Transfers from the Government} + \text{Net Current Transfers from the Rest of the World}\]
- Personal income is the income actually received by persons and households, as factor income and as current transfers. The four deductions are incomes earned but not received by any person. \[\text{Personal Income} = \text{Private Income} - \text{Undistributed Profits} - \text{Corporate Profit Tax} - \text{Net Retained Earnings of Foreign Companies} - \text{Social Security Contributions of Enterprises}\]
- Personal disposable income is the part of personal income households are free to use as they like, and it is exhausted between consumption and saving. \[\text{Personal Disposable Income} = \text{Personal Income} - \text{Personal Taxes} - \text{Miscellaneous Receipts of the Government Administrative Departments}\] \[\text{Personal Disposable Income} = \text{Consumption Expenditure of Households} + \text{Household Savings}\]
- Per capita income is the average income of the normal residents of a country in a year, where national income is \(\text{NNP}_{FC}\) in ₹ crore, population is the mid-year population in crore, and the result is in rupees per person. It rises only where national income grows faster than population. \[\text{Per Capita Income} = \dfrac{\text{National Income}}{\text{Population}}\]
- Nominal gross domestic product values the current year’s output at the current year’s prices, so it moves with prices as well as with output. Real gross domestic product values the same output at base-year prices, so only quantities can move it, and it is therefore the reliable index of growth. \[\text{Real GDP} = \dfrac{\text{Nominal GDP}}{\text{Price Index of the Current Year}} \times 100\]
- A price index measures the change in prices between years, with the base year always set at 100. Where the current index exceeds 100 the real figure falls below the nominal figure, and in the base year itself the two are equal.
- Economic welfare is the material well-being derived from goods and services that can be purchased for money. Non-economic welfare covers the social, political and moral conditions of life, which no money measure reaches.
- National income is traditionally used as the index of economic welfare, in the corrected form of real per capita income — per head, because population may grow faster than output, and in real terms, because a money rise that is only a price rise buys nothing more.
- Real per capita income is nonetheless an imperfect index of economic welfare, for six reasons.
- Distribution of income — an average conceals how the income is shared, and rising inequality may reduce welfare.
- Composition of output — capital goods and defence goods raise the figure without satisfying current consumption wants.
- Manner of increase — output raised by longer hours, child labour, unhealthy conditions or environmental damage costs the people more than it gives them.
- Regrettable necessities — forced expenditures such as commuting fares and pollution-related medical bills are counted although they yield no satisfaction.
- Monetisation — work moving from the home to the market raises the recorded figure without raising the work actually done.
- Exclusions — leisure, non-market transactions and the indicators of quality of life lie outside the estimates altogether.
- The chapter’s spine is three distinctions, and every aggregate in it is a choice of one side of each.
19.12 Points To Ponder
- A country’s domestic product holds steady for a decade while its net factor income from abroad turns steadily more negative, because foreign-owned firms operating inside it are sending more profit home each year. Its territory is producing as much as ever, but its residents are earning less. Which of the two aggregates should such a government watch, and would your answer change if the foreign investment were also raising the country’s future capacity to produce?
- Depreciation is estimated rather than observed, so the gross aggregates rest on recorded transactions while the net aggregates rest partly on a judgement. The net figure is closer to what an economy really has available, and the gross figure is more reliably measured. Which should a country report as its headline number, and what is lost either way?
- Meals cooked at home add nothing to gross domestic product, but the same meals bought from a restaurant do. Should unpaid household work be valued and brought into the estimates? Consider what would be gained in accuracy, what would have to be assumed to put a price on it, and whose contribution the present treatment renders invisible.
- Transfer payments are excluded from national income because they answer to no production, yet a pension is entirely real income to the person who receives it. Is the exclusion a statement about what matters to people, or only about what this particular measure was built to count — and can a measure be blamed for the questions it was never designed to answer?
- Real per capita income could be raised by producing more armaments, by working longer hours, or by running factories in ways that foul the air. If growth of these kinds is possible, is it worth continuing to search for a single number that captures welfare, or would a country be better served by a small set of separate indicators that are allowed to disagree with one another?
- Every revision of the base year rewrites the whole measured history of an economy’s real growth, and the same decade can look faster or slower after the revision than before it. What weight should then be placed on statements comparing the growth of one decade with another, and how might an economist argue such comparisons are still worth making?
19.13 Objective Questions
- Gross national product at market prices is equal to: [1]
- Gross domestic product at market prices plus net indirect taxes
- Gross domestic product at market prices plus net factor income from abroad
- Gross domestic product at factor cost minus depreciation
- Net national product at market prices minus depreciation
- Given below are two statements marked as Assertion (A) and Reason (R). Read them carefully and choose the correct option. [1] Assertion (A): National income may be smaller than domestic factor income. Reason (R): Net factor income from abroad may be negative.
- Both Assertion (A) and Reason (R) are true, and Reason (R) is the correct explanation for Assertion (A).
- Both Assertion (A) and Reason (R) are true, but Reason (R) is not the correct explanation for Assertion (A).
- Assertion (A) is true and Reason (R) is false.
- Assertion (A) is false and Reason (R) is true.
- Fill in the blank: Indirect taxes minus subsidies are together known as ______. [1]
- State whether the following statement is true or false: A scholarship paid by the government to a student is included in national income because it adds to the student’s income. [1]
- Match the items in Column I with those in Column II. [1]
| Column I | Column II |
|---|---|
| a. Mixed income | i. Gross national product at market prices plus net current transfers received from the rest of the world |
| b. Personal disposable income | ii. Earnings in which the labour element and the capital element cannot be separated from each other |
| c. Gross national disposable income | iii. Consumption expenditure of households plus household savings |
19.14 Check Your Concepts
- Distinguish between a current transfer and a capital transfer, giving one example of each. [2]
- In an economy, gross national product at market prices is ₹64,000 crore, depreciation is ₹5,200 crore and net indirect taxes are ₹6,800 crore. Calculate national income, showing each step of the working. [3]
- Distinguish between real and nominal gross domestic product, and explain with an example why the real figure is the more reliable indicator of the growth of an economy. [4]
- ‘An increase in real per capita income is not by itself a sufficient condition for an increase in economic welfare.’ Evaluate this claim with reference to any four limitations of national income as an indicator of welfare. [6]
19.15 Case-Based Question
- Ravindra Textiles is a mill at Surat owned by residents of Sweden. It employs Indian workers, sells its cloth in India, and remits a part of its profit each year to its owners in Stockholm. The government also pays the mill a subsidy on every metre of a certain yarn it supplies to handloom weavers, so that the yarn can be sold below the price that would otherwise be charged.
- State, with a reason in each case, whether the profit remitted to Stockholm forms part of India’s domestic product, of India’s national income, or of both. [2]
- Explain how the subsidy affects the value of the mill’s yarn output measured at market prices as compared with the same output measured at factor cost. [2]