Chapter 20: Methods of Measuring National Income
An economy produces millions of different things in a year — wheat and steel, haircuts and bus rides, school lessons and software. No single physical measure can add them up. Yet a government framing its budget, a central bank setting interest rates and a citizen asking whether the country is better off than it was last year all need one figure that stands for the whole year’s production. National income is that figure, and someone has to measure it. In India the work is done by the National Statistical Office, which publishes estimates of national income for each financial year. The task is harder than it looks. Output comes from lakhs of enterprises, the same good passes through several hands before it reaches its final buyer, and a great deal of what is produced is never sold in a market at all. Economists have devised three routes to the same total — the value-added method, the income method and the expenditure method. This chapter explains how each of the three works, what each requires the estimator to leave in and leave out, and why all three should arrive at the same national income.
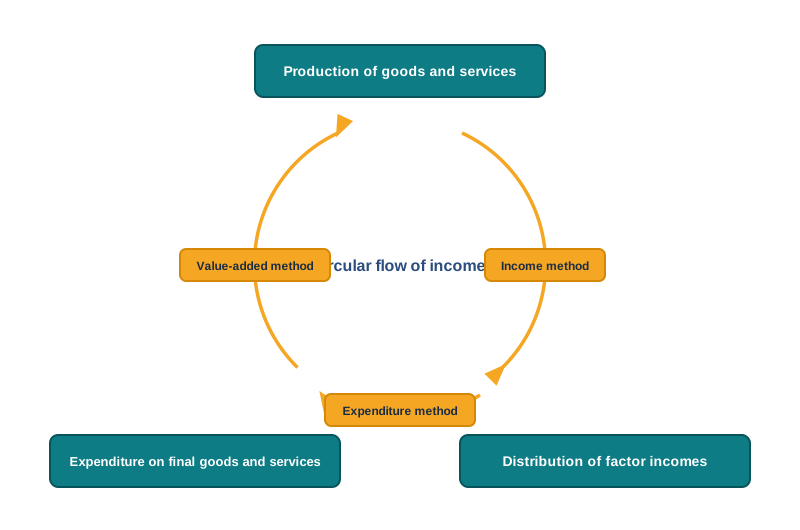
Fig. 20.0 – One flow measured at three points.
20.1 Three Ways of Measuring National Income
An economy’s output cannot be added up in its own units: tonnes of wheat, metres of cloth and hours of teaching have no common measure. What they do have in common is a price, so output is added in money. The aggregate being sought is net national product at factor cost, which is what national income means in national income accounting; gross domestic product is arrived at on the way to it.
The problem of measurement is therefore one of finding a point in the working of an economy at which this total can be captured, once and once only. There are three such points, and they exist because of a single fact about the way an economy works: what is produced becomes somebody’s income, and that income is spent on what is produced.
20.1.1 The Three Phases in the Circular Flow of Income
Every act of production sets off a sequence that returns to production. Firms combine land, labour, capital and enterprise to make goods and services; the value of that output is paid out to the owners of these factors; and the factor owners spend what they receive on the goods and services produced. This unbroken sequence is the circular flow of income, and it falls into three phases.
- Production phase — firms use productive resources to turn out goods and services. Value is created here, and the size of the year’s output is settled here.
- Distribution phase — the value of that output is distributed among the owners of the factors of production as rent, wages, interest and profit. Nothing new is created at this stage; the value made in the first phase changes hands.
- Disposition phase — the incomes so received are spent on final consumer goods and capital goods. The spending reaches firms as receipts and sets production going once again.
The three phases and the direction in which the flow runs are shown in Fig. 20.1.

Fig. 20.1 – Three phases in the circular flow of income.
Because the phases follow one another without a break, the flow has no natural beginning or end. Production appears as a flow of goods and services, distribution as a flow of incomes and disposition as a flow of expenditure, but it is one stream throughout, observed at different places along its course.
20.1.2 The Three Methods of Measurement
An estimator may take his stand at any one of the three phases, and the method takes its name from where he stands. Each method adds up a different set of items, and each arrives at national income.
- Value-added method — also called the net product method, it adds up the net value added at factor cost by all the producing units within the domestic territory during a year, and then adds net factor income from abroad.
- Income method — it adds up all the factor incomes generated in the course of producing the national product, that is, compensation of employees, operating surplus and mixed income, and then adds net factor income from abroad.
- Expenditure method — it adds up all the final expenditure incurred on domestic product at market prices, from which depreciation and net indirect taxes are deducted and net factor income from abroad added.
The three methods and what each of them sums are set out in Fig. 20.2.
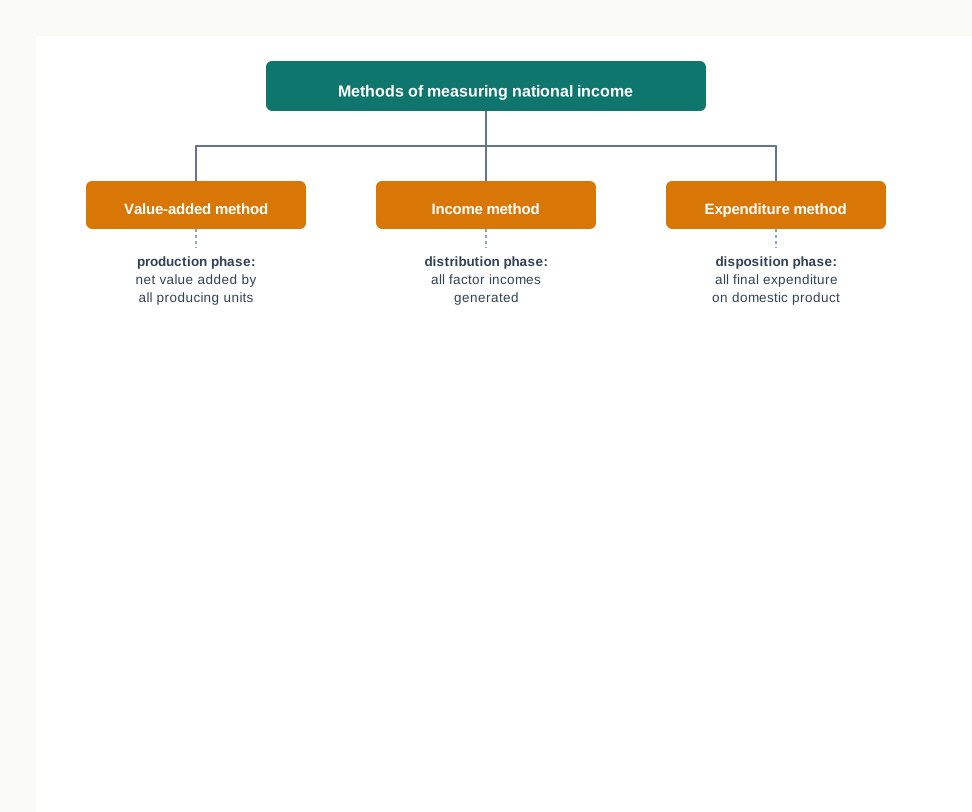
Fig. 20.2 – Methods of measuring national income.
20.1.3 Why the Three Methods Give the Same Total
The first two phases must agree because of the way the value of output is disposed of. Out of the money a firm receives for its output, it meets the cost of intermediate goods bought from other firms and pays rent, wages and interest; whatever is left over is profit, which belongs to the entrepreneur. Since profit is a residual, no part of the value added can escape being somebody’s factor income. The sum of net value added and the sum of factor incomes are therefore two ways of writing the same figure.
The second and third phases agree because output that is produced is also bought. If a firm fails to sell what it has made, the unsold stock is treated as having been bought by the firm itself and enters the accounts as inventory investment. Nothing produced in the year is left out of the expenditure total merely because no outside buyer was found for it.
National product, income generated and total expenditure are thus equal by definition, not by coincidence. In practice, the three estimates rarely tally to the last rupee, because each is built up from a different body of data; how that gap is treated is taken up in Section 20.5.
20.2 Value-Added Method
The value-added method measures national income at the phase where output is created. Its central difficulty is easy to state. If the estimator simply adds up the value of everything every producing unit sells, he will count the same value several times over, because the output of one firm is the input of the next. The method exists to prevent that, and everything in it follows from the way it does so.
20.2.1 Meaning of Value Added
Consider a loaf of bread. The farmer grows the wheat, the miller turns it into flour, the baker bakes the loaf and the shopkeeper sells it. If the sales of all four are added together, the value of the wheat is counted four times, once on its own and again inside the flour, the loaf and the shop’s sale. Counting the value of the same output more than once in this way is called double counting, and it would inflate the national income enormously.
The escape is to count, at each stage, only what that producer has himself added to the value of what he bought. This is his value added.
The goods and services a producer buys from other producers and uses up in the course of production are its intermediate consumption. They are not counted as output in their own right, because their value is already contained in the price of the good that finally emerges.
Table 20.1 follows the bread through its four stages and shows the arithmetic of the escape.
Two results in Table 20.1 deserve attention. Adding the four sales gives ₹4,100, which counts the wheat and the flour repeatedly. Adding the four values added gives ₹1,500 — exactly the value of the bread finally bought by households. The sum of the values added at every stage equals the value of the final output, which is why the method is also called the net product method.
20.2.2 Classification of Production Units
Value added has to be estimated industry by industry, so the first step of the method is to identify every producing unit in the domestic territory and place it in an industrial sector. Production units are grouped on the basis of the nature of the production process, into three broad sectors.
- Primary sector — it includes all production units that draw commodities directly from nature by exploiting natural resources. Agriculture, forestry, fishing, mining and quarrying belong here.
- Secondary sector — it includes units that transform one commodity into another with the help of raw materials produced in the primary sector, as when cotton is turned into cloth. Manufacturing, construction, and electricity, gas and water supply belong here.
- Tertiary or service sector — it includes units that produce services rather than tangible goods. Trade, transport and communication, banking, insurance, government administration, and professional and personal services belong here.
Each broad sector is divided further into sub-sectors, so that agriculture, forestry and mining are estimated separately within the primary sector. How finely the division is carried, and how many sectors are recognised, varies from one country to another. The classification is shown in Fig. 20.3.
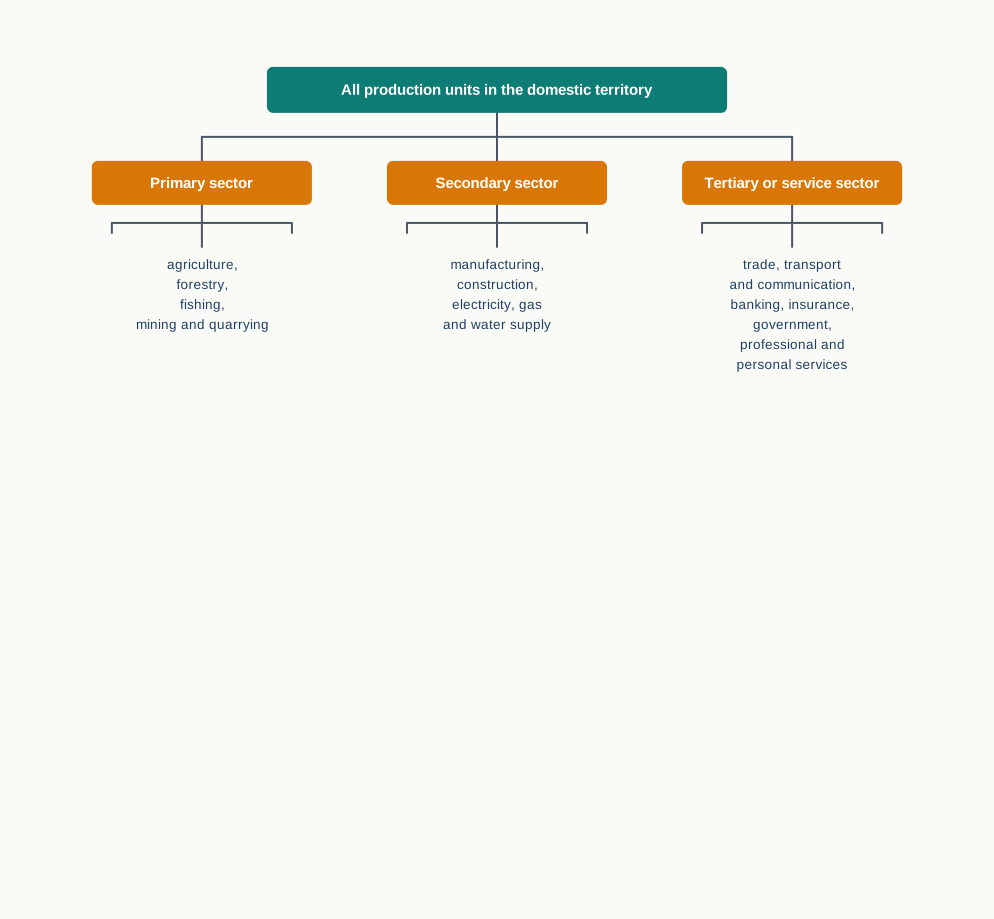
Fig. 20.3 – Classification of industrial sectors.
20.2.3 Estimation of Net Value Added at Factor Cost by an Enterprise
The second step is to work out what each enterprise has added, and to bring that figure to the net and factor-cost basis in which national income is expressed. The starting point is the value of what the enterprise produced during the year, which is not the same as what it sold.
\[\text{Value of output} = \text{Sales} + \text{Change in stock}\]
Here sales is the value of the goods actually sold during the year and change in stock is the closing stock less the opening stock, both in rupees. A positive change in stock means the enterprise produced more than it sold, and that surplus production belongs to the year’s output as much as the part that found a buyer.
This value of output is described as gross for two reasons: it still contains the value of intermediate goods bought from others, and it has been arrived at without deducting depreciation. Three deductions turn it into the figure the method needs.
\[\text{NVA}_{FC} = \text{Value of output} - \text{Intermediate consumption} - \text{Depreciation} - \text{Net indirect taxes}\]
Here \(\text{NVA}_{FC}\) is net value added at factor cost, depreciation is the value of fixed capital used up during the year, and net indirect taxes are indirect taxes less subsidies, all in rupees. Deducting intermediate consumption gives gross value added at market price; deducting depreciation from it gives net value added at market price; deducting net indirect taxes from that gives net value added at factor cost, which is the enterprise’s own contribution to national product. SE 20.1 works the ladder through for a single firm.
20.2.4 Estimation of Net Domestic Product at Factor Cost
Once every enterprise has been dealt with, the third step is a matter of addition. The net values added at factor cost of all the enterprises in one industrial sector are added to give the net value added of that sector, and the sector totals are then added together.
\[\text{NDP}_{FC} = \Sigma \text{NVA}_{FC}\]
Here \(\text{NDP}_{FC}\) is net domestic product at factor cost and \(\Sigma \text{NVA}_{FC}\) is the sum of the net values added at factor cost by all the producing units located in the domestic territory during the year, in rupees. The result is the income generated within the geographical boundary of the country, no matter who earned it.
20.2.5 Estimation of Net Factor Income from Abroad
The fourth and final step converts a domestic total into a national one. Some residents of the country earn factor incomes abroad, and some non-residents earn factor incomes within the country. The difference between the two is the net factor income from abroad, and adding it to the domestic product gives the income of the country’s normal residents.
\[\text{National income } (\text{NNP}_{FC}) = \text{NDP}_{FC} + \text{NFIA}\]
Here NFIA is net factor income from abroad, in rupees, and may be positive or negative; it is negative when non-residents earn more within the country than residents earn outside it. The four steps taken together are shown in Fig. 20.4, and SE 20.2 applies them to an economy of three sectors.
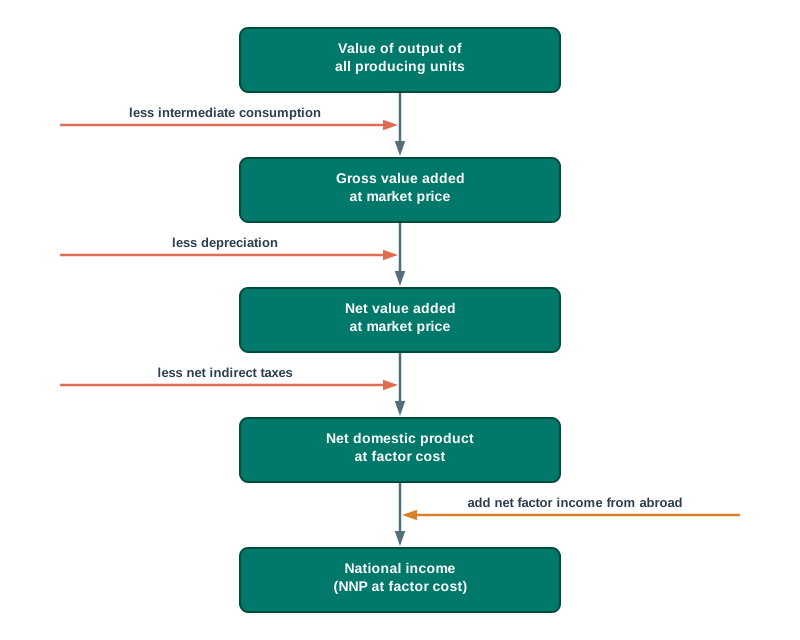
Fig. 20.4 – From value of output to national income.
20.2.6 Precautions in the Value-Added Method
National income is meant to measure the value of what the economy has currently produced. Several transactions look like production without being production, and some genuine production leaves no trace in any market. The following precautions keep the estimate faithful to what was actually produced.
- Value of goods produced for self-consumption — included. Foodgrains a farmer keeps for his family are current production and are income in kind; since they carry no market price, their value is imputed at the price of similar goods sold in the market.
- Own-account production of fixed assets — included. A house a household builds for itself, or a shed a firm builds with its own labour, adds to the year’s output even though nothing changes hands.
- Imputed rent of owner-occupied houses — included. Owners who live in their own houses pay no rent but consume housing services exactly as tenants do, and the value of those services is estimated from the market rent of similar accommodation.
- Services of housewives — excluded. These services are produced and consumed within the home and never enter the market, so there is no way of placing a reliable value on them. Note the asymmetry this creates: the same work done for pay, in a restaurant or a crèche, is included.
- Sale and purchase of second-hand goods — excluded. An old car or an old house was counted in the year it was produced, and selling it now merely transfers an existing asset. The commission earned by the broker who arranges the sale is included, because that service is rendered in the current year.
- Sale and purchase of shares, bonds and other financial assets — excluded. Such transactions transfer the ownership of a claim and add nothing to the flow of goods and services, though here too the broker’s commission is a current service and is included.
20.2.7 Difficulties in the Value-Added Method
Even when the precautions are understood, the method is hard to apply, and the difficulties are as much a part of the syllabus as the steps.
- Valuation of inventories — goods produced but unsold are added to national income as an addition to inventories, but their prices change over the year, and deciding which price to value the stock at is not straightforward.
- Estimation of depreciation — a fixed asset may be depreciated on its historical cost, that is the price at which it was bought, or on its replacement cost. The two give different figures for net value added, and there is no single agreed answer.
- Treatment of certain products as final or intermediate — expenditure on education and on transport is regarded by some accountants as a final product and by others as an input into production, and the estimate changes accordingly.
- Absence of a clear line between intermediate and final goods — whether a good is intermediate depends on its use and not on the good itself. Flour bought by a household is a final good; the same flour bought by a baker is an intermediate good.
- Lack of adequate and reliable data — in the subsistence sector and among unincorporated enterprises no proper accounts are kept, which makes value added hard to establish and is a serious problem for measurement in developing economies.
20.3 Income Method
Goods and services are produced by land, labour, capital and enterprise, and whatever is produced is shared out among the owners of those factors. The income method measures national income at that second phase, where the value of output turns into somebody’s earnings. Under this method, national income is calculated by adding up all the incomes generated in the course of producing the national product.
The method rests on the result established in Section 20.1: because profit is a residual, the value added by a producing unit is exhausted by the incomes it pays out. Adding those incomes must therefore give the same total as adding the values added.
20.3.1 Factor Incomes and Transfer Incomes
The word income has to be used strictly here. Money changes hands for many reasons in an economy, and only some of those payments reward a factor service. A payment made in return for the use of a factor of production is a factor income; a payment received without any factor service being rendered in return is a transfer income.
An old-age pension, a scholarship, flood relief and pocket money are transfer incomes. They move purchasing power from one pocket to another without adding anything to the year’s output, and counting them would inflate national income above the value of what was produced. Only factor incomes are added under this method, and they are grouped into three broad categories.
- Compensation of employees — the income of those who work for others.
- Operating surplus — the income of those who own and control capital.
- Mixed income — the income of those who supply labour and capital together in their own enterprise.
20.3.2 Compensation of Employees
Compensation of employees is what a producer pays for work done for it. It is not confined to the money handed over on payday: anything a worker receives from the employer in return for work, in cash or in kind, belongs here.
The three components are set out in Fig. 20.5.
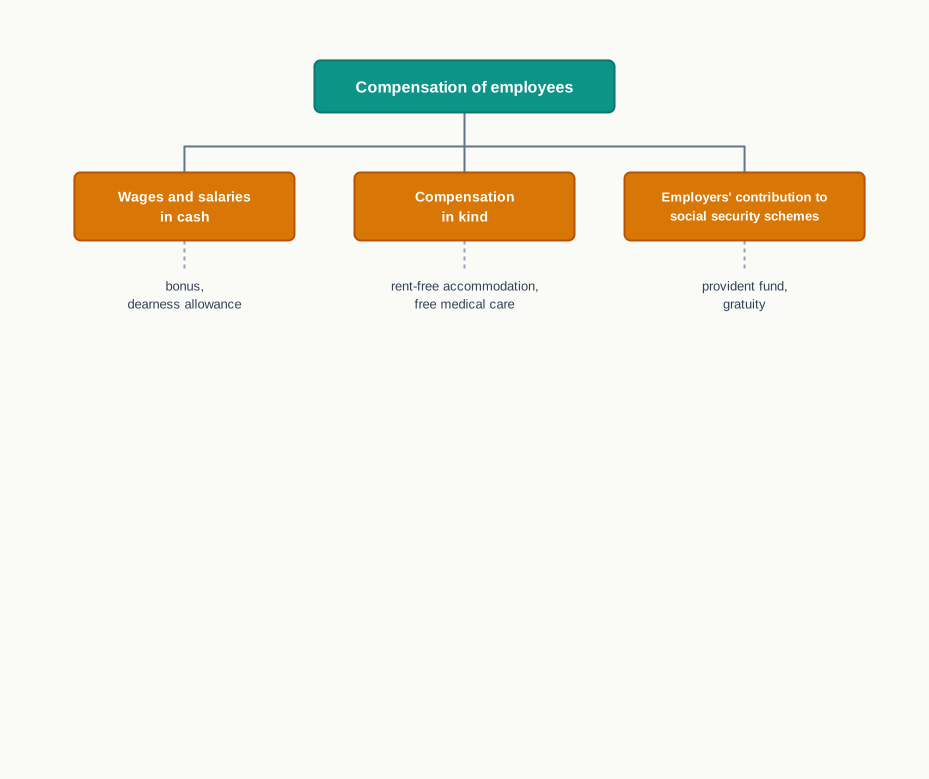
Fig. 20.5 – Components of compensation of employees.
Two items that look like employee income are kept out. The contribution an employee himself makes to a provident fund or a social security scheme is paid out of his wages and salaries, which have already been counted, so adding it again would count it twice. A travelling allowance paid for an official tour is a business expense of the employer and not a reward for the employee’s work, so it too is left out. SE 20.3 shows both exclusions at work.
20.3.3 Operating Surplus
Operating surplus is the reward of capital and enterprise. It accrues to those who own property or run a business, and it arises in government enterprises exactly as it does in private ones.
Rent is the income of those who own land and buildings and let them out, and it includes the imputed rent of self-occupied houses. Royalty is the income received for granting mining rights and from patents and copyrights. Interest is the income received for lending, and only net interest is counted, because a person may both receive and pay interest. Interest paid on the national debt and interest paid by consumers on loans taken to meet consumption are not counted at all: the first is treated as a transfer and the second is not a payment for a factor service used in production.
Profit is the income of the entrepreneur, and it is counted before corporation tax is paid. It is therefore made up of three parts — the corporation tax the company pays to the government, the dividends it distributes to shareholders, and the undistributed profits it retains as corporate saving for future investment. The components of operating surplus are shown in Fig. 20.6.
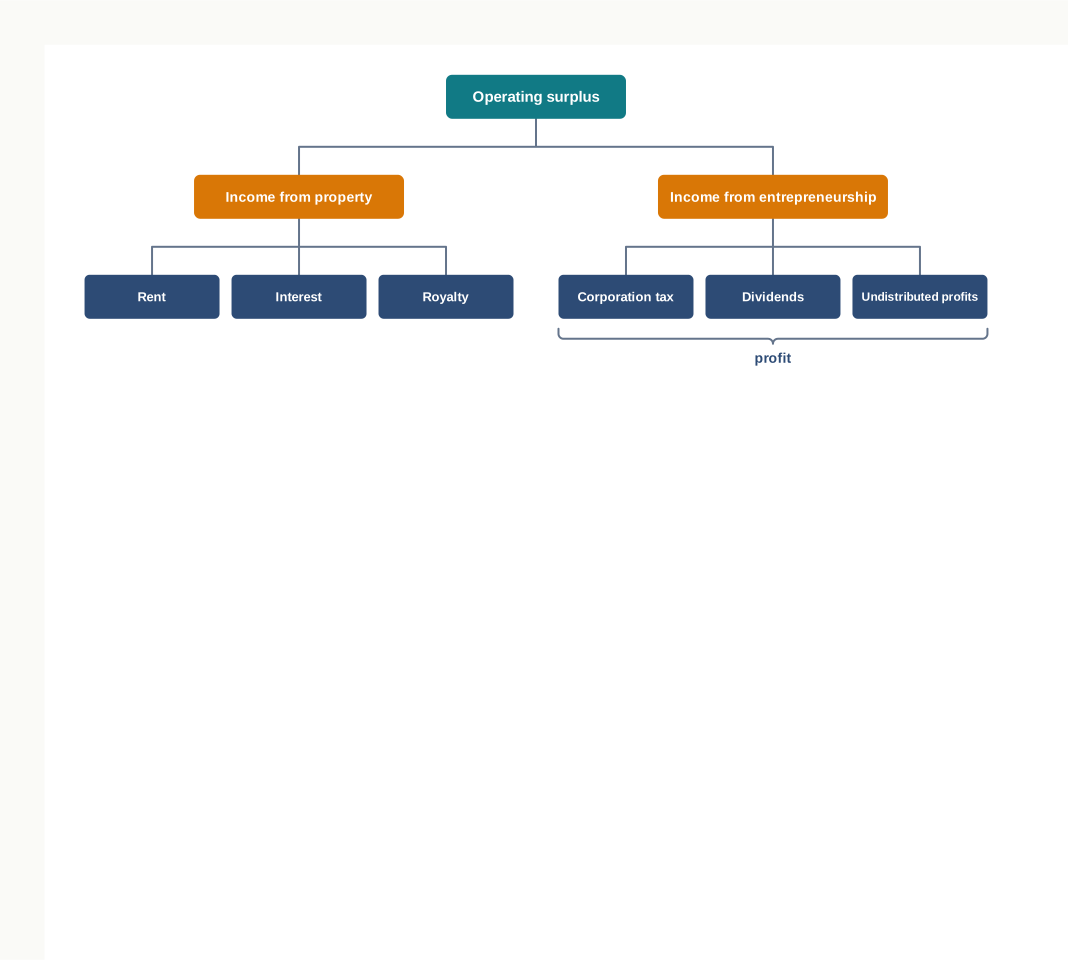
Fig. 20.6 – Components of operating surplus.
20.3.4 Mixed Income
In a great many enterprises the same person supplies the labour and owns the capital. A farmer working his own land, a shopkeeper behind his own counter and a doctor in his own clinic all earn a return that is part wage and part profit, and no set of accounts exists that could separate the two. Such earnings are treated as a category of their own.
Mixed income covers the earnings of farmers, traders, transporters, sole proprietors, members of the legal and medical professions practising on their own, and own-account workers such as plumbers and carpenters.
20.3.5 From Domestic Factor Income to National Income
The incomes paid out by every enterprise in an industrial sector are added to give the factor income of that sector, and the sector totals are added to give the domestic factor income, which is the same thing as net domestic product at factor cost.
\[\text{NDP}_{FC} = \text{Compensation of employees} + \text{Operating surplus} + \text{Mixed income}\]
Each term is a rupee total for the year, covering all the production units located in the domestic territory. The sum is a net factor-cost figure to begin with, because factor incomes are what remains after depreciation and indirect taxes have been met, so no further deduction is needed on either count.
\[\text{National income } (\text{NNP}_{FC}) = \text{NDP}_{FC} + \text{NFIA}\]
As in the value-added method, adding net factor income from abroad turns the domestic total into a national one. SE 20.4 works through a complete estimate.
20.3.6 Precautions in the Income Method
The precautions of this method turn almost entirely on one test: was a factor service rendered in the current year in return for the payment?
Incomes To Be Included
- Value of production for self-consumption — the farm produce a household keeps for itself is income in kind and its imputed value is included.
- Imputed rent of self-occupied houses — owners are treated as earning from themselves the rent they would otherwise have received.
- Imputed value of the owner’s own services — where the owner of a production unit works in it without drawing a salary, the value of that work is estimated and included.
Incomes To Be Excluded
- Transfer incomes — old-age pensions, unemployment relief, scholarships and relief given to meet a flood or a drought are received without any productive service being rendered in exchange, and merely move income from one pocket to another.
- Private transfer payments — pocket money given by parents, money given to elders by their children and gifts from an employer to an employee transfer money between individuals and are excluded for the same reason.
- Illegal incomes — the earnings of smugglers and of those who trade in prohibited goods are excluded, being neither lawful nor accountable.
- Interest on the national debt — it is treated by convention as a transfer, on the view that government borrowing of the past was used for consumption rather than production.
- Interest on loans taken to meet consumption expenditure — such interest is a non-factor income, since the loan financed no production. Interest on loans taken for production is included.
- Money received from the sale of second-hand goods, shares and bonds — these transactions change the ownership of what already exists. The commission charged by the broker is included, being a service rendered this year.
- Windfall gains — winnings from a lottery add nothing to the current flow of goods and services.
- Wealth tax, death duties and gift tax — these are paid out of past savings and not out of current income, so they are not part of national income.
- Corporation tax and income tax as separate items — corporation tax is already inside profit and income tax is already inside wages and salaries; adding either again would count it twice.
20.3.7 Difficulties in the Income Method
- Estimation of mixed income — mixed income is earned in the unincorporated and unorganised sector, where accounts are seldom kept, and reliable information about it is hard to obtain.
- Treatment of interest on the national debt — the convention that treats it as a transfer is disputed, since a part of government borrowing is in fact used for productive purposes.
- Dependence on income tax returns — incomes are largely computed from tax records, and in a developing economy only a small proportion of income earners are taxpayers, which limits the method’s usefulness.
- Separating factor incomes from transfer incomes — the distinction is clear in principle but troublesome in practice, particularly where a single payment rewards past service and present need together.
Against these difficulties stands a real advantage. The income method is the only one of the three that shows how national income is distributed among the factors of production — what share goes to labour as compensation of employees and what share to capital and enterprise as operating surplus.
20.4 Expenditure Method
The third method measures national income at the disposition phase, when the incomes generated in production are spent. It measures national income by estimating expenditure on final products at market prices during a year. What is bought must first have been produced, so the total spent on the year’s final output is another way of arriving at the value of that output.
Two words in that sentence carry weight. Final products are those bought for consumption or for investment, never for resale or for further processing; expenditure on intermediate products is not counted, for the same reason that intermediate consumption was deducted in the value-added method. And market prices, not factor cost: the expenditure method reaches the value of output as buyers pay for it, so the adjustments to factor cost come later.
20.4.1 Final Expenditure and the Spending Sectors
Every economic unit that spends on final products falls into one of four groups — households, the business sector, the government sector and the rest of the world. Corresponding to these four groups, final expenditure is divided into four categories.
- Private final consumption expenditure — spending by households and by private non-profit institutions serving households.
- Investment expenditure or gross domestic capital formation — spending by producers, and by government in its capital account, on capital goods.
- Government final consumption expenditure — the current spending of the general government on goods and services.
- Net exports — the excess of what the rest of the world spends on domestic goods over what residents spend on foreign goods.
Adding the four gives gross domestic product at market price, as Fig. 20.7 sets out.
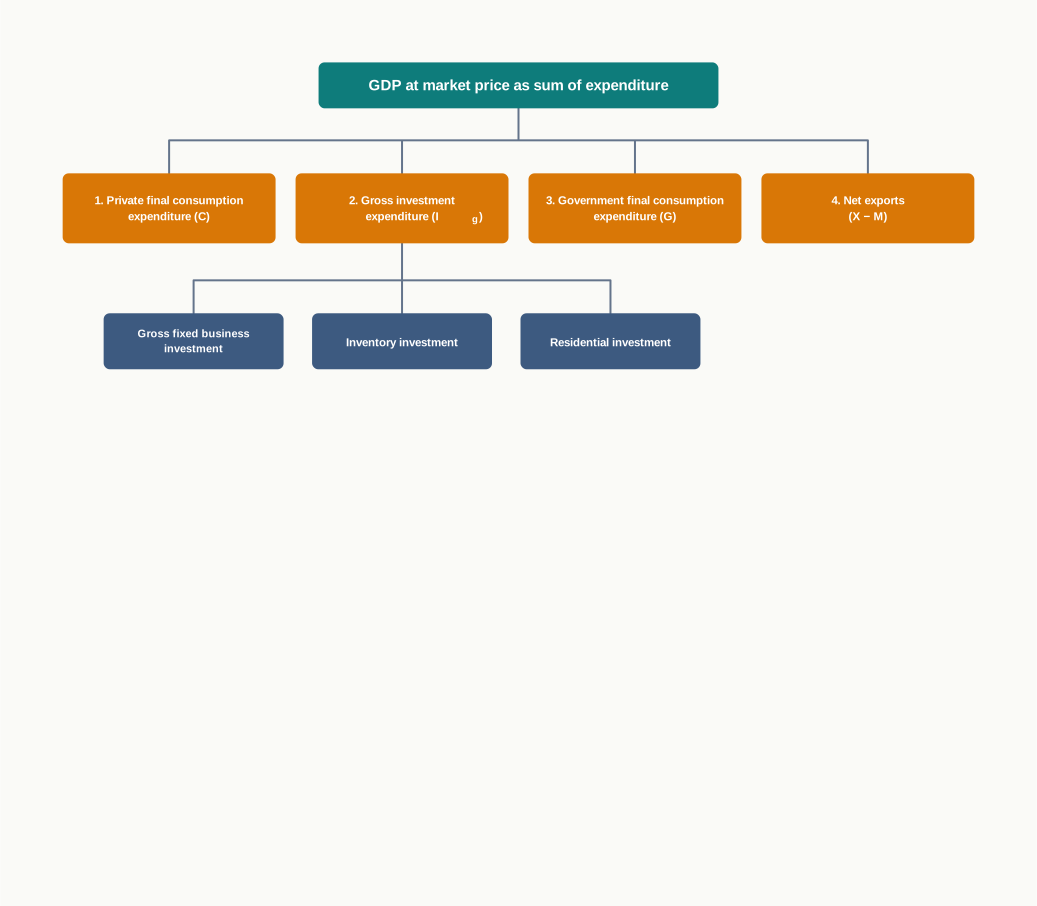
Fig. 20.7 – GDP at market price as the sum of final expenditure.
20.4.2 Private Final Consumption Expenditure
Private final consumption expenditure is what households spend on consumer goods and services during the year, together with the spending of private non-profit institutions serving households, such as schools, clubs and charitable hospitals. It covers durable goods such as a scooter or a refrigerator, non-durable goods such as food and fuel, and services such as a bus journey or a haircut.
One purchase that looks like consumption is kept out of it. A house bought by a household is not consumption but investment, because a house is a durable asset that yields its services over many years; it is counted under residential investment instead. What the household consumes each year is the housing service, and where the house is owner-occupied that service enters national income as imputed rent.
20.4.3 Investment Expenditure
Investment means addition to the physical stock of capital goods — machinery, factories, houses and the stocks a firm holds. Expenditure on such goods is gross domestic capital formation, and it has three parts.
Gross fixed business investment is spending on new plant, machinery, transport equipment and construction works such as dams and telephone lines. Inventory investment is the change in the stocks held by firms — finished goods on shelves, semi-finished goods and raw materials with producers — and is found as the closing stock less the opening stock. Residential investment is spending on the construction of new houses by households and landlords, together with major repairs and own-account construction.
\[\text{Gross domestic capital formation} = \text{Gross fixed business investment} + \text{Inventory investment} + \text{Gross residential investment}\]
Each term is a rupee total for the year. Inventory investment alone may be negative, when firms sell more than they produce and run their stocks down.
20.4.4 Government Final Consumption Expenditure
Government spending is of two kinds. Its capital expenditure, on roads, buildings and equipment, is public investment and is taken along with private investment under capital formation. What remains is its current expenditure on goods and services — administration, defence, law and order, education, sanitation and social welfare services — and it is this that is called government final consumption expenditure.
Such services are not sold in a market, so they have no market price by which to value them. They are therefore valued at what they cost the government, that is, the compensation of employees paid by the government plus the cost of the goods and services it buys to provide them. Where the government charges a nominal fee for a service, those receipts are deducted from the total cost to arrive at the net expenditure on that service.
20.4.5 Net Exports
In an open economy some of what is produced at home is bought by the rest of the world, and some of what residents buy was produced abroad. Both facts have to be allowed for before final expenditure can measure domestic product.
Exports are added because they represent foreign spending on goods produced within the domestic territory; those goods are part of domestic product, and leaving them out would understate it. Imports are deducted because spending on them is part of residents’ expenditure but the goods belong to the domestic product of other countries. Since net exports are exports minus imports, adding net exports does both jobs at once, as Fig. 20.8 shows.
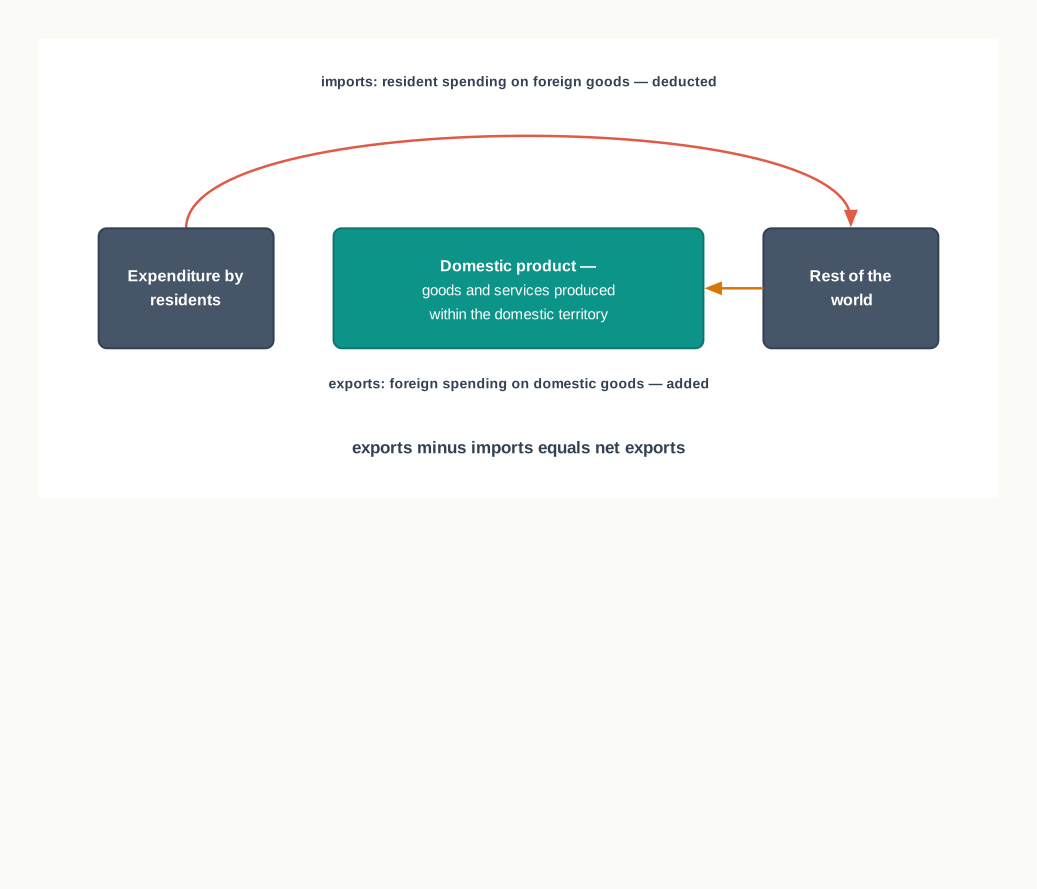
Fig. 20.8 – Why net exports are added.
20.4.6 From Gross Domestic Product at Market Price to National Income
Adding the four categories of final expenditure gives the gross, domestic, market-price aggregate.
\[\text{GDP}_{MP} = C + I_g + G + (X - M)\]
Here \(C\) is private final consumption expenditure, \(I_g\) gross domestic capital formation, \(G\) government final consumption expenditure, \(X\) exports and \(M\) imports, all in rupees for the year. Three adjustments then bring this to national income.
\[\text{National income } (\text{NNP}_{FC}) = \text{GDP}_{MP} - \text{Depreciation} - \text{Net indirect taxes} + \text{NFIA}\]
Depreciation is deducted because a part of the year’s expenditure merely replaces capital used up; net indirect taxes are deducted because market prices include the taxes the government levies and exclude the subsidies it pays, neither of which is a factor earning; and net factor income from abroad is added to turn a domestic total into a national one. SE 20.5 works through the full sequence, and SE 20.6 takes the case where capital formation is given in net terms.
20.4.7 Precautions in the Expenditure Method
- All final products are included, whether or not expenditure was actually incurred on them — foodgrains a farmer keeps for his family, the housing services of an owner-occupied house and machinery a firm builds for its own use are all part of final output and are valued at the market price of similar products.
- Expenditure on intermediate products is excluded — the value of intermediate goods is already contained in the market price of the final goods in which they are used, and counting it again would be double counting.
- Expenditure on second-hand goods is excluded — such spending buys output produced in an earlier year and adds nothing to this year’s output. The commission paid to the broker who arranges the sale is included.
- Expenditure on financial assets is excluded — buying shares and bonds transfers the ownership of a claim and is not expenditure on any good or service.
- Government expenditure on transfer payments is excluded — pensions, scholarships and relief payments are made without any factor service being rendered in return and buy no current output, whatever social purpose they serve.
20.4.8 Difficulties in the Expenditure Method
The expenditure method meets all the difficulties of the value-added method, since both work with market values of output, and it faces two of its own.
- Valuation of inventory changes — the stock of goods held at the end of the year may be valued at the price at which it was produced or at current prices, and inventory valuation is a laborious business either way. The usual practice is to value stocks at current prices.
- Inadequate data on expenditure — the method needs reliable figures for the spending of millions of households, and in a developing economy such as India these are the hardest of all the three sets of data to collect.
The method has a compensating advantage. It alone shows how the national product was disposed of — how much went to consumption and how much to investment, and what share of total spending was private and what share public.
20.5 Identity of Output, Income and Expenditure
National income has now been reached three times over — as the value of what was produced, as the incomes that production generated and as the expenditure that bought it. Section 20.1 gave the reason in outline. This section states the relationship formally, because it is the proposition on which the whole of national income accounting rests.
\[\text{National product} \equiv \text{Income generated} \equiv \text{Total expenditure}\]
The sign \(\equiv\), read as three bars or as ‘is identically equal to’, means that the three magnitudes are equal by definition and not by coincidence. An ordinary equation may hold at some values and fail at others; an identity holds always, because the two sides are two descriptions of the same thing.
20.5.1 Why the Three Magnitudes Are Equal
Output produced must be matched by the claims made on that output. When a producing unit sells its output, the receipts are used to pay rent, wages and interest, and whatever is left belongs to the entrepreneur as profit. Because profit is a residual and not a fixed charge, there is no amount of value added that can fail to become somebody’s factor income. National product is therefore equal to income generated, item for item.
Total expenditure is the expenditure needed to purchase the national product. It equals income generated because expenditure incurred by one person is income received by another: the money a household spends on cloth becomes the receipts of the shop, and through the shop the earnings of the weaver, the mill and the cotton grower. Income earned and income spent are two views of the same rupee.
The awkward case is output that finds no buyer, and national income accounting settles it by convention. Goods produced but unsold are added to the producer’s stocks and treated as inventory investment by the producer itself. Nothing produced during the year escapes the expenditure total merely because no outside buyer was found for it. A miniature economy is worked through in Table 20.2.
The same ₹1,000 crore appears in every row, but each row is built from a different set of facts — a production account in the first, a payroll and a profit and loss account in the second, a record of purchases in the third. The three readings are set beside one another in Fig. 20.9.
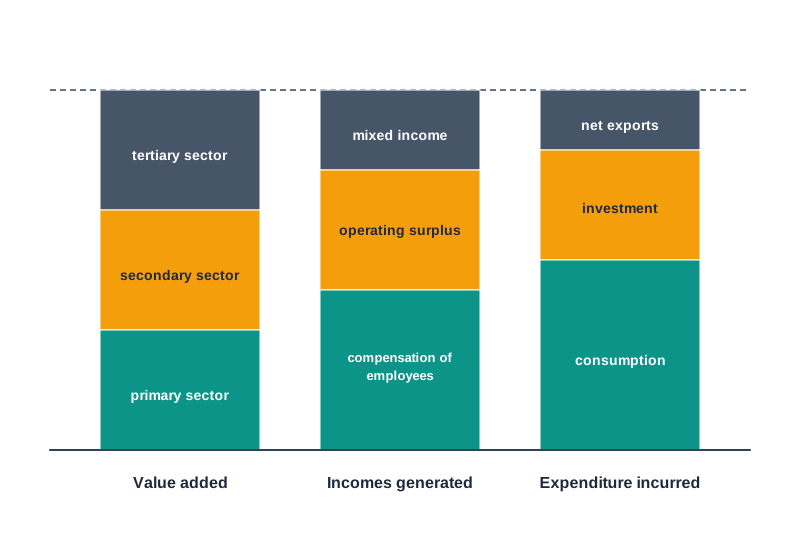
Fig. 20.9 – The same aggregate under three headings.
20.5.2 Statistical Discrepancy in Practice
An identity that holds by definition need not hold in the figures. In practice the three estimates are prepared independently of one another, using production returns, income records and expenditure surveys, and they seldom arrive at exactly the same total. The gap between them is reported as a statistical discrepancy, and the accounts carry it as a separate entry so that the three sets of figures can be reconciled.
The gap arises from the data and not from the theory. Each set of records covers a slightly different ground, and some activity is caught by one source and missed by another. Imputed items such as the rent of owner-occupied houses and the value of produce kept for self-consumption have to be estimated rather than counted, and estimates made from different directions rarely agree to the last rupee.
20.6 Significance of the Three Methods
If the three methods arrive at the same total, it is fair to ask why an economy should trouble to work all three. The answer is that a total is not the only thing an estimator wants. Each method reaches national income through a different set of accounts, and on the way it answers a question the other two cannot answer.
Ideally, therefore, national income should be estimated by all three methods separately. Doing so yields three different views of the same economy, and it also provides a check, since a serious error in one set of records shows up as an unusually wide gap between that estimate and the other two.
20.6.1 What Each Method Shows
The value-added method measures output industry by industry, so it shows national income by industrial origin — how much of the year’s output came from the primary sector, how much from the secondary and how much from the tertiary. Where a country wants to know the contribution of agriculture, or to trace how the balance between farming, factories and services has shifted over two decades, this is the method that supplies the answer.
The income method groups payments by the factor that received them, so it shows how national income is distributed — what share went to labour as compensation of employees and what share to property and enterprise as operating surplus. Questions about the division of the national product between those who work and those who own can be examined only from this side.
The expenditure method groups final purchases by the sector that made them, so it shows how the national product was disposed of — how much was consumed and how much added to the capital stock, and what part of total spending was private and what part governmental. It is the method that connects national income accounting to the analysis of aggregate demand.
The choice among the three therefore depends on the phase of the economy that is to be studied, and on nothing else. The main points of difference are set out below.
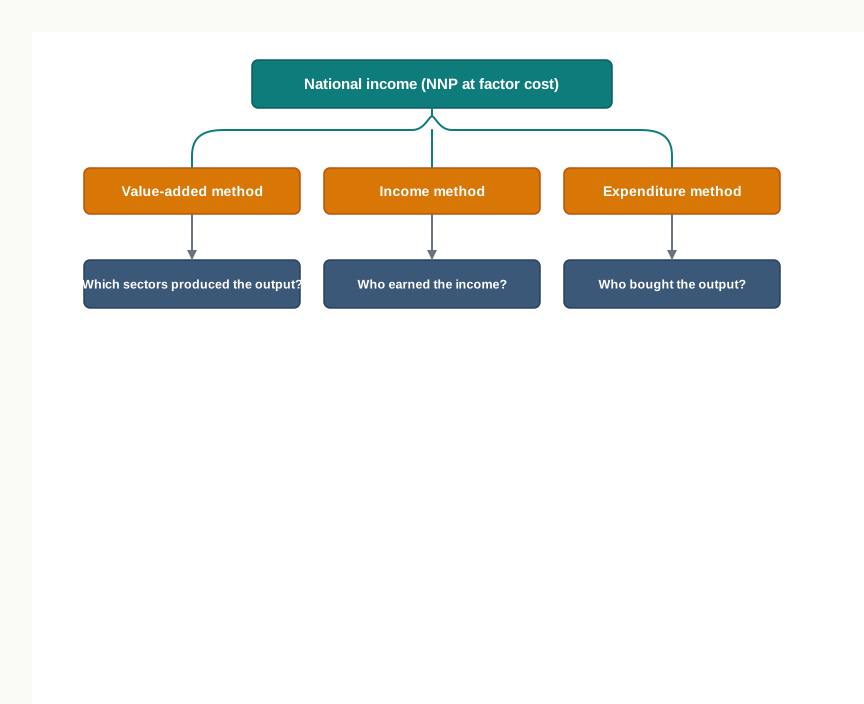
Fig. 20.10 – Questions answered by each method.
20.6.2 Estimation of National Income in India
Estimating national income by all three methods separately assumes that a country possesses complete data of all three kinds. Most countries do not, and developing countries least of all, where much production is carried on in unincorporated enterprises that keep no accounts and where a large part of expenditure is never recorded anywhere.
India’s practice follows from this. No single method can be applied to the whole economy, so the estimate is built sector by sector, using for each part of the economy the method its data will support. The contribution of agriculture is arrived at by the value-added method, since the quantity of the crop and the price it fetched are both known; the contribution of small unregistered manufacturing units, whose output cannot be measured directly, is arrived at by the income method. The sector estimates are then added to give the national total.
The work is carried out by the National Statistical Office, which publishes estimates for each financial year and revises them as fuller information becomes available. Combining the methods in this way is not a compromise of principle. Since output, income and expenditure are identically equal, a figure obtained from any one of them is a figure for the same thing, and the parts may be estimated by different routes and still add up to one national income.
20.7 Summary
- The circular flow of income passes through three phases, and each phase offers a point at which the flow can be measured.
- Production phase — goods and services are produced and value is created.
- Distribution phase — the value of output is paid out to the factors of production as rent, wages, interest and profit.
- Disposition phase — the incomes so earned are spent on final consumer goods and capital goods.
- Corresponding to the three phases there are three methods of measuring national income — the value-added or net product method, the income method and the expenditure method. All three arrive at net national product at factor cost, which is what national income means.
- Value added is the value of a producing unit’s output less the value of the intermediate products used up in producing it. Adding the sales of every producer instead would count the same output at each stage it passed through, an error called double counting.
- The value of output of an enterprise is not the same as its sales, since part of the year’s output may remain in stock; sales, change in stock and value of output are all rupee totals for the year. \[\text{Value of output} = \text{Sales} + \text{Change in stock}\]
- Three deductions bring the value of output to net value added at factor cost (\(NVA_{FC}\)), where intermediate consumption is the value of inputs used up, depreciation is the fixed capital consumed and net indirect taxes are indirect taxes less subsidies, all in rupees. \[NVA_{FC} = \text{Value of output} - \text{Intermediate consumption} - \text{Depreciation} - \text{Net indirect taxes}\]
- Producing units are classified by the nature of their production process into the primary, secondary and tertiary sectors, and the net values added at factor cost of all units in the domestic territory are added to give net domestic product at factor cost (\(NDP_{FC}\)). Adding net factor income from abroad (NFIA), which may be positive or negative, converts this domestic total into national income (\(NNP_{FC}\)). \[NNP_{FC} = NDP_{FC} + \text{NFIA}\]
- The value-added method requires certain items to be counted although no ordinary sale takes place.
- Goods produced for self-consumption are included at imputed value.
- Own-account production of fixed assets is included.
- Imputed rent of owner-occupied houses is included.
- It equally requires certain receipts to be kept out, because they represent no current production.
- Services of housewives are excluded, since they never enter the market and cannot be valued.
- Sale and purchase of second-hand goods is excluded, though the broker’s commission is included.
- Sale and purchase of shares and bonds is excluded, being a transfer of ownership of assets.
- The main difficulties of the value-added method are the valuation of inventories, the choice between historical cost and replacement cost in estimating depreciation, the treatment of doubtful items such as education and transport, the absence of a clear line between intermediate and final goods, and the lack of reliable data in the unorganised sector.
- The income method adds up only factor incomes, which are payments for factor services rendered in production. Transfer incomes such as old-age pensions, scholarships, relief payments and pocket money are excluded, because no factor service is rendered in return for them.
- Factor incomes are grouped under three heads.
- Compensation of employees — wages and salaries in cash, the employer’s contribution to social security schemes, and payments in kind.
- Operating surplus — rent, royalty and interest as income from property, and profit as income from entrepreneurship, profit itself being the sum of corporation tax, dividends and undistributed profits.
- Mixed income — the income of own-account workers and unincorporated enterprises, in which labour income and capital income cannot be separated.
- The three categories added together give domestic factor income, which is net domestic product at factor cost; net factor income from abroad is then added to reach national income. \[NDP_{FC} = \text{Compensation of employees} + \text{Operating surplus} + \text{Mixed income}\]
- Under the income method, production for self-consumption, imputed rent of self-occupied houses and the imputed value of an owner’s own services in his enterprise are included, while transfer incomes, illegal incomes, interest on the national debt, interest on consumption loans, receipts from the sale of second-hand goods and financial assets, windfall gains, wealth tax, gift tax and death duties are all excluded. Corporation tax and income tax are not added separately, being already inside profit and wages respectively.
- The chief difficulties of the income method are the estimation of mixed income in the unorganised sector, the disputed convention on interest on the national debt, and the dependence on income tax returns in an economy where few earners are taxpayers.
- The expenditure method measures national income by estimating expenditure on final products at market prices, and final expenditure falls into four categories — private final consumption expenditure (\(C\)), gross domestic capital formation (\(I_g\)), government final consumption expenditure (\(G\)) and net exports, exports (\(X\)) less imports (\(M\)), all in rupees for the year. \[GDP_{MP} = C + I_g + G + (X - M)\]
- Gross domestic capital formation is itself the sum of gross fixed business investment, inventory investment and gross residential investment; inventory investment is the change in stock and may be negative.
- Three adjustments convert the expenditure total into national income — depreciation is deducted because it merely replaces capital used up, net indirect taxes are deducted to move from market price to factor cost, and net factor income from abroad is added to move from a domestic to a national aggregate. \[NNP_{FC} = GDP_{MP} - \text{Depreciation} - \text{Net indirect taxes} + \text{NFIA}\]
- Under the expenditure method all final products are counted whether or not expenditure was actually incurred on them, while expenditure on intermediate products, on second-hand goods, on financial assets and on transfer payments is excluded. Its own difficulties are the valuation of inventory changes and the shortage of reliable data on household expenditure.
- National product, income generated and total expenditure are identically equal, and the sign \(\equiv\) marks an equality that holds by definition. Output becomes income because profit is a residual, and income equals expenditure because one person’s spending is another’s receipt, unsold output being treated as inventory investment by the producer itself.
- In practice the three estimates are built from different bodies of data and rarely tally exactly, and the gap between them is reported in the accounts as a statistical discrepancy.
- Each method is worth using because each shows something the others cannot — the value-added method shows the contribution of each industrial sector, the income method the share of each factor, and the expenditure method the division of the product between consumption and investment.
- Where data are incomplete, as in India, the methods are combined: agriculture is estimated by the value-added method and small unregistered manufacturing by the income method, and the sector estimates are added to give one national total, which the National Statistical Office publishes for each financial year.
20.8 Points to Ponder
- The services of housewives are excluded from national income because no market values them, yet the same cooking and childcare bought from a restaurant or a creche is included. Does this convention make national income a poor measure of what an economy actually produces, and would an estimated figure, however rough, serve better than a zero?
- Interest on the national debt is treated as a transfer on the view that past government borrowing financed consumption. If a government borrows to build highways, power stations and irrigation works, is that view still defensible, and what would happen to the measured national income if the convention were reversed?
- Output that no one buys is treated as though the producer had bought it himself, and enters the accounts as inventory investment. In a year when goods pile up unsold because demand has collapsed, is calling that stock ‘investment’ an honest description of what has happened, or a device for keeping the identity of output and expenditure intact?
- Much activity in a developing economy leaves a trace in household spending but none in any production return or tax record. If that is so, which of the three estimates of national income would you expect to come nearest the truth, and what would you do to bring the other two closer to it?
- India estimates some sectors by the value-added method and others by the income method, and then adds the results. Does building one total out of estimates made in different ways weaken the figure, or strengthen it by using the best evidence available for each part of the economy?
- The three methods answer three questions — where output came from, who earned it and who bought it. If you had to judge from one of them alone whether people in a country were better off this year than last, which would you choose, and what would your chosen figure still leave you unable to say?
20.9 Objective Questions
- Which one of the following is not included in national income? [1]
- Imputed rent of an owner-occupied house
- Foodgrains kept back by a farmer for his family
- Old-age pension paid by the government
- Commission earned by a broker on the sale of an old house
- Read the assertion and the reason given below and choose the correct option. [1] Assertion (A): The contribution an employee himself makes to a provident fund is not added to compensation of employees. Reason (R): It is paid out of wages and salaries, which have already been counted.
- Both A and R are true, and R is the correct explanation of A
- Both A and R are true, but R is not the correct explanation of A
- A is true but R is false
- A is false but R is true
- Fill in the blank: the value of output of an enterprise is its sales plus the ______ . [1]
- State whether the following statement is true or false: expenditure by a household on the purchase of shares is counted under the expenditure method of measuring national income. [1]
- Match each item in Column I with the item in Column II to which it belongs. [1]
| Column I | Column II |
|---|---|
| a. Mixed income | i. Rent-free accommodation provided to an employee |
| b. Operating surplus | ii. Royalty received from a patent |
| c. Compensation in kind | iii. Earnings of a carpenter who works on his own account |
20.10 Check Your Concepts
- Define value added, and state why an estimator works with value added rather than with the sales of every producer. [2]
- Giving a reason in each case, state whether the following are included in national income: (a) interest paid on the national debt, (b) the commission earned by a broker on the sale of a second-hand car, (c) foodgrains a farmer keeps back for his family. [3]
- From the following data, calculate the net value added at factor cost by a firm: sales ₹14,00,000; opening stock ₹90,000; closing stock ₹1,30,000; purchase of raw materials and other inputs from other firms ₹7,20,000; depreciation ₹60,000; indirect taxes ₹90,000; subsidies ₹15,000. [4]
- Describe the steps involved in estimating national income by the value-added method, and state any two precautions that must be observed while applying it. [6]
20.11 Case-Based Question
- Meera Handlooms is a small weaving unit in a district town. During the year it bought yarn, dyes and other inputs worth ₹6,00,000 from other firms and sold cloth worth ₹11,00,000. Cloth worth ₹40,000 was lying unsold in its godown at the beginning of the year and cloth worth ₹1,00,000 was lying unsold at the end of it. Its looms depreciated by ₹50,000 during the year.
- Calculate the value of output and the gross value added at market price of Meera Handlooms for the year. [2]
- The owner argues that the cloth still lying in the godown should be left out of the year’s output because nobody has bought it. Explain why it is nevertheless counted, and state how it is treated under the expenditure method. [2]